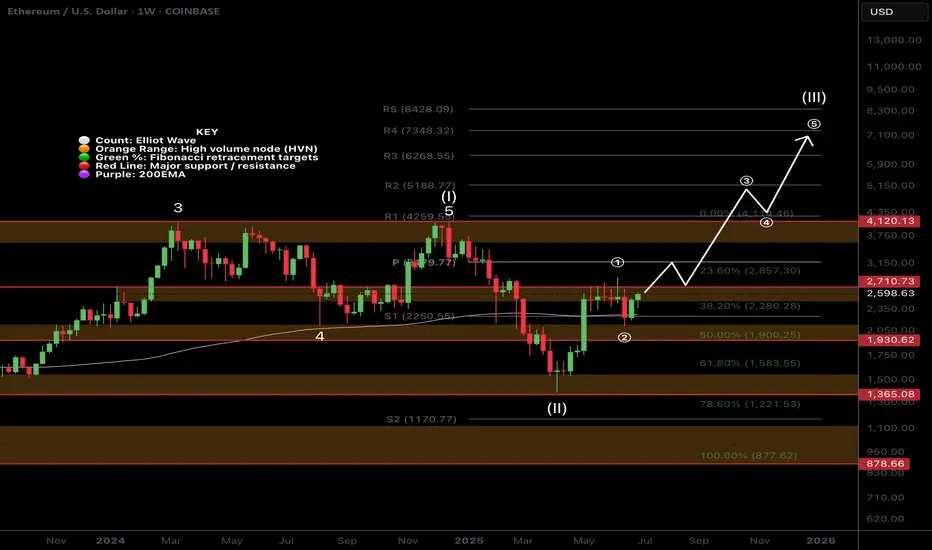
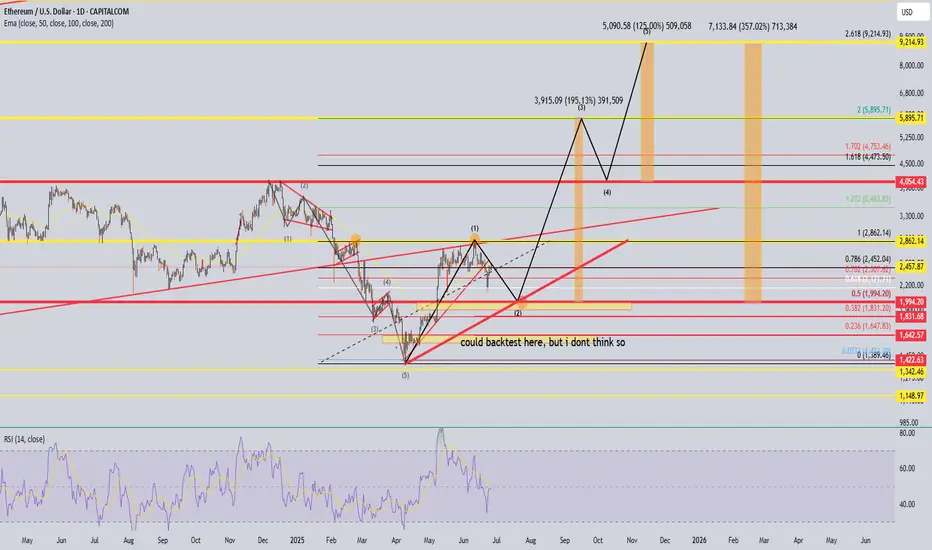
$ETH Wave 3 of 3 Underway?CRYPTOCAP:ETH is back into the range EQ as alt coins pump on the back of CRYPTOCAP:BTC breakout
Price caught a strong bid after testing quadruple support: the major High Volume Node (HVN), daily 200EMA, 0.5 Fibonacci Retracement and daily S1 Pivot. Last week I posted about this area holding to kick off wave 3.
There is still work to do to overcome the recent swing high at HVN major resistance but things are certainly looking bullish. The daily pivot point sits at $3150 as the next target.
Long term terminal target for wave 3 is still the R4 daily pivot at $7340, I don't expect the terminal wave 5 to extend much beyond this, perhaps a wick above to trap retail at the top with a lot of media hype attached.
Analysis is invalidated if we fall below wave (2) swing low $2050.
Safe trading
ETHEREUM trade ideas
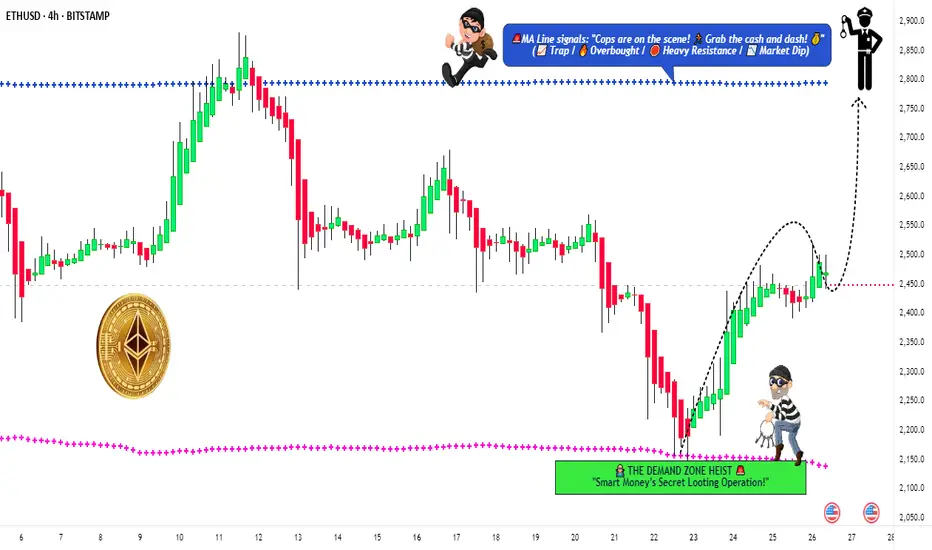
ETH/USD ROBBERY IN PROGRESS! Long Now, Exit Before Bears Attack!🚨 ETH/USD HEIST ALERT: Bullish Loot Before the Trap! 🚨
Thief Trading Style: Steal Profits & Escape Before the Cops Arrive!
🌟 Greetings, Market Pirates & Profit Bandits! 🌟
(Hola! Oi! Bonjour! Hallo! Marhaba!)
🔥 The Ethereum vault is WIDE OPEN! Time to execute the Thief Trading Strategy—bullish momentum is primed for a heist. Long entries only! Target the highs, then vanish before the overbought trap snaps shut.
🔑 Heist Plan (Day/Swing Trade)
🎯 Entry: "The vault is unguarded—swipe bullish loot at any price!"
Pro Tip: Use buy limits within 15-30min for pullback entries (recent swing lows/highs).
🛑 Stop Loss:
Thief SL (4H): 2240.0 (Nearest swing low)
Adjust SL based on risk, lot size & multiple orders.
🏴☠️ Target: 2800.0 (or escape earlier if bears ambush!)
⚡ Scalpers’ Quick Loot:
Only scalp LONG!
Big wallets? Charge in! Small wallets? Join swing traders & rob smart.
Trailing SL = Your Escape Rope!
📢 Why Ethereum?
🐂 Bullish momentum + strong fundamentals = Perfect heist conditions!
(Check COT reports, macro trends & sentiment— check 👉🔗!)
⚠️ WARNING: Cops (Bears) Are Setting Traps!
Avoid fresh trades during news!
Trailing SL = Lock profits & run!
💥 BOOST THIS HEIST!
🔥 More boosts = Faster profits!
🚀 Daily robberies = Easy money!
Stay tuned—next heist coming soon! 🤑💎 (Like & Follow for more loot!)
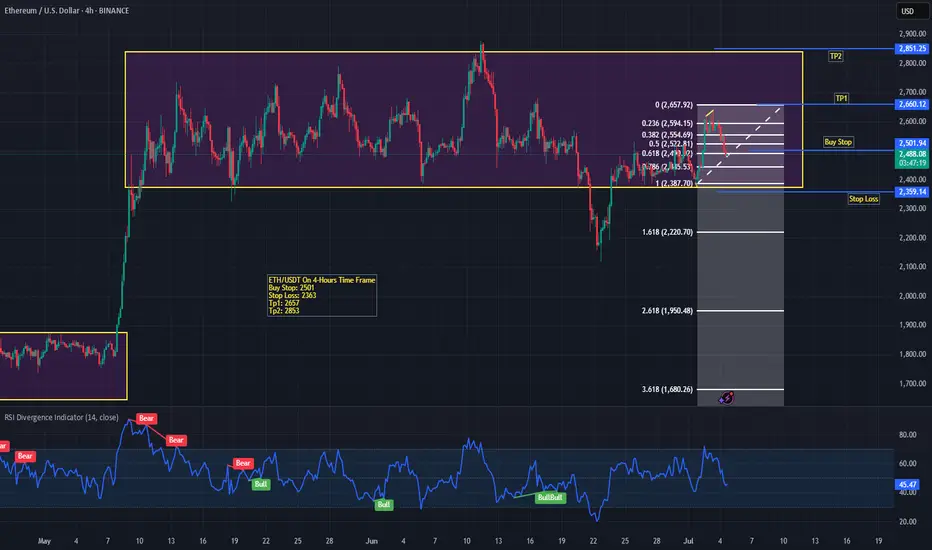
ETH/USDT – 4H Chart AnalysisEthereum is currently trading within a broad consolidation range between $2,387 (support) and $2,657 (resistance) on the 4H timeframe. After a sharp pullback from range highs, price is retesting the mid-range and Fibonacci levels, offering a potential bullish setup.
Trading Plan:
Buy Stop: $2,501 (confirmation of upward momentum)
Stop Loss: $2,363 (below key support zone)
Take Profit 1 (TP1): $2,657 (range resistance)
Take Profit 2 (TP2): $2,853 (projected breakout target
) Key Levels to Watch:
Support Zone: $2,387 – $2,363
Resistance Zone: $2,657 – $2,853
Fib Retracements: 38.2% @ $2,554 & 61.8% @ $2,472
📊 Bias: Bullish above $2,501, caution if price dips below $2,363.
RSI is hovering near 44, suggesting neutral momentum with potential room for upside if buying pressure increases.
Ethereum (ETH/USDT) Preparing for a Massive LaunchEthereum (ETH), the second-largest crypto and the backbone of the DeFi ecosystem, is currently trading around $2,599, marking a modest 6.09% rise over the past 24 hours. The latest dip caught the attention of traders and analysts alike, especially as Ethereum recently broke out of a prolonged consolidation range. With renewed interest from institutional players, growing ETF inflows, and long-term holders quietly accumulating, the ETH price reached a critical juncture and is about to break above the barrier.
So, is this just a healthy rise before another pullback or the start of a strong ascending trend?
Ethereum has been testing resistance around the $2,460 to $2,520 range, a zone it has struggled to break convincingly. This level acts as a technical ceiling, with price action repeatedly getting rejected. This has made it a strong resistance zone, but it has been defending the support range around $2100. This suggests the ETH price is building a strong bullish case, which may propel the price to new highs.
The long-term price action looks so impressive as the ETH price has finally risen above the barrier at $2540 and reached $2600. After experiencing major volatility in the past couple of weeks, the upcoming weekly close is expected to unlock the levels not visited since February 2025. On the other hand, the weekly RSI has reached the crucial juncture as it tests the descending trend line and a rise above the levels could validate a rise above the bearish influence.
Besides, the weekly candle is finding its resistance at the 200-day MA at $2,642 and support at the 50-day MA at $2,431; hence, achieving the resistance could push the levels into the pivotal zone between $2,692 and $2,808. Once these levels are cleared, then the Ethereum (ETH) price could reach $3000 and a sustained upswing could elevate the levels to new highs.
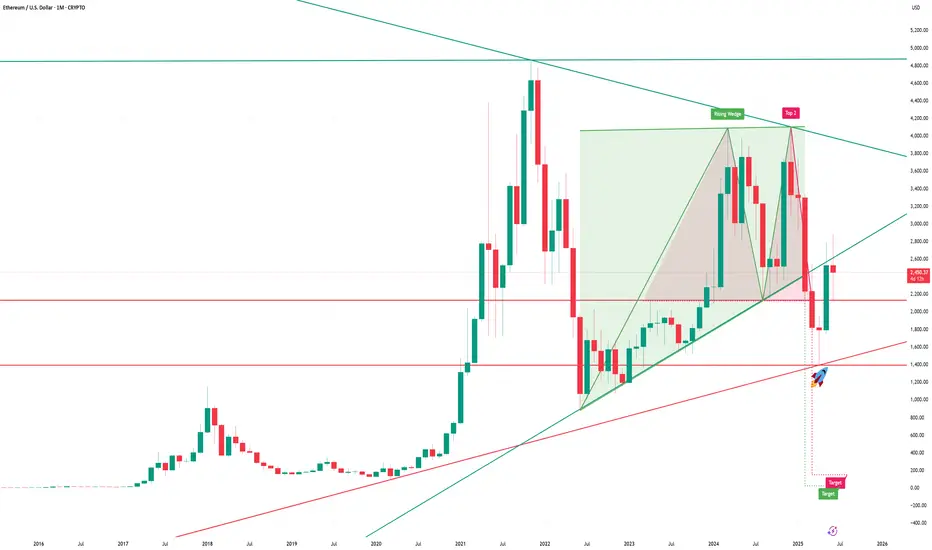
ETH H&S Pattern ?ETH H&S Pattern ?____ Who knows_______
Will the end of this year be crypto bullish year ? DCA brother.
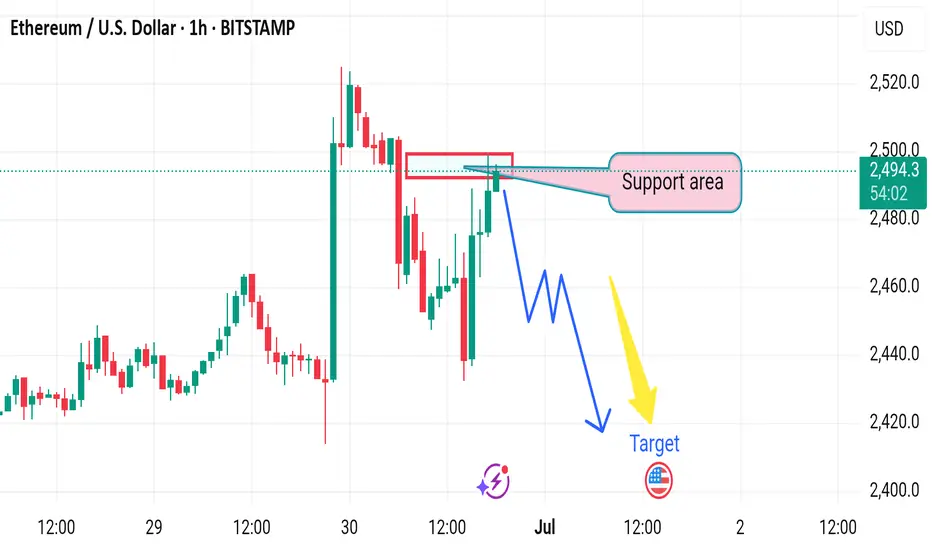
Market next target 🔀 Disruption Analysis – Bullish Alternative Scenario
The current chart suggests a bearish outlook from the resistance zone (~$2,495–$2,500), targeting a drop below $2,425. However, here’s how a bullish disruption could break this bearish narrative:
---
🟢 Bullish Disruption Possibility:
1. Support Reclaim & Strong Buyer Reaction:
If price reclaims and holds above the marked “support area” (~$2,495), it could signal strength and trap early sellers.
A strong bullish candle closing above $2,505 could invalidate the bearish scenario.
2. Higher Low Formation:
If ETH prints a higher low above $2,470, it would suggest buyers are stepping in early, reinforcing bullish momentum.
3. Target Shift – Bullish Continuation:
A confirmed breakout above $2,505 may open the path to $2,540–$2,560 as the new short-term target zone.
4. Momentum Catalyst:
A positive U.S. macroeconomic event or crypto-specific bullish news (e.g., ETF, institutional inflows) could fuel upside disruption.
Eth/UsdA possible bullish move according to Daily time frame .
A possible drop according to 1h,15m time frame . So since well DXY might go up to a certain area to make price changes , for me that means all USD Pairs might drop for a period of time to mitigate areas that will push it back up.
I will see how it goes.
Happy Trading
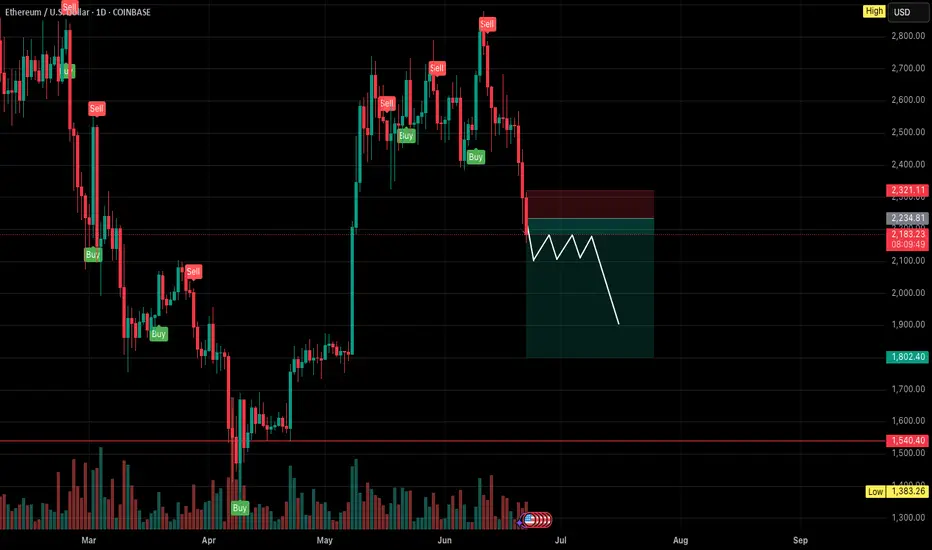
Strong bearish momentum for EthereumCOINBASE:ETHUSD Expecting bearish continuation for Ethereum. Consolidation around 2100 and either a push downward to 1900 - 1800 or if peace is made with Iran and Israel, price could reverse and push back to the 2000 range. Let me know your thoughts everyone :)
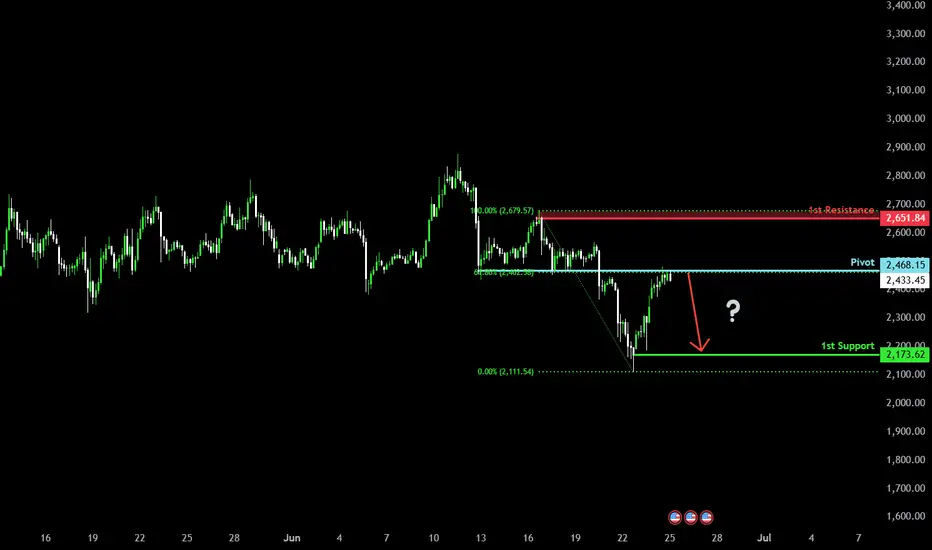
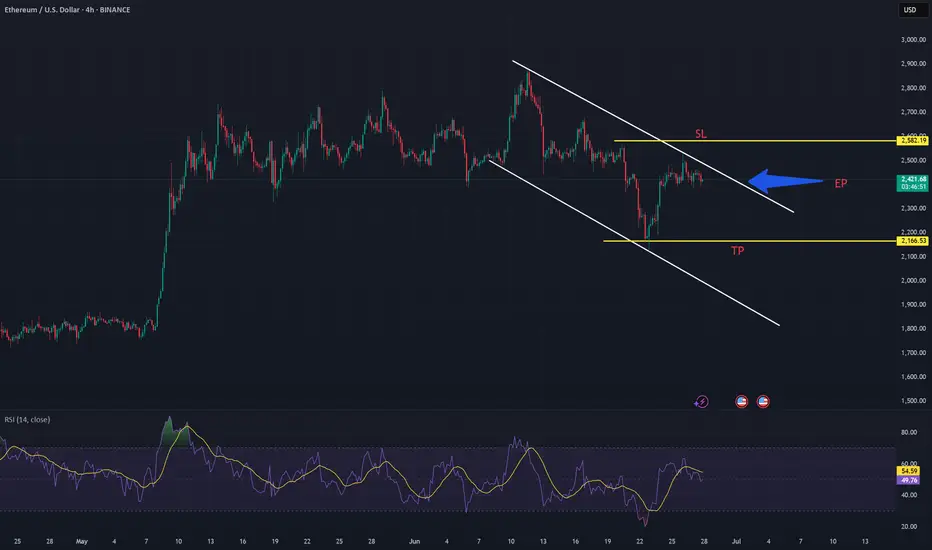
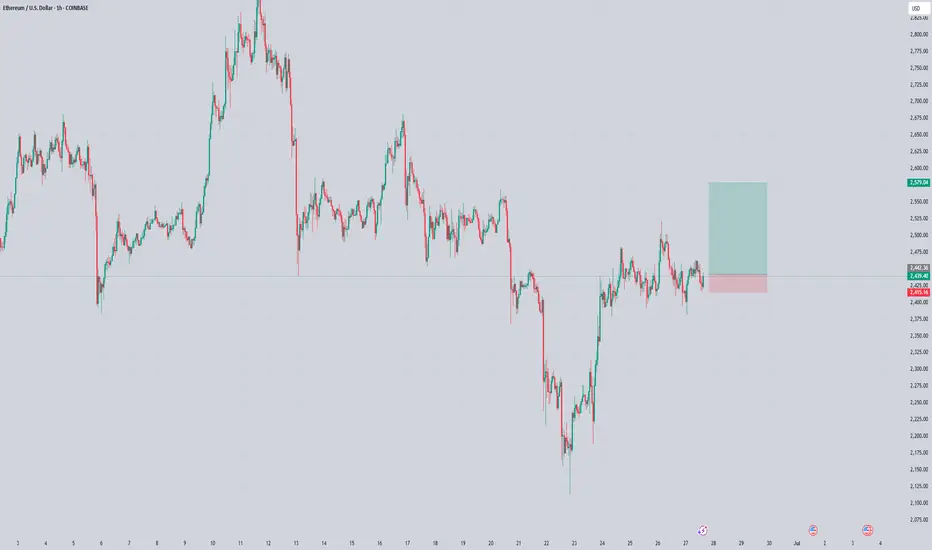
Bearish reversal?Ethereum (ETH/USD) is reacting off the pivot and could drop to the 1st support.
Pivot: 2,468.15
1st Support: 2,173.62
1st Resistance: 2,651.84
Risk Warning:
Trading Forex and CFDs carries a high level of risk to your capital and you should only trade with money you can afford to lose. Trading Forex and CFDs may not be suitable for all investors, so please ensure that you fully understand the risks involved and seek independent advice if necessary.
Disclaimer:
The above opinions given constitute general market commentary, and do not constitute the opinion or advice of IC Markets or any form of personal or investment advice.
Any opinions, news, research, analyses, prices, other information, or links to third-party sites contained on this website are provided on an "as-is" basis, are intended only to be informative, is not an advice nor a recommendation, nor research, or a record of our trading prices, or an offer of, or solicitation for a transaction in any financial instrument and thus should not be treated as such. The information provided does not involve any specific investment objectives, financial situation and needs of any specific person who may receive it. Please be aware, that past performance is not a reliable indicator of future performance and/or results. Past Performance or Forward-looking scenarios based upon the reasonable beliefs of the third-party provider are not a guarantee of future performance. Actual results may differ materially from those anticipated in forward-looking or past performance statements. IC Markets makes no representation or warranty and assumes no liability as to the accuracy or completeness of the information provided, nor any loss arising from any investment based on a recommendation, forecast or any information supplied by any third-party.
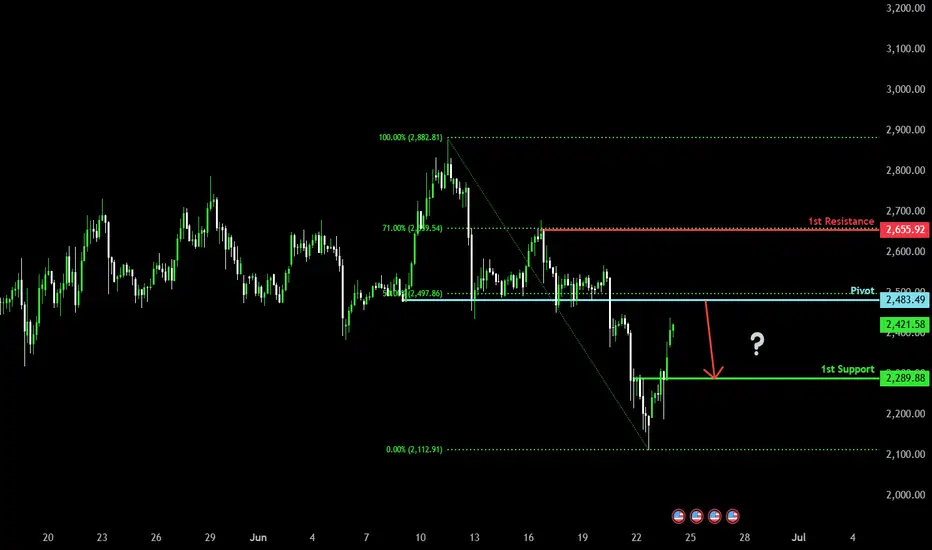
Pullback resistance ahead?The Ethereum (ETH/USD) is rising towards the pivot which has been identified as a pullback resistance that lines up with the 50% Fibonacci retracement and could drop to the 1st support.
Pivot: 2,483.49
1st Support: 2,289.88
1st Resistance: 2,655.92
Risk Warning:
Trading Forex and CFDs carries a high level of risk to your capital and you should only trade with money you can afford to lose. Trading Forex and CFDs may not be suitable for all investors, so please ensure that you fully understand the risks involved and seek independent advice if necessary.
Disclaimer:
The above opinions given constitute general market commentary, and do not constitute the opinion or advice of IC Markets or any form of personal or investment advice.
Any opinions, news, research, analyses, prices, other information, or links to third-party sites contained on this website are provided on an "as-is" basis, are intended only to be informative, is not an advice nor a recommendation, nor research, or a record of our trading prices, or an offer of, or solicitation for a transaction in any financial instrument and thus should not be treated as such. The information provided does not involve any specific investment objectives, financial situation and needs of any specific person who may receive it. Please be aware, that past performance is not a reliable indicator of future performance and/or results. Past Performance or Forward-looking scenarios based upon the reasonable beliefs of the third-party provider are not a guarantee of future performance. Actual results may differ materially from those anticipated in forward-looking or past performance statements. IC Markets makes no representation or warranty and assumes no liability as to the accuracy or completeness of the information provided, nor any loss arising from any investment based on a recommendation, forecast or any information supplied by any third-party.
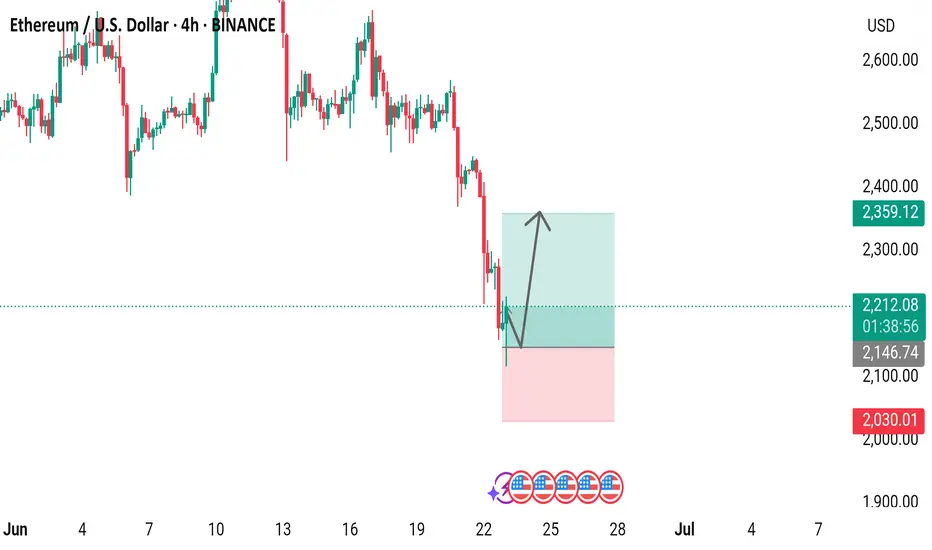
Ethereum/US Dollar 4-Hour Chart (BINANCE)4-hour price movement of Ethereum (ETH) against the US Dollar (USD) on the BINANCE exchange. The current price is $2,211.36, reflecting a decrease of $85.21 (-3.71%). The chart highlights a recent downward trend with a potential support zone between approximately $2,100 and $2,200, followed by a possible upward movement as indicated by the shaded area. The data is captured as of June 23, 2025.
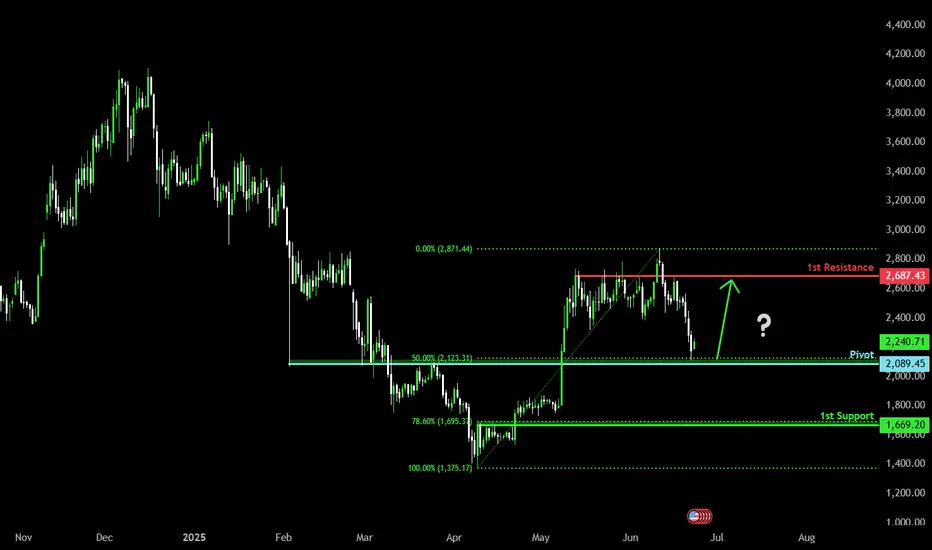
Bullish bounce off 50% Fibonacci support?The Ethereum (ETH/USD) is reacting off the pivot which has been identified as an overlap support and could bounce to the 1st resistance.
Pivot: 2,089.45
1st Support: 1,669.20
1st Resistance: 2,687.43
Risk Warning:
Trading Forex and CFDs carries a high level of risk to your capital and you should only trade with money you can afford to lose. Trading Forex and CFDs may not be suitable for all investors, so please ensure that you fully understand the risks involved and seek independent advice if necessary.
Disclaimer:
The above opinions given constitute general market commentary, and do not constitute the opinion or advice of IC Markets or any form of personal or investment advice.
Any opinions, news, research, analyses, prices, other information, or links to third-party sites contained on this website are provided on an "as-is" basis, are intended only to be informative, is not an advice nor a recommendation, nor research, or a record of our trading prices, or an offer of, or solicitation for a transaction in any financial instrument and thus should not be treated as such. The information provided does not involve any specific investment objectives, financial situation and needs of any specific person who may receive it. Please be aware, that past performance is not a reliable indicator of future performance and/or results. Past Performance or Forward-looking scenarios based upon the reasonable beliefs of the third-party provider are not a guarantee of future performance. Actual results may differ materially from those anticipated in forward-looking or past performance statements. IC Markets makes no representation or warranty and assumes no liability as to the accuracy or completeness of the information provided, nor any loss arising from any investment based on a recommendation, forecast or any information supplied by any third-party.
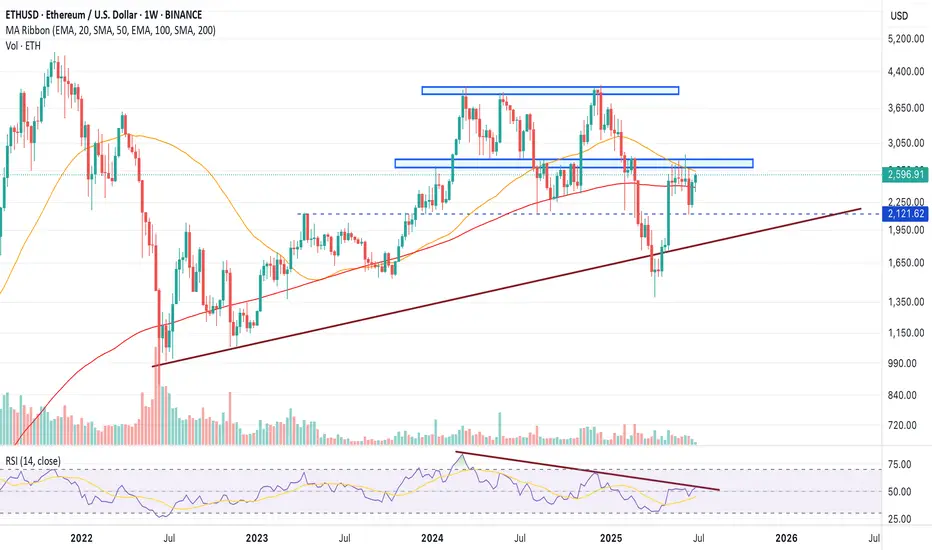
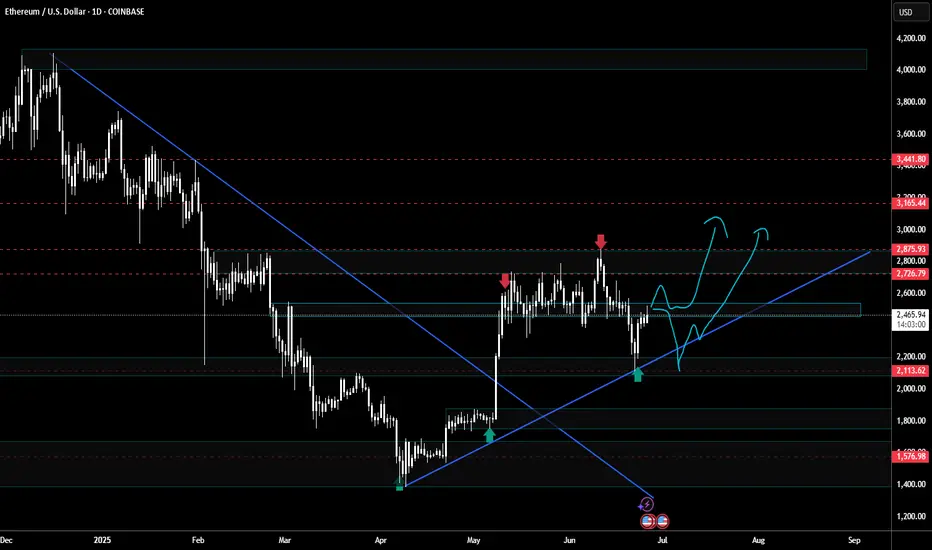
$ETH – Three Possible Scenarios in the Near FutureCRYPTOCAP:ETH – Three Possible Scenarios in the Near Future:
🔹 Optimistic: Rally towards $4,400
🔹 Conservative: Growth to $2,800
🔹 Pessimistic: Drop to $2,000
🚨 Key Levels to Watch:
▪️ $2,675 — breakout above this level could open the path to $2,800 – $2,900
▪️ $2,900 — breakout here may lead ETH toward $4,000
▪️ $4,150 — breakout of this level may push ETH to $4,400
▪️ $2,100 — if this level breaks downward, it may lead ETH to $1,400 – $1,500
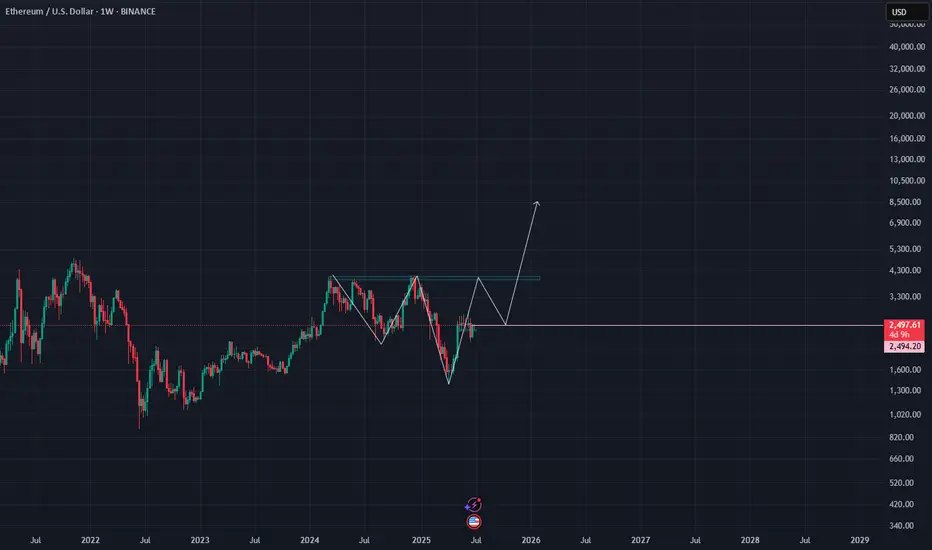
Eth 357% tradeI see a cup and handle forming. Hopefully we get some triangle and it breaks out. I put my bets at the 0.5 fib (level 1994.20) Nice 357% mamacitas!!
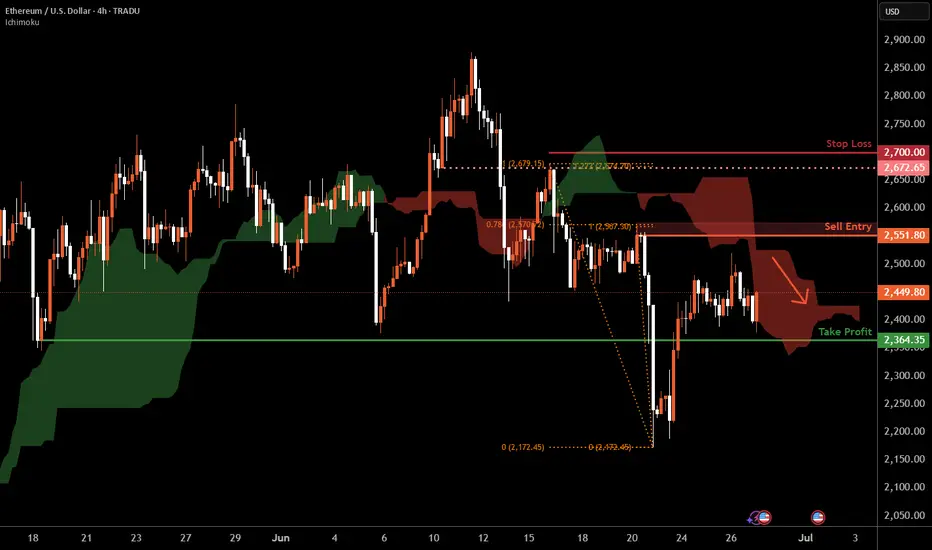
Ethereum H4 | Resistance at 78.6% Fibonacci retracementEthereum (ETH/USD) is rising towards a pullback resistance and could potentially reverse off this level to drop lower.
Sell entry is at 2,551.80 which is a pullback resistance that aligns closely with the 78.6% Fibonacci retracement.
Stop loss is at 2,700.00 which is a level that sits above the 127.2% Fibonacci extension and an overlap resistance.
Take profit is at 2,364.35 which is a pullback support.
High Risk Investment Warning
Trading Forex/CFDs on margin carries a high level of risk and may not be suitable for all investors. Leverage can work against you.
Stratos Markets Limited (tradu.com ):
CFDs are complex instruments and come with a high risk of losing money rapidly due to leverage. 63% of retail investor accounts lose money when trading CFDs with this provider. You should consider whether you understand how CFDs work and whether you can afford to take the high risk of losing your money.
Stratos Europe Ltd (tradu.com ):
CFDs are complex instruments and come with a high risk of losing money rapidly due to leverage. 63% of retail investor accounts lose money when trading CFDs with this provider. You should consider whether you understand how CFDs work and whether you can afford to take the high risk of losing your money.
Stratos Global LLC (tradu.com ):
Losses can exceed deposits.
Please be advised that the information presented on TradingView is provided to Tradu (‘Company’, ‘we’) by a third-party provider (‘TFA Global Pte Ltd’). Please be reminded that you are solely responsible for the trading decisions on your account. There is a very high degree of risk involved in trading. Any information and/or content is intended entirely for research, educational and informational purposes only and does not constitute investment or consultation advice or investment strategy. The information is not tailored to the investment needs of any specific person and therefore does not involve a consideration of any of the investment objectives, financial situation or needs of any viewer that may receive it. Kindly also note that past performance is not a reliable indicator of future results. Actual results may differ materially from those anticipated in forward-looking or past performance statements. We assume no liability as to the accuracy or completeness of any of the information and/or content provided herein and the Company cannot be held responsible for any omission, mistake nor for any loss or damage including without limitation to any loss of profit which may arise from reliance on any information supplied by TFA Global Pte Ltd.
The speaker(s) is neither an employee, agent nor representative of Tradu and is therefore acting independently. The opinions given are their own, constitute general market commentary, and do not constitute the opinion or advice of Tradu or any form of personal or investment advice. Tradu neither endorses nor guarantees offerings of third-party speakers, nor is Tradu responsible for the content, veracity or opinions of third-party speakers, presenters or participants.
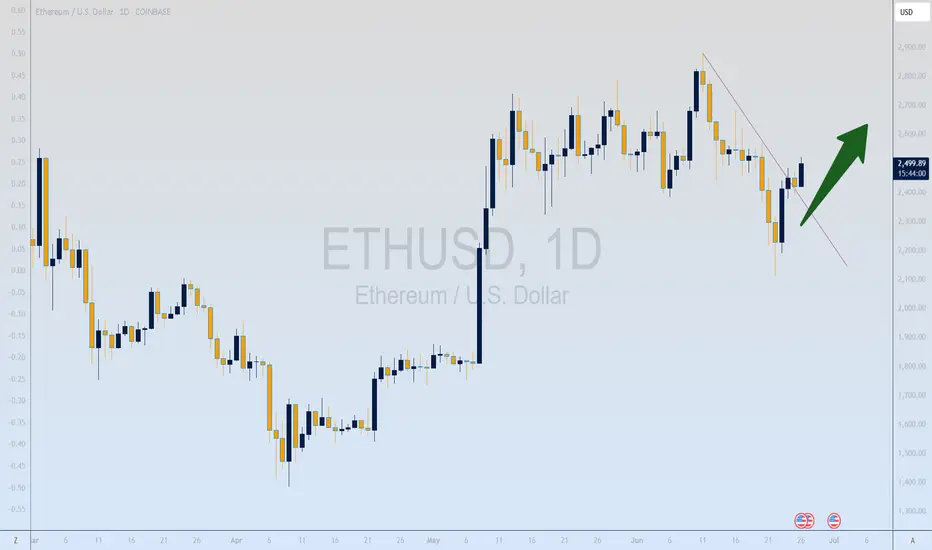
ETH READY TO RIPAfter enduring a prolonged and painful correction, Ethereum has tested the patience of many crypto investors, particularly those anticipating the long-awaited arrival of altcoin season. Sentiment across the space has remained cautious, as repeated failed rallies and a lack of follow-through have left many questioning whether the broader alt market will ever regain momentum.
However, there are now early indications that conditions may be shifting. A notable bounce has occurred from the overall low anchored VWAP—a level that has historically acted as a key reference point for value and trend continuation. The presence of responsive buyers at this level suggests it may be establishing itself as a strong demand zone, potentially forming the foundation for a broader structural reversal.
Additionally, subtle but important changes in market structure are beginning to emerge. We're seeing higher lows form on shorter timeframes, alongside a reduction in selling pressure—both of which are early signs of a possible trend change. If Ethereum can sustain its hold above this support and reclaim key resistance levels with strength, it could ignite renewed confidence across the altcoin market.
Should this prove to be a meaningful low, it may very well set the stage for alt season to finally take shape—bringing with it a rotation of capital into high-beta assets and broader participation across the crypto space.
ETH on resistance.Ethereum 2 possible probabilities. 1 shows back demand level around 2100$ the other is a break of 2500$ and retest.
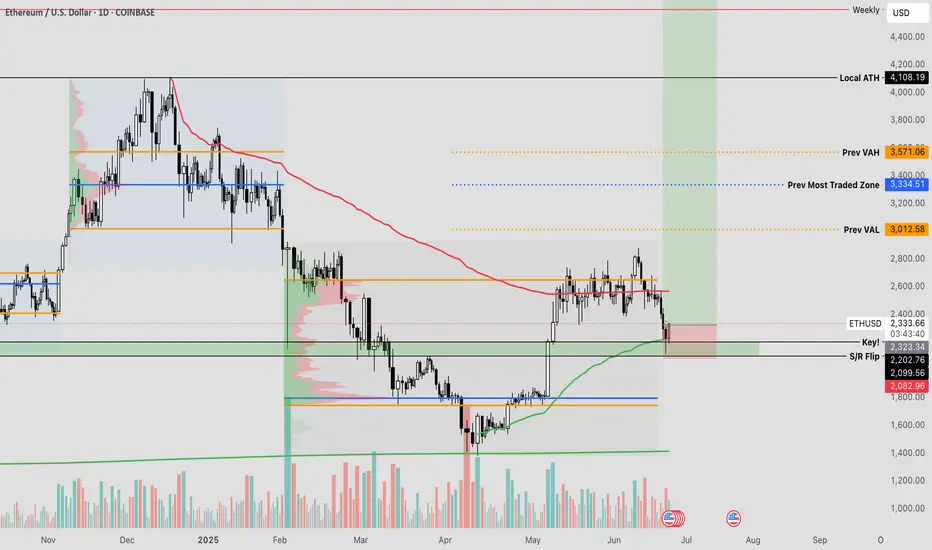
Ethereum Primed for Breakout as Institutional Interest SurgesBlackRock's aggressive ETH accumulation—$276M in February, $98M just this week—signals institutional conviction as Ethereum approaches a breakout towards $3,000. With real-world asset (RWA) tokenization exploding to $21B+ (Ethereum commanding 59% market share) and stablecoin volume hitting record $717B monthly highs, ETH is positioned as the backbone of traditional finance's blockchain migration.
The convergence of institutional buying, technical breakout signals, and Ethereum's dominance in the fastest-growing crypto sectors creates a perfect storm for the next major price surge 🚀
intel.arkm.com
ETH - ORDER BOOK - BIG LEVELS Ethereum Order Book Analysis | Key ETH Levels Revealed (Real-Time Liquidity Zones)
In this video, we dive into the Ethereum (ETHUSD) order book to uncover major liquidity levels that could influence price action in the short and medium term. By analyzing real-time data, we identify where whales and institutions are placing large orders, which often act as strong support and resistance zones.
What You’ll Learn:
• How to spot large buy/sell walls on the ETH order book
• Why these levels matter for short-term traders
• Real-time reactions to major liquidity zones
• Potential long/short trade setups around key areas
This is essential viewing if you’re trading ETH intraday or swing, and want to anticipate where the next major move may come from.
⸻
Tools Used:
• ETHUSD price chart
• Real-time order book data
• Volume heatmaps
• Liquidity zone mapping
• Sentiment Tool
⸻
Stay ahead of the crowd by understanding how the market reacts to big players’ order placements. Don’t forget to leave a comment with your ETH target, and follow for more pro-level crypto analysis.
⸻
#Ethereum #ETHUSD #ETHAnalysis #CryptoTrading #OrderBook #ETHOrderFlow #LiquidityLevels #CryptoTA #PriceAction #WhaleWatching

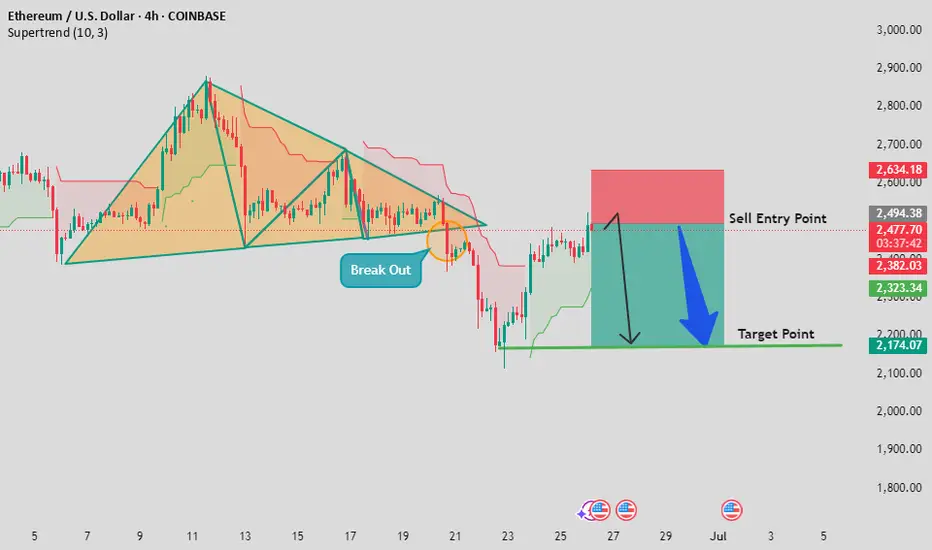
ETH/USDT 4H – Bearish Breakout OpportunityA symmetrical triangle pattern has formed and recently broke out to the downside, indicating a potential short-selling opportunity. We've marked the Sell Entry Point and the Target Point at $2,174.07 based on the pattern projection. Price action confirms the move,
Risk management is key – trade responsibly!
👥 Share your thoughts in the comments below – I’d love to hear your opinion on this setup.
❤️ If you found this idea useful, don’t forget to like and support!
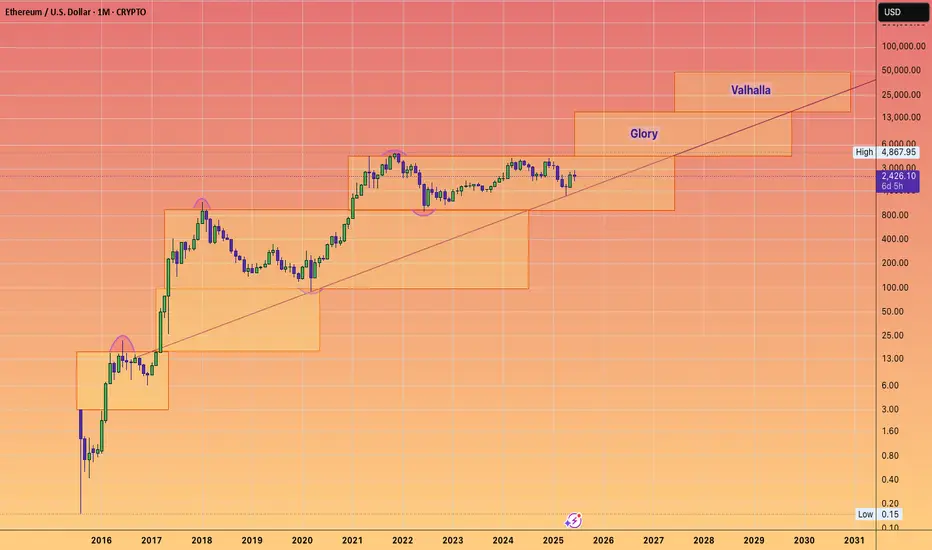
Do you want to have glory? Do want to see Valhalla?#HODL
These next few years will could change your life.
#ETHEREUM is cheap right now.
#ETH still can do tens of X's