eth day 3 price prediction date: 3/30/2025eth has started to do my other outcome of having a lower end of wave Z and i think once wave Z is finished it could possibly bounce off of the upport and head bullish or break the support and start a bearish impulse wave.
ETHEREUM trade ideas

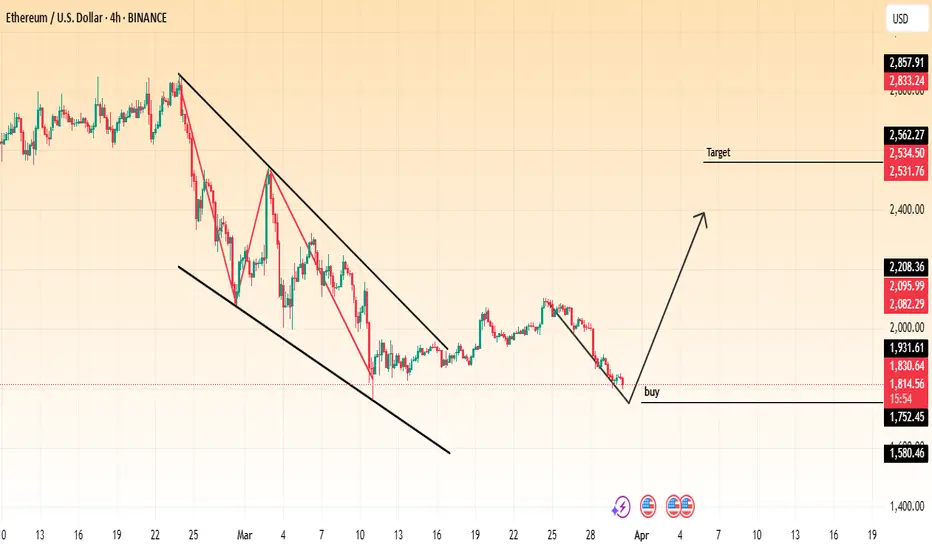
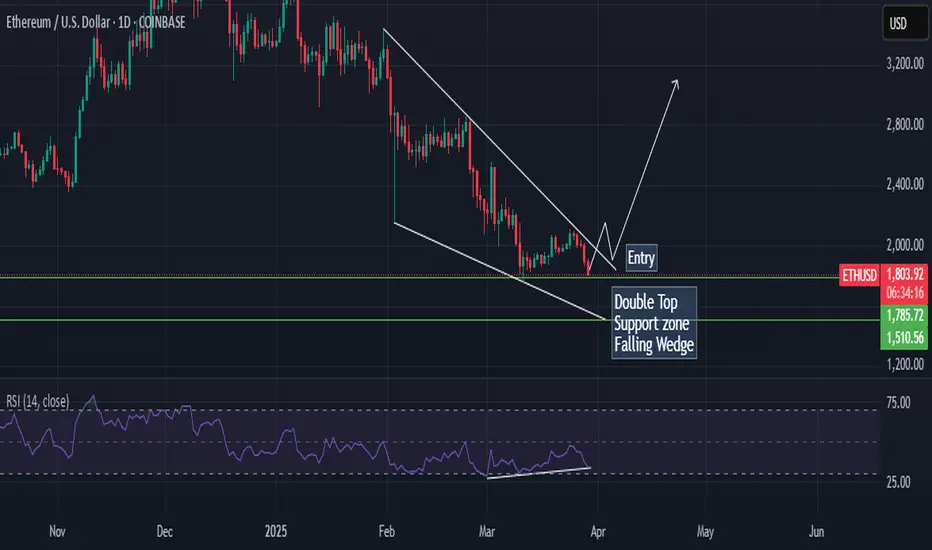
"ETH/USD: Breakout Incoming? Buy Signal from Falling Wedge!"It illustrates a downward trend with a falling wedge pattern, which is a bullish reversal pattern.
Key Observations:
Falling Wedge Pattern:
The price has been trading within a downward-sloping channel.
The wedge pattern suggests a potential breakout to the upside.
Breakout Opportunity:
The price is currently near the lower boundary of the wedge, suggesting a potential buying opportunity.
A buy signal is indicated at a key support level.
Target Price:
The chart has a target zone around $2,531 – $2,562, which suggests an expected upward move.
Technical Indicators:
The price is currently around $1,815, indicating a possible bottom formation.
A bullish move from this level is expected.
Trading Idea:
Entry: Buy near the current price ($1,815).
Target: $2,531 – $2,562.
Stop-Loss: Below $1,723 for risk management.
This analysis suggests a bullish reversal with a potential breakout from the falling wedge. However, traders should confirm with volume and other indicators before entering a trade.

$ETH - Mean reversionCRYPTOCAP:ETH 8 year log-scaled channel, giving 1 s.d and 2 s.d deviations. Around 1600, we are approaching key levels at 1 s.d. below mean.
With institutions loading up, this could be a good spot to start scaling into longs.
ETH next possible move Hi traders I decided to share with you some of my view in crypto following my strategy,as you can see ETH is in some critical zones n can melt more,what do you do as a buyer,you generate liquidity into demand zone,you dont goo against the market unless you have alot of money then you can buy n hold using good risks ok cool according to my view n analysis am seeing more further down side however I will be expecting aggressive rejection towards 1580 and not sure if is gonna reach 930 but demand zone is at 930,soo am gonna watch very carefully how tarrif on 2 April will affect the market n tension in wars,what is moving market weirdo like this is trade war and in coming civilians war that is talking place slowly but it's becoming more n more each n everyday and it is affecting the market soo more tarrif more drops,that's why is important to understand wat is going on in the world as a trader and investors in order to know when to trade n not too thanks n expect more analysis to come today

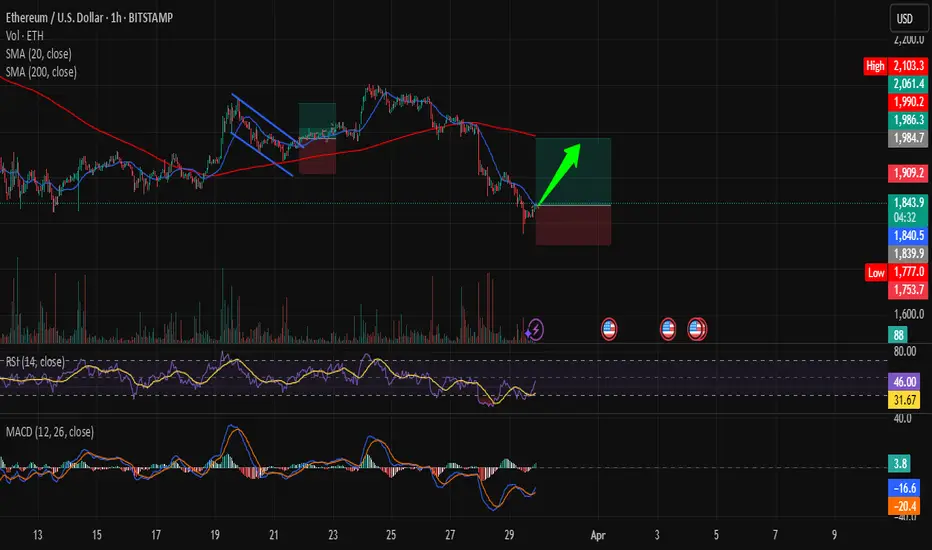
ETHEREUM READY FOR TAKEOFF?Hi traders! Analyzing Ethereum (ETH/USD) on the 1H timeframe, spotting a potential entry:
🔹 Entry: 1,840.30 USD
🔹 TP: 1,990.20 USD
🔹 SL: 1,753.70 USD
Ethereum is showing signs of a possible bullish reversal! RSI is near oversold levels, and if momentum picks up, we could see a strong move toward 1,990.20 USD. Eyes on the charts! 📈
⚠️ DISCLAIMER: This is not financial advice. Trade responsibly.
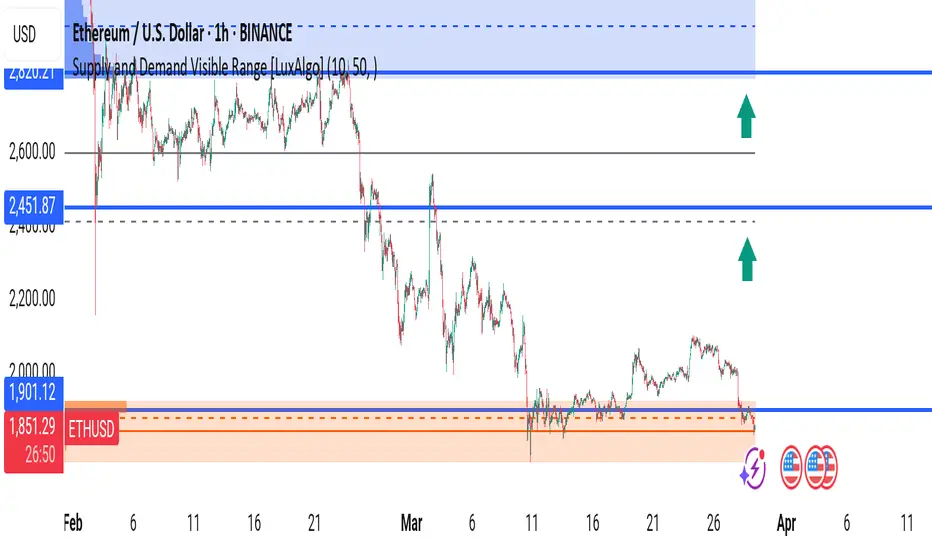
ETH/USDT | Potential Trend Reversal from Monthly Demand Zone📉 Market Overview:
ETH/USDT is currently holding within a strong monthly demand zone, showing signs of possible accumulation. Price has tested this level and indicating a potential reaction.
🔍 Key Trading Conditions:
✅ Liquidity Sweep: If price sweeps the daily previous low, this could be a liquidity grab to trap sellers.
✅ Market Structure Shift (MSS): If price breaks a key lower high to the upside, it would confirm a short term bullish structure shift, signaling a potential trend reversal.
📊 Trade Plan:
🎯 Bullish Confirmation: Wait for a clear MSS to the upside on lower timeframes (4H/1H).
🔹 Entry: After a successful daily low sweep & bullish confirmation.
🔹 SL: Below the liquidity sweep low.
🔹 TP1: Mid-range supply zone.
🔹 TP2: Previous structural highs.
🚨 Risk Management:
Always wait for confirmation before entering.
Monitor price action around key levels.
Manage risk with proper stop-loss placement.
📌 Conclusion:
If ETH sweeps liquidity and shifts structure bullishly, we can expect a potential reversal. Stay patient and let price confirm the move!
📈 Like & Follow for More Market Updates! 🚀

ETHUSD ETHEREUM Long in short termVery hard week for ETHEREUM:
In my opinion eth has a good chance at this level to climb higher
It has nearly brokeen every possible support,but nobuilding signs of deivergences.
The strategy is short term
Never the less ,Trump´s policy is not good nor for crypto neither for other markets.
And thereforwe should think only in short term,taking chances.
On monday /tuesdays positive ton of the white house,on wed/ to Friday aggressive tons,at the weekend then again taming tone of the white house.
This will accompany us until 2029.
Ofcourse it wont be easy.For no one.
Therefor i make 5-10 different strategies,different apporches.
In case the profit targets hit,then its is ok.If not I immediately cut the positions.
STop is below themajor support.
If that level breaks,ETH will potentially fall to 1100-1250. Idont hope,that it happens.But these days,I expect always the unexpected.You may do this,too.
Position sizing: depends on your risk appetite.
I would use stops in any case....Good luck
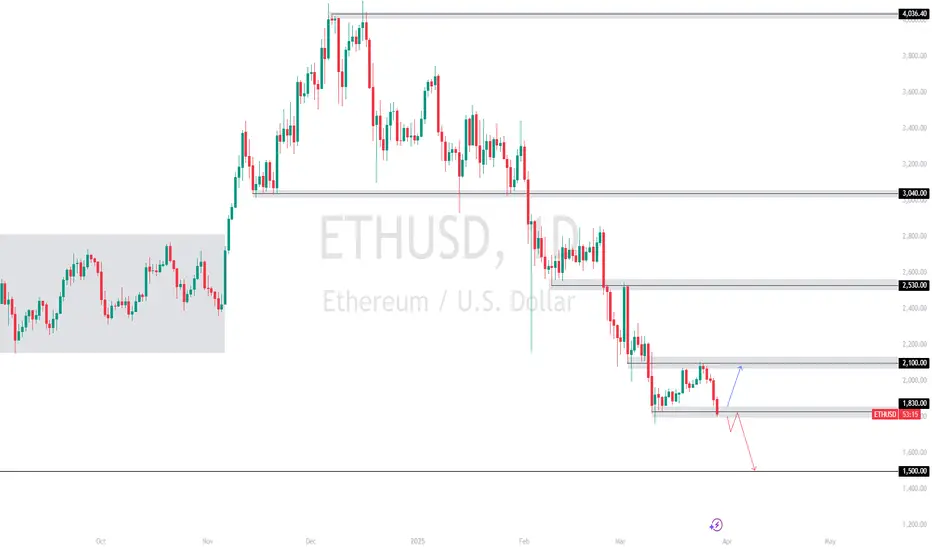
ETHEREUM Technical Outlook ETHUSD Daily Analysis
Ethereum is currently trading at $1,830, testing a critical support level. The price action suggests two potential scenarios:
📈 Bullish Scenario: A rebound from $1,830 could lead to a push towards the $2,100 resistance zone. A breakout above this level would expose $2,530 as the next key target.
📉 Bearish Scenario: A confirmed break below $1,830 would signal further downside momentum, targeting $1,500 as the next major support level.
📌 Key Levels:
Resistance: $2,100, $2,530
Support: $1,830, $1,500
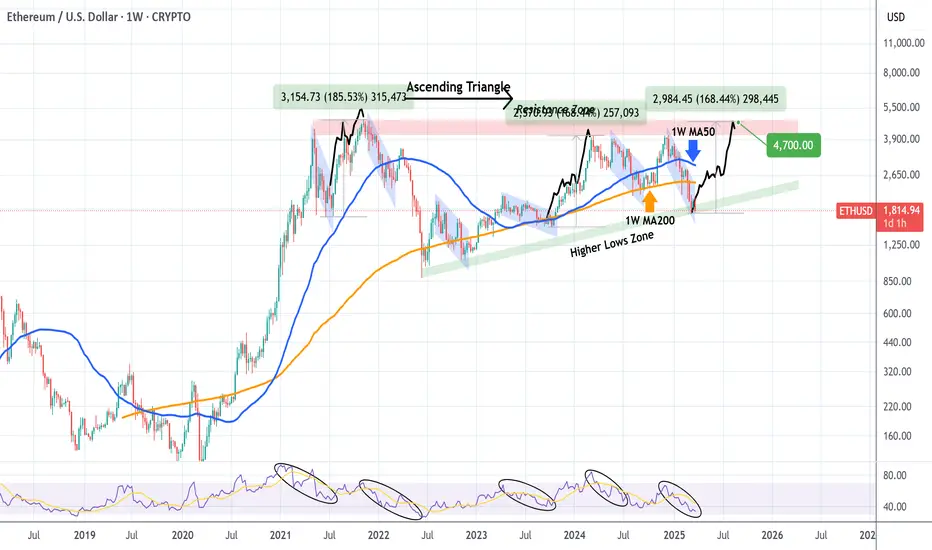
ETHEREUM Targeting 4500-4700Ethereum (ETHUSD) hit 2 weeks ago the bottom (Higher Lows Zone) of its 4-year Ascending Triangle pattern, following the recent 3-month correction.
ETHUSD Bullish ScenarioIn ETHUSD chart shows us clear bullish momentum.
RSI bullish divergence
Double bottom formation
Support zone
Bullish Falling Wedge
All these indicators shows that ETHUSD in upward direction after the breakout of trendline
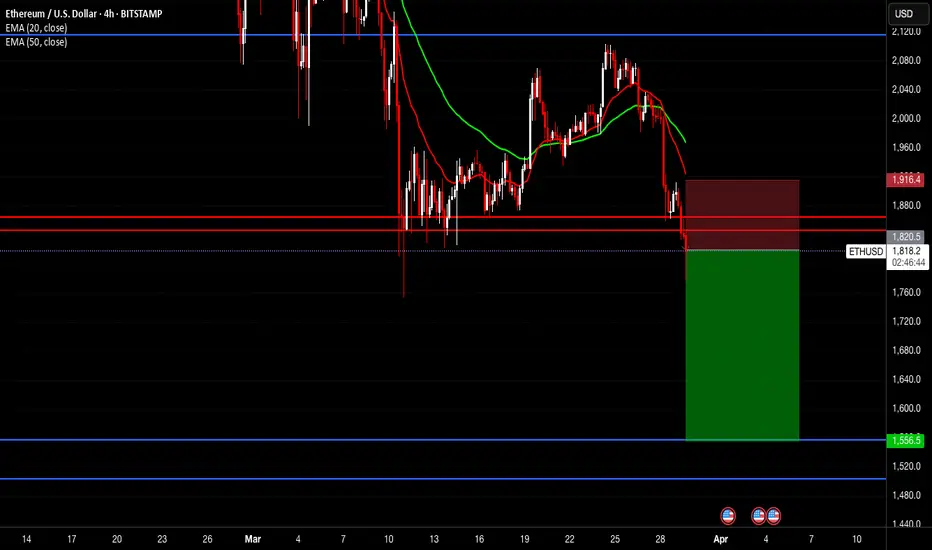
ETHUSDAfter breaking strong weekly support zone, price went back to retest and dipped. Now we've broken H4 support, could have a retest on H1 before having a downward push but all in all we should reach the next weekly support zone of 1,550 - 1,500.
ETH/USD - The BIG Move is Coming! Are You Ready?
📉 Ethereum is at a critical level right now, and the next move could be explosive!
🔍 Key Insights:
✅ Major Resistance: $3,600 – If broken, ETH could rally to $4,000+!
✅ Strong Support: $3,200 – A breakdown here could lead to $2,900!
✅ Indicators flashing bullish signals – Smart money is already positioning!
💡 What’s Next?
With volatility increasing, a breakout trade could be highly rewarding. Are you going long or short? Drop your thoughts in the comments!
🔥 Like & Follow for real-time updates – Don’t miss the next big move!
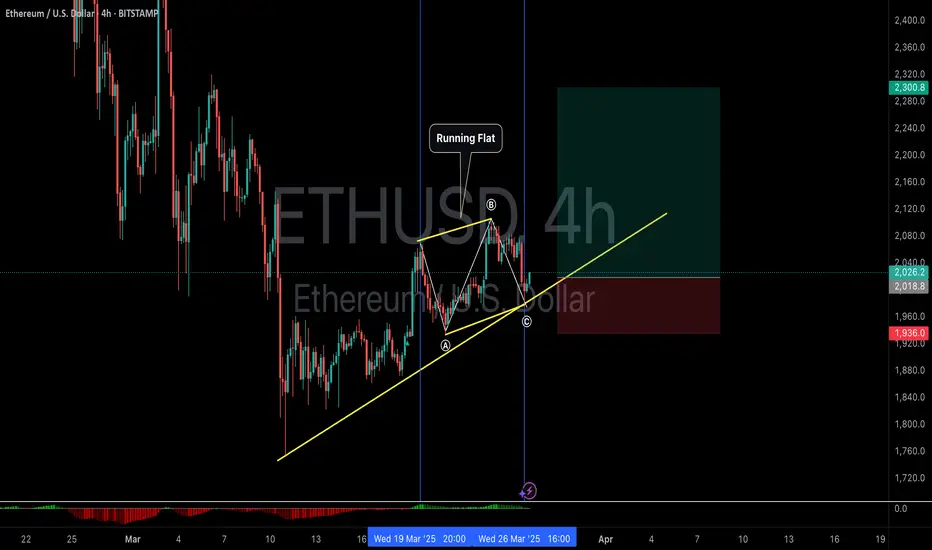
Going Long on ETH with 100x Leverage !Alright, let’s talk about a high-probability setup that I’m trading right now—long ETH, stop-loss at $1,935, take-profit at $2,300. This isn’t just a random entry; it’s based on a super reliable pattern called a Running Flat.
What’s a Running Flat?
A Running Flat is a repetitive market structure that occurs all the time—so often, it feels like an infinite money glitch. It plays out nearly 90% of the time, making it one of the easiest and most profitable patterns to trade.
Think of it like a market cheat code:
📌 It traps early shorts
📌 It creates liquidity for smart money
📌 It explodes in the direction of the trend
And when you spot it? You take the trade, set your stop, and let the magic happen.
Why This ETH Trade?
We’ve got a textbook Running Flat formation
The market is primed for a breakout
The EW 2.0 model confirms the setup
Risk is tightly managed (SL at $1,935 means no overexposure)
100x Leverage – High Risk, High Reward
I know what you’re thinking: 100x leverage? Are you crazy? Well, maybe a little. But when you’re trading a setup with a 90% win rate, it’s all about maximizing opportunity while keeping risk under control. Tight stop, big reward. Simple.
The Trade Plan
✅ Go long ETH
✅ Stop-loss: $1,935 (discipline matters)
✅ Take-profit: $2,300 (targeting the move)
✅ Risk-reward: Favorable and repeatable
Final Thoughts
If this trade works, it’s another example of why Running Flats are pure magic. If it doesn’t? No big deal—we trade the next one.
But history says… we’re about to print money. Let’s see if the infinite money glitch delivers again. 🚀