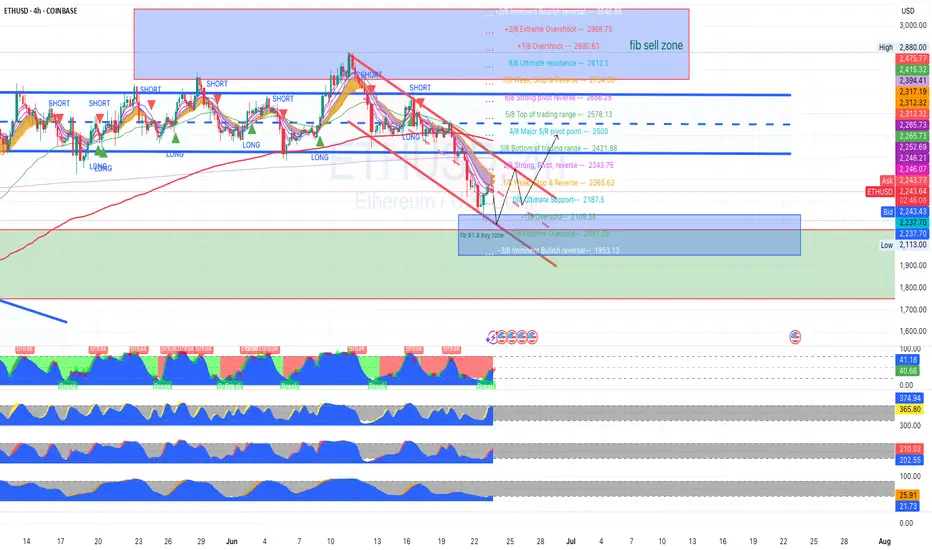
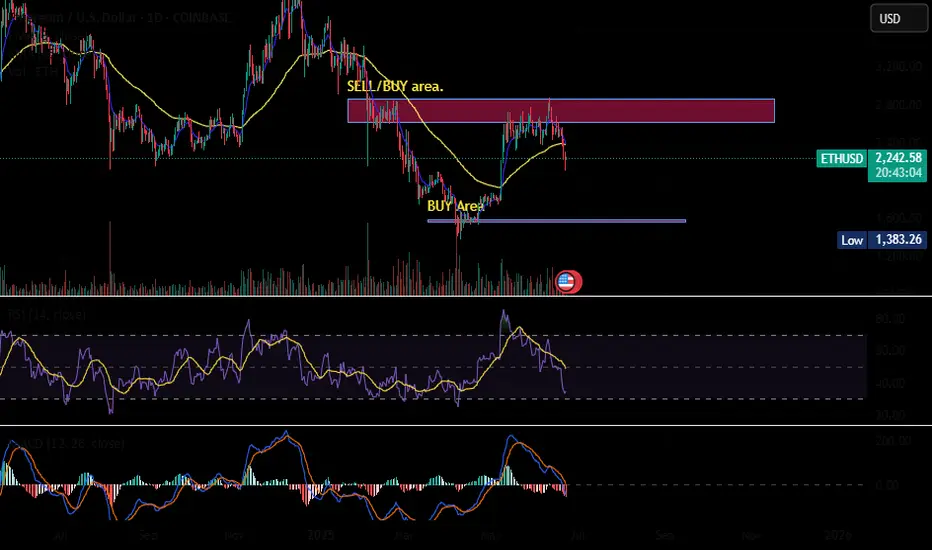
ETHUSD Utilizing the technicals of channels, support and resistance and OB and OS
CURRENT GEOPOLITICAL TENSIONS CAN ALTER THIS BIAS
MY BIAS, short term sell then buy with a pull back and continued push to the upside
Opinion: This analysis is for education purposes only and is just my analysis, this is not a trade idea.
ETHEREUM trade ideas
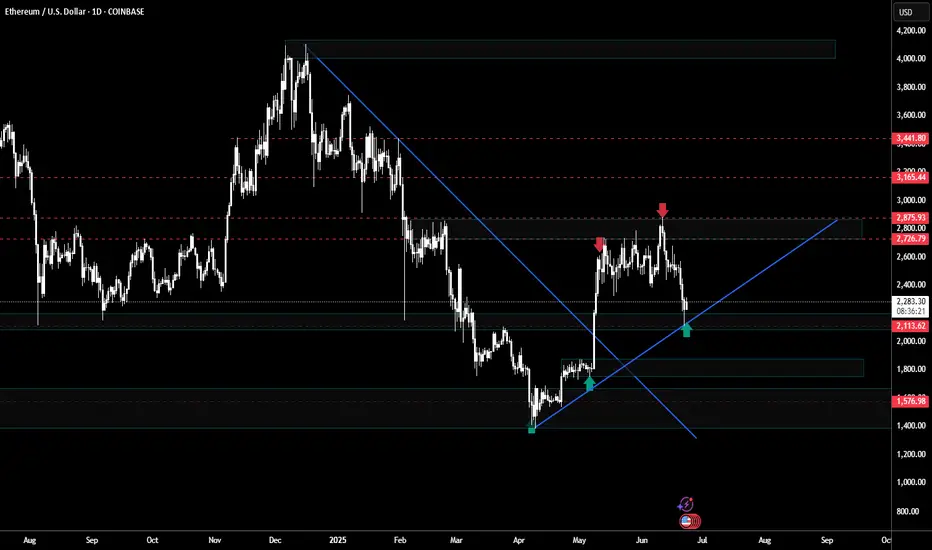
Bullish here on eth no valid breakoutEth has created a higher low, as long as we are above this price of 2100 it can still go up.
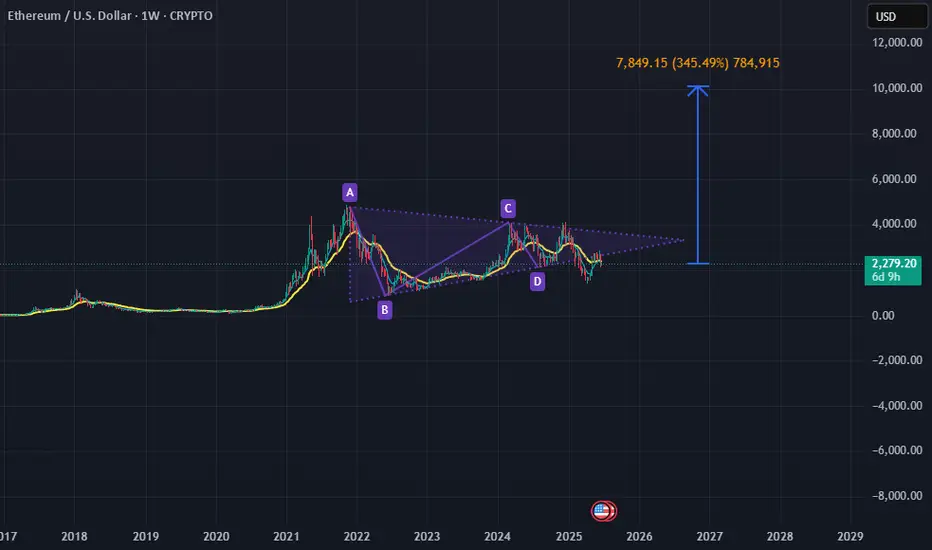
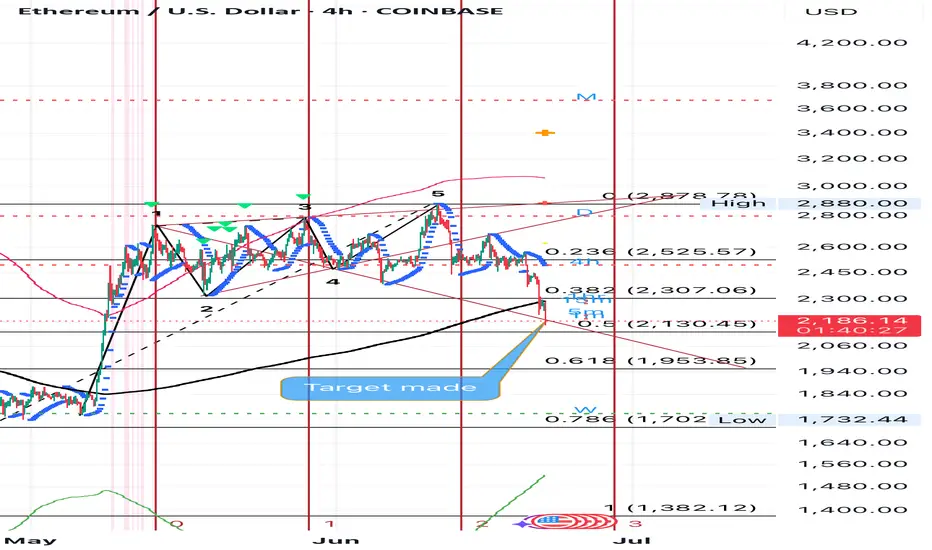
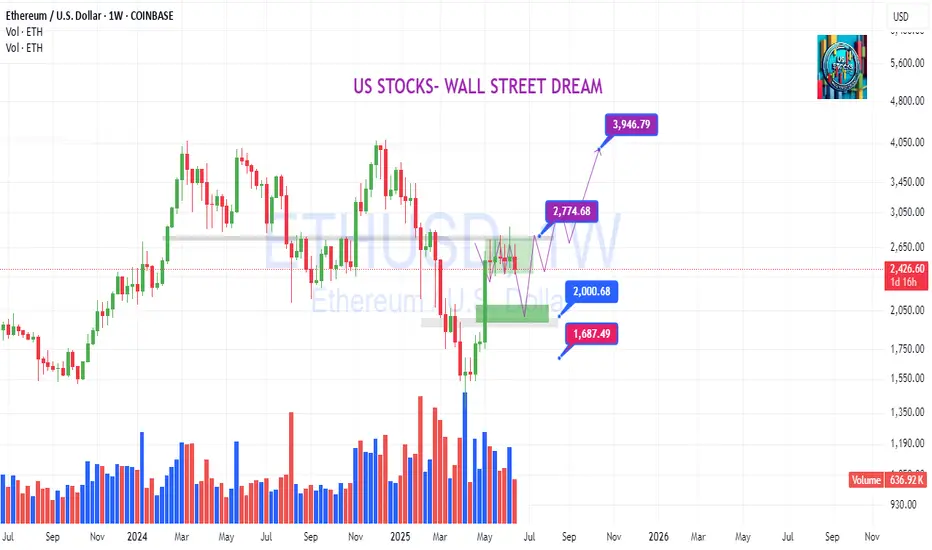
CRYPTO For Investment View 2025+Trying to forecast estimated target and target duration. Not for investment advice or anything tips like approach.
Just using basic tool we can forecast price and estimated time. Obviously different NEWS and geopolitical events may effect this.
So the point is, practice the basic.
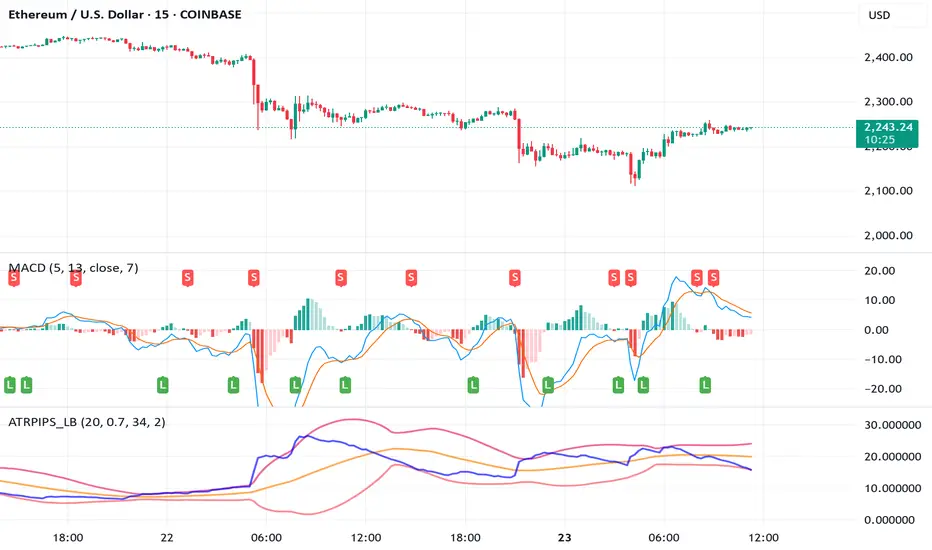
ETHUSD is moving within the 2110.00 - 2550.00 range 👀 Possible scenario:
Ethereum is trading near $2,250 after briefly dipping to $2,120. Price recovered slightly, climbing above the 23.6% Fib retracement from the $2,568 high. Whale activity signals confidence, with a $101M long opened at $2,247. Other ETPs saw $124M in weekly inflows, extending a 9-week streak to $2.2B.
Despite geopolitical tensions and cautious sentiment, ETH ETPs saw $124M in weekly inflows—marking nine straight weeks of gains. One whale opened a $101M leveraged long at $2,247, showing strong conviction. Still, 64% of top traders remain short, expecting more downside unless the Middle East crisis eases.
✅ Support and Resistance Levels
Support level is now located at 2,110.00.
Now, the resistance level is located at 2,550.00.
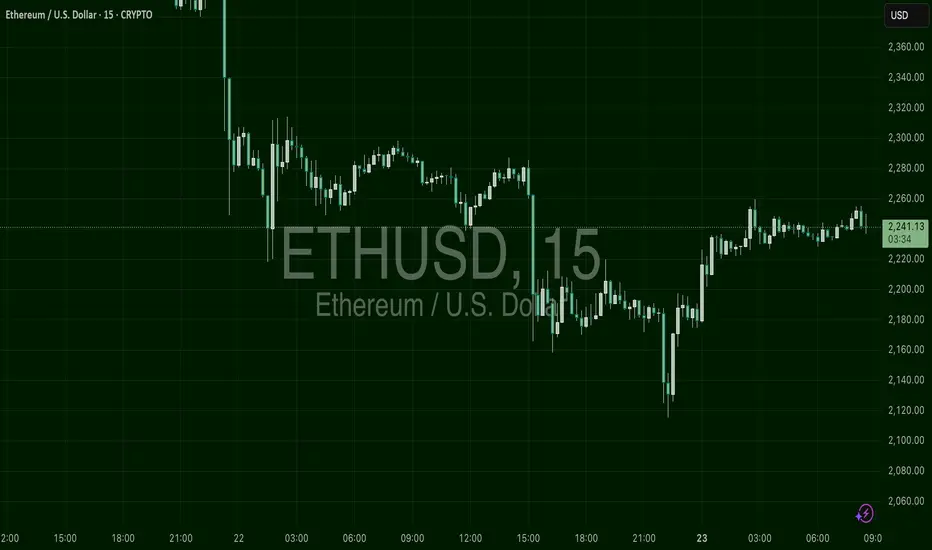
ETHUSD – Clean Climb Back from CollapseETH opened with a harsh dump from the $2,260 peak into the $2,130s before gradually recovering overnight. The bounce regained the mid-$2,230s, where price is consolidating just under minor resistance. With clean higher lows now forming, momentum could favor bulls if they break above $2,245 with volume. A pullback to $2,215 remains a possible retest entry zone.
$ETHAs uncertainty around war escalates, capital looks for liquid, borderless, and passive alternatives.
That’s where CRYPTOCAP:ETH steps in.
Liquidity pools offer passive yield, even when traditional markets are shaky.
In chaos, Ethereum becomes cashflow tech.
ETHUSD | Bullish DivergenceETHUSD is in bearish trend but and has printed bullish divergence which may start new bullish rally
ETH local bottom?ETH has formed a broadening channel pattern and may form a local bottom here, time will tell.
ETH / USDC Pool StakeSharp sell-off following the U.S. strike on Iran—ETH whale has entered. Set your liquidity pool range wide to capture a potential rebound. If the price continues to drop, no problem—full ETH position is anchored at the bottom of the range. Avoid swapping ETH to realize losses. Hold your original ETH and continue adjusting the range downward if needed. Your only real costs are minting and gas fees, so operate on a low-cost network like Arbitrum or Base to keep expenses minimal.
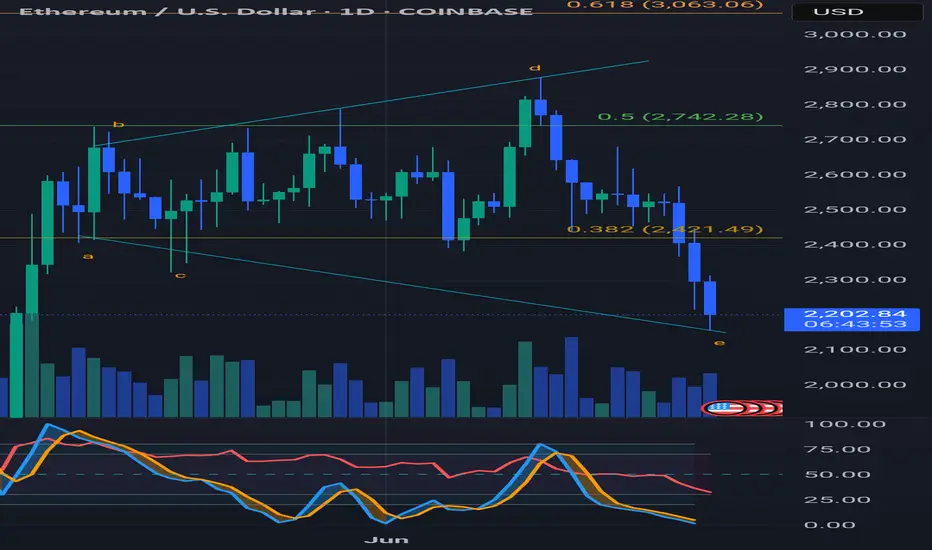
Bearish Wolfewave target madeThe more confluence - the better.
I combine this pattern with the SAR signal.
The odds also seem better when there’s an rsi divergence.
Typical entry is when price goes back down the 1-3 line.
Ideal target is the 1-4 line.
To spot a potential Wolfewave forming, I usually look for a wave 4 that enters wave 1.
Then, I watch if that wave 4 breaches wave 2.
If not, the next move should be a break above the 1-3 line.
Another thing to look at is if the 2-4 line forms a rising wedge with the 1-3 line ( for a bearish Wolfewave).
Earlier entry for a bearish Wolfewave could be when the SAR of the pattern moves above price.
Another earlier entry is looking for signals on a shorter timeframe.
Patterns can fail.
Do your own due diligence.
ETHUSD-SELL strategy 3D chart - GANN Etherium is under pressure, and the many stories predicting crypto becoming very high value, even more we already have observed, makes one wonder. From a technical perspective, it is on the way towards $ 1,750 and I feel we may see lower than that. we are negative medium-term and considering the LONG position and large unloading in BTC last few days, I feel this may be a valid expectation.
Strategy SELL $ 2,250-2,290 and take profit (at first) near $ 1,790.

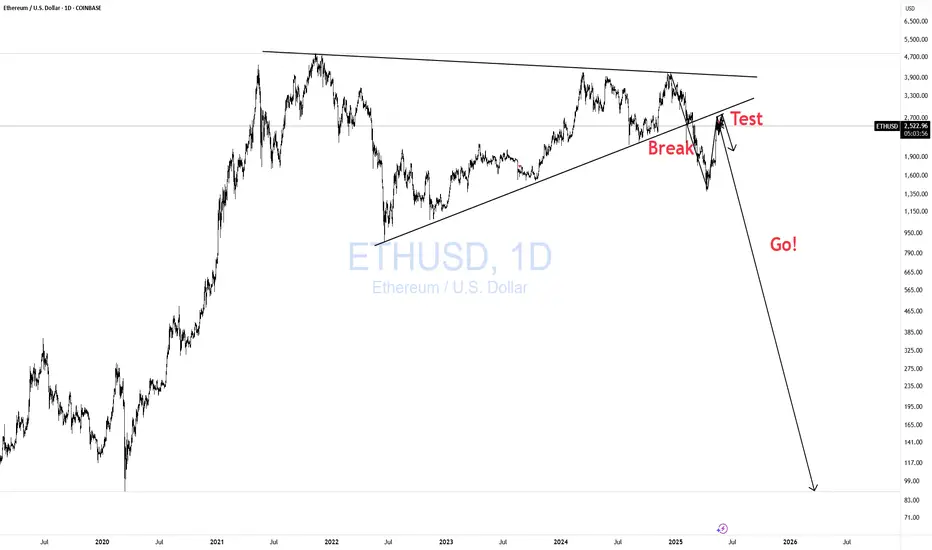
ETHUSD Break- Test- GO!!! Nothing Changed!I have to repost this bc TV only gives me limited updates before it forces "target reached." Here is my previous post.
Nothing has changed. Just as I expected. If anything, it looks even more bearish now. As always, wait for the hook!
Click Boost, and follow Let's get top 5,000!
You won't see ETHUSD cheaper than this, I'm buying at 3290Any price below 3300 is okay if the stop loss is still in place. The probability of this trade playing out is very high. Almost everybody is also bearish now. So I'm very comfortable in this trade
TP1 @ 2700
TP2 @ 3000
TP3 @ 5000

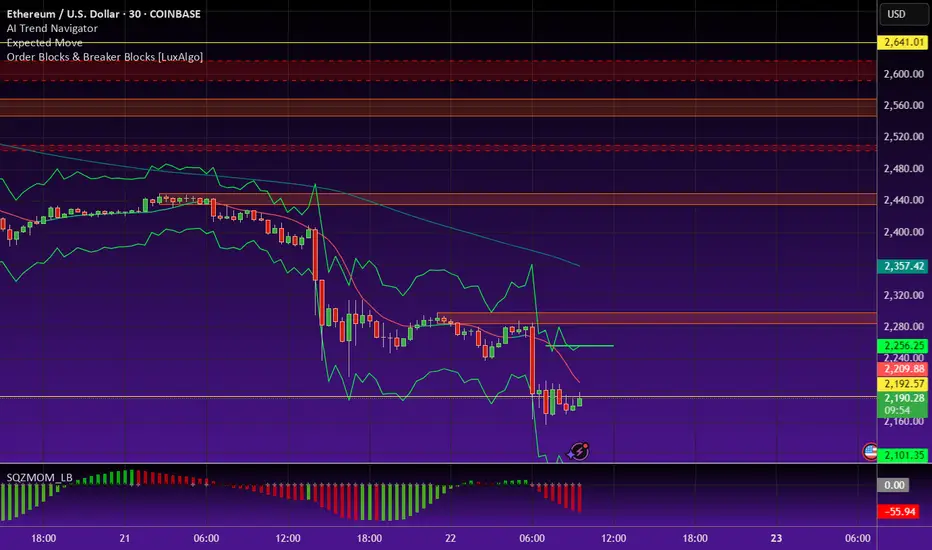
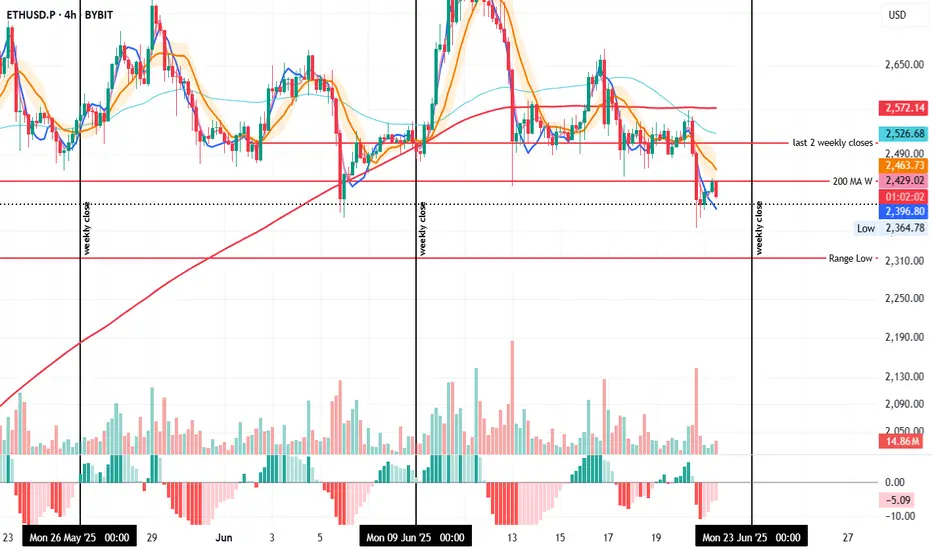
ETH 4H – Testing Support, Rejected by Weekly 200MAOn the 4H, ETH is closing below the weekly 200MA but is trying to hold the last daily close as support—similar to what it did on June 5 at 20:00.
The difference: back then, the 4H 200MA acted as support; now it’s been clearly rejected and price sits well below it.
With the weekly close approaching, if ETH stays under the weekly 200MA, there's a strong chance it revisits the range low support.
However, if it manages to reclaim the 200MA before the close, a move toward the last two weekly closes may still be on the table.
Always take profits and manage risk.
Interaction is welcome.
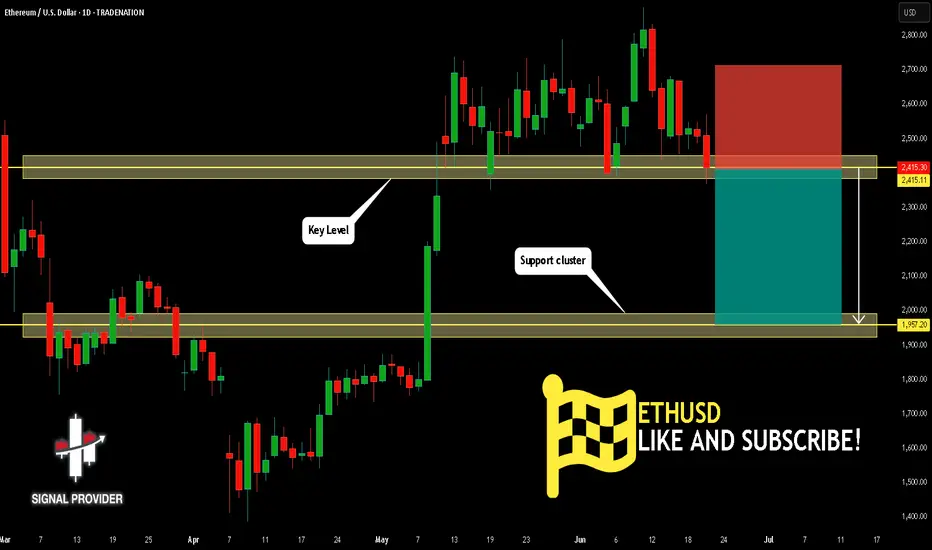
ETHUSD Will Go Down! Sell!
Take a look at our analysis for ETHUSD.
Time Frame: 1D
Current Trend: Bearish
Sentiment: Overbought (based on 7-period RSI)
Forecast: Bearish
The market is on a crucial zone of supply 2,415.11.
The above-mentioned technicals clearly indicate the dominance of sellers on the market. I recommend shorting the instrument, aiming at 1,957.20 level.
P.S
Please, note that an oversold/overbought condition can last for a long time, and therefore being oversold/overbought doesn't mean a price rally will come soon, or at all.
Disclosure: I am part of Trade Nation's Influencer program and receive a monthly fee for using their TradingView charts in my analysis.
Like and subscribe and comment my ideas if you enjoy them!
ETH: Nice setup patternETH:
Nice setup pattern.
Wait for a shakeout and jump on board.
.
US STOCKS- WALL STREET DREAM- LET'S THE MARKET SPEAK!
ETHUSD 4H Chart | ETH Bearish SetupThis chart highlights a possible bearish breakdown scenario for Ethereum (ETHUSD) on the 4H timeframe.
🔍 Key Levels:
Breakdown Confirmation Level: $2,362
Target 1: $2,151
Target 2: $1,954
(Optional Target 3: $1,750 if added)
📉 After multiple failed attempts to break above resistance, ETH price is now testing a critical support zone. A confirmed breakdown below this level could trigger further downside towards the mentioned targets.
Ichimoku Cloud shows weakening bullish momentum, supporting the potential for a bearish move.
Use Proper Money Management

ETHUSD Potential long ideaThe market made an all time high at 4095.4 following the November bull run. Street money flooded premium prices trying to buy above all time highs. Once price inevitably dropped from that premium level all of the bulls who bought above premium provided not only exit liquidity for longer term traders, but also "resistance" or "supply" levels that are easily recognizable for anyone who wants to double down on their position once the market forms what appears to be a short term low. Seeing this kind of trading occur in the way that it is occurring and at the prices that it is occurring at gives me insight that the market is now going to enter ranging conditions pairing liquidity from both sides of the range.
the market goes right to 01.23.24 low at 2165 and sweeps that level eventually making its way right back to 4097.4 only $2 higher than the all time high. These 3 levels being used in this way to send the market to both sides of a trapped range is done to allow for time to pass and orders to build up.
Since the overall trend of the crypto markets and ETH in general is upward, I am assigning this behavior to institutional accumulation of discount prices. Under this assumption I will look to see a new short term low set in the market. I will see that signature begin when a short term high leads to taking out a htf discount level with an aggressive displacement lower.
I can expect to see these sweeps just above or just below key lows
Key prices to watch
- Sunday 05.18.25 low; 2325
- Friday 05.09.25 H4 +ob; 2350.9
- Daily dealing range C.E; 2271.5
- Daily + Breaker open 2081.5
- M0A_. 1732.5

Ethereum’s Wild Ride: From Glory to Grit!🚨 Ethereum’s Wild Ride: From Glory to Grit! 🚨
📉 High: $4108 (Dec 16, 2024)
📉 Low: $1386 (Apr 9, 2025)
📈 Retracement: 50% from the fall
📍 Currently at key Oct ’24 support zone
🧠 Market teaches humility!
Ethereum touched euphoric highs in Dec ’24 at $4108, only to plunge a dramatic 66% to $1386 by April ’25. Since then, we saw a healthy 50% retracement — a classic technical response. Now, ETH has silently tiptoed back to its October 2024 support level. All eyes on whether this zone will hold… or fold. 👀
📊 Price is memory in motion — support tested, will it turn resistance or rally?
⏳ Stay patient. Stay technical.
#Ethereum #ETHUSD #CryptoAnalysis #SupportAndResistance #CryptoTrader #TechnicalAnalysis #MarketUpdate #PriceAction #ChartTalk #CryptoJourney #Blockchain #DigitalAssets #HODLOrFold #SaptharishiAlgo
Ethereum (ETH/USD) Weekly Chart Trend Analysis Ethereum (ETH/USD) Weekly Chart Trend Analysis Using Trendline, Fibonacci, and Technical Indicators
In this article, we analyze the overall trend of Ethereum (ETH) against the U.S. Dollar (USD) based on the weekly chart using essential technical tools such as trendlines, Fibonacci retracement/extension, moving averages, and key indicators. These tools help identify support and resistance levels, price momentum, and potential medium- to long-term scenarios.
1. Trendline Analysis
In the weekly chart, the trendline shown with a dashed gray line acts as a key resistance. This line is drawn from the early 2024 high around $4,127 to the late 2024 low near $1,376. This downtrend line reflects continued bearish pressure over several months.
Recently, ETH attempted to breach this trendline. Price has touched or hovered around the line a few times, but weekly candles have not decisively closed above it. A confirmed breakout with multiple weekly closes above this trendline would signal a potential shift from a downtrend to an uptrend.
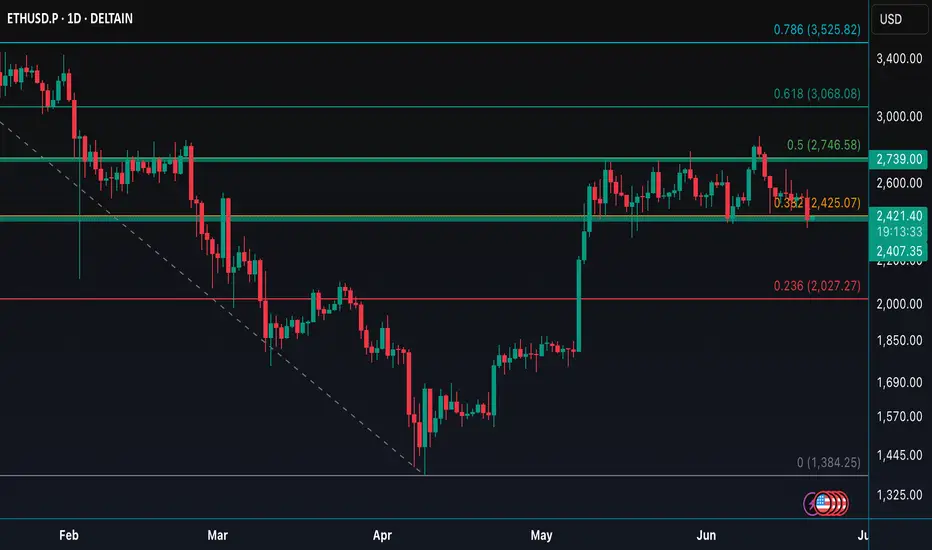
2. Fibonacci Retracement and Extension Analysis
The Fibonacci retracement tool was applied from the low of $1,376 to the high of $4,127. Key levels are:
0.236 (~$2,026): First major support level after a significant pullback. ETH bounced strongly from here.
0.382 (~$2,428): Current key resistance where price is consolidating. A close above this level would open the path to higher targets.
0.618 (~$3,077): A popular target level in bullish retracements.
1.0 (~$4,127): The previous cycle high. A breakout here would establish a Higher High pattern.
Extension levels (1.272, 1.618, 2.0): Used to project long-term bullish targets beyond the previous high. These lie at $4,875 / $5,828 / $6,878 respectively.
3. Moving Averages (EMA) Analysis
The chart features Exponential Moving Averages:
EMA 10-week (yellow): Tracks short-term trends. Currently flattening.
EMA 50-week (purple): Serves as a medium-term resistance. Price is hovering near this level.
EMA 200-week (white): A long-term structural support. ETH remains above this, indicating it has not yet entered a full bearish market phase.
Holding above the EMA 200 is a positive structural sign, while the flattening of EMA 10 may hint at short-term buying exhaustion.
4. Indicator Analysis
Stochastic RSI: Currently in the Overbought zone with a bearish crossover, indicating a possible short-term pullback.
RSI (Relative Strength Index): Formed a bullish divergence from the recent lows and is slowly climbing. However, it is still below the 55 level, suggesting the uptrend momentum is not yet fully confirmed.
5. Trend Scenarios and Strategic Outlook
Scenario 1: Bullish Continuation
Condition: Price closes above $2,428 and EMA 50.
Next Targets: $3,077 / $3,539 / $4,127
Strategy: Consider long positions on pullbacks above $2,428.
Scenario 2: Sideways Consolidation
Condition: Price remains between $2,026 and $2,850.
Strategy: Range trading — buy near $2,050 and sell near $2,800-$2,850.
Scenario 3: Bearish Breakdown
Condition: Price breaks below $2,026 and EMA 200 decisively.
Downside Targets: $1,650 / $1,500 / $1,376
Strategy: Stay in cash or open short positions with proper risk management.

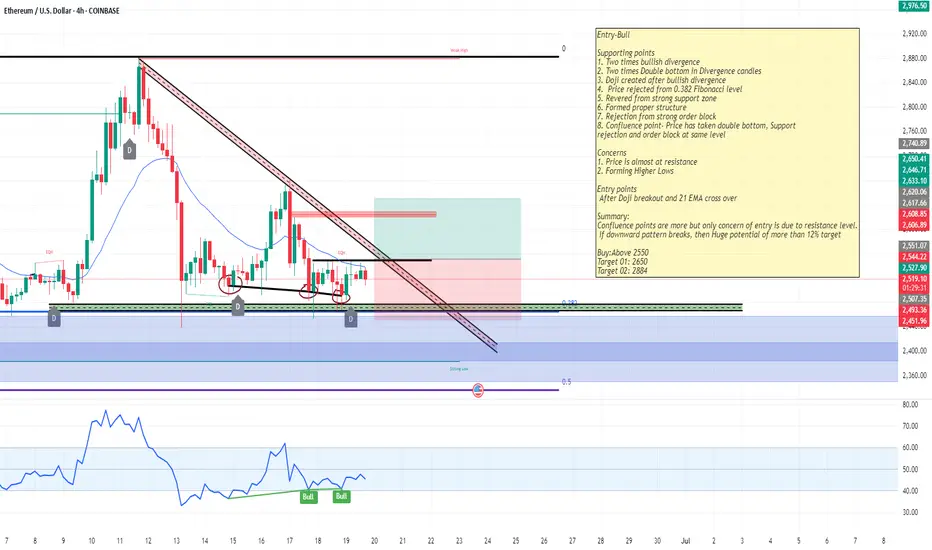
ETHUSD-Swing Trade Bull
Entry-Bull
Supporting points
1. Two times bullish divergence
2. Two times Double bottom in Divergence candles
3. Doji created after bullish divergence
4. Price rejected from 0.382 Fibonacci level
5. Revered from strong support zone
6. Formed proper structure
7. Rejection from strong order block
8. Confluence point- Price has taken double bottom, Support
rejection and order block at same level
Concerns
1. Price is almost at resistance
2. Forming Higher Lows
Entry points
After Doji breakout and 21 EMA cross over
Summary:
Confluence points are more but only concern of entry is due to resistance level.
If downward pattern breaks, then Huge potential of more than 12% target
Buy:Above 2550
Target 01: 2650
Target 02: 2884
ETHUSD - Bearish Breakout from Ascending Channel
On the 4H chart, ETH/USD has broken decisively below a long-standing ascending channel as well as the critical support zone at $2447.81. This breakdown indicates increased bearish pressure after a prolonged sideways movement between dynamic resistance and support.
The price is currently trading below both the trendline and previous horizontal support, confirming a bearish shift in market structure.
Key Levels:
Resistance 1: $2447.81
Resistance 2: $2554.91
Support 1: $2310.72
Support 2: $2180.05
Scenario:
If this bearish momentum persists, I expect the price to continue toward Target 1: $2310.72 and potentially extend to Target 2: $2180.05.
However, if price reclaims $2554.91, this bearish view would be invalidated, and we may see a shift back toward the upper range.
This setup offers a clean risk-to-reward profile with clearly defined invalidation and targets. Always manage your position size and risk accordingly.
