Market next move 🔄 Disrupted Analysis: Bullish Counter-Scenario
🧠 Original Bias:
The chart predicts a strong bearish move, with a target around 88,000 USD.
The label "Bullish" seems misleading as it’s placed in a steep downward move.
---
📉 Issues With the Original Analysis:
1. Volume Misinterpretation:
Increasing red volume could indicate capitulation or a temporary panic sell-off, not necessarily the start of a new trend.
A bounce could follow if buyers step in.
2. Support Zone Ignored:
The analysis overlooks any previous support levels in the 100k–98k range, where buyers may be waiting.
3. No Confirmation for Breakdown:
The chart does not show a completed breakdown of a key structure or trendline.
The blue squiggle assumes a breakdown will happen, but no technical confirmation is visible.
---
📈 Disruption Scenario: Bullish Reversal Possible
Rejection from 102k zone could be a liquidity grab, not the start of a downtrend.
Hidden bullish divergence on RSI or MACD (not shown here) could support a bounce.
ETHEREUM trade ideas
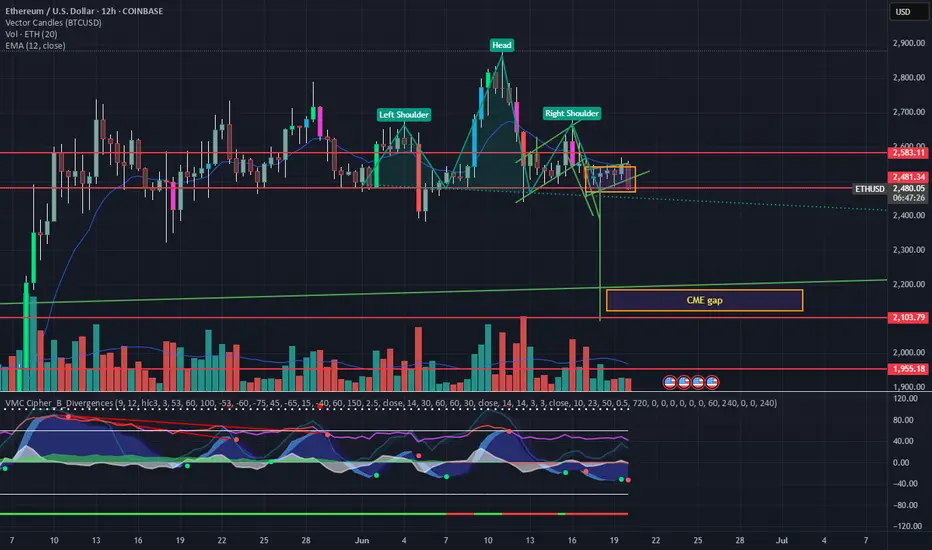
ETH Head and shoulders playing out for drop to 2093 and fill CMEEthereum has rejected from the upper resistance around 2813 and has formed a head and shoulders patter with a projected drop to 2093 which would also coincidentally fill the CME futures gap between 2183-2125. I expect this to be the final drop before we advance upward but may not get super bullish until around August which is typically when the major moves of the bull cycle year happen for Eth.
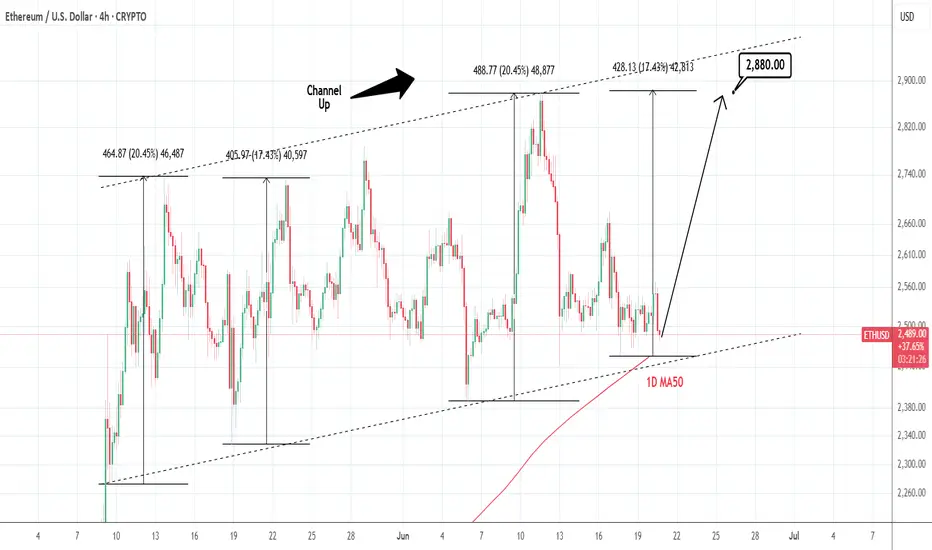
ETHUSD: Channel Up testing 1D MA50. Optimal buy.Ethereum is neutral on its 1D technical outlook (RSI = 47.020, MACD = 17.220, ADX = 20.205), consolidating for the past 3 days. This time it is about to test the 1D MA50, which is technically the long term Support. Since it is also almost at the bottom of the Channel Up, we see this as the most optimal level to buy and aim for the same +17.43% rise (TP = 2,880) it did in May.
## If you like our free content follow our profile to get more daily ideas. ##
## Comments and likes are greatly appreciated. ##
ETH shortTrading involves substantial risk and is not suitable for all investors. Past performance is not indicative of future results. Always conduct your own analysis and consider your risk tolerance before entering any trade.😉😉
ETH: Hardly Any Volatility Not much has happened for Ethereum since yesterday. According to our primary scenario, wave B in turquoise should imminently push higher, theoretically up to resistance at $4,107. Once these corrective rises conclude, wave C should take over, driving ETH down to complete the large green wave in the Target Zone below ($935.82 – $494.15). The low of this multi-year correction should lay the foundation for subsequent wave increases, likely causing new record highs above the $10,000 mark, as the weekly chart suggests. In our alternative scenario, ETH would embark on this bullish journey earlier. Currently at 27% probability, this alternative assumes the corrective low was already established at $1,385, which would imply a direct breakout above $4,107.
📈 Over 190 precise analyses, clear entry points, and defined Target Zones - that's what we do.

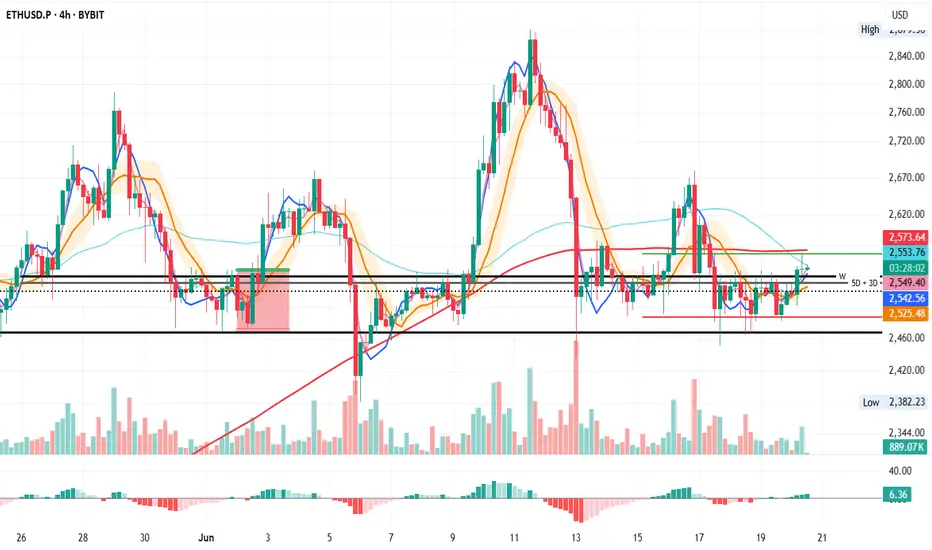
ETH/USDT Key Levels Reclaimed on 4HOn the 4H, price has closed above the 5D + 3D, and W resistance levels.
Will these levels hold and become a launchpad for new higher highs—and possibly counter the 200MA?
We can’t know for sure, but we can make educated guesses.
Always take profits and manage risk.
Interaction is welcome.
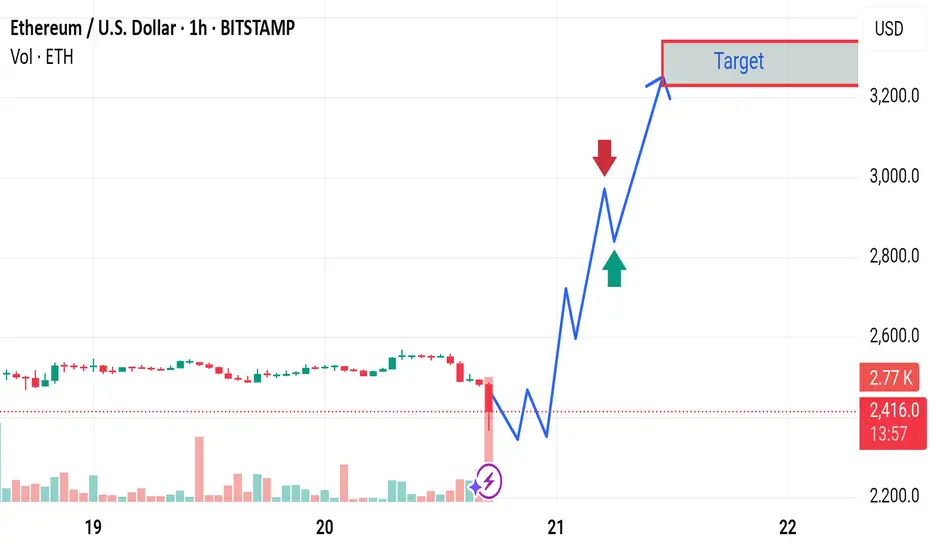
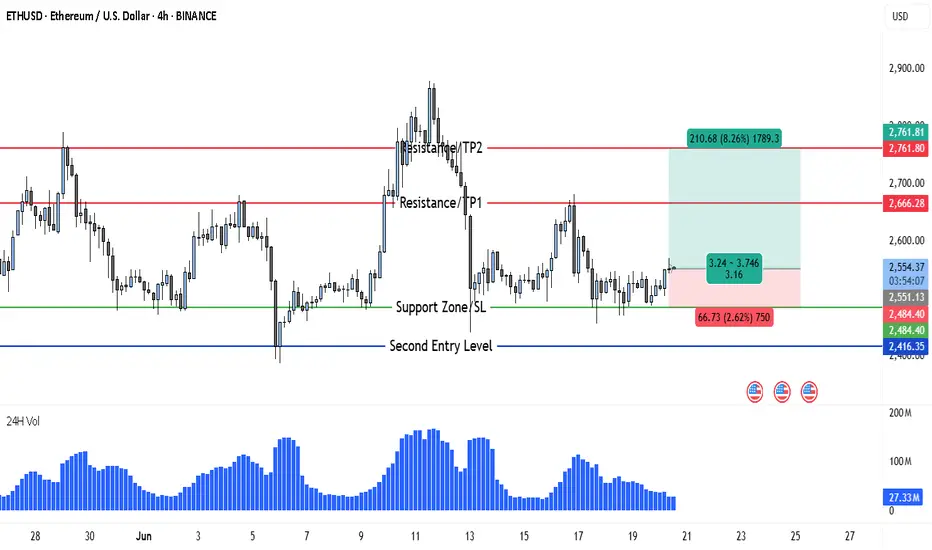
ETH Gears Up for 8% Rally After Holding Key Support at $2,484Ethereum (ETH) is currently positioning itself for a potential bullish breakout on the 4-hour chart. After facing a period of mid-June consolidation and volatility, ETH has stabilized above the key support zone at $2,484–$2,551, which previously served as a strong reaction level. This range has now been retested successfully, and price action suggests growing bullish pressure.
At present, ETH is trading around $2,552, holding just above the defined support, which has acted as both a psychological and technical base. The past few candles show reduced selling momentum and a pattern of accumulation that often precedes a breakout. Buyers are stepping in at higher lows, and this shift in structure could signal the beginning of a new leg upward.
The overall setup suggests that Ethereum is now in a classic breakout-retest formation. Volume, while still moderate, has started to pick up slightly, which strengthens the case for a continuation toward the upper resistance zones. The resistance lines at $2,666 and $2,761 represent short- and mid-term upside targets, both previously tested levels where price struggled to close above. If ETH manages to break past $2,666 cleanly, a move to $2,761 becomes increasingly likely.
🔹 Trade Idea (Buy Setup)
• Entry Point: Around $2,552
• Stop Loss: $2,484 (placed just below the major support zone and recent reaction low)
• Target 1 (TP1): $2,666
• Target 2 (TP2): $2,761
• Risk-to-Reward Ratio: ~1:3.16
• Upside Potential: 8.26%
• Downside Risk: 2.62%
This trade setup provides a high-probability long opportunity, with a clearly defined support zone backing the entry. The stop loss at $2,484 gives the trade sufficient breathing room while minimizing downside risk in case of short-term volatility.
There is also a second entry opportunity defined at $2,416, should the market dip unexpectedly before continuing upward. However, this entry is more aggressive and should be approached with flexible risk management — the stop loss for this reentry point is not fixed and should be adjusted as per the trader’s individual risk appetite.
What further strengthens the bullish case is that this reentry zone aligns closely with a historical swing low that previously triggered a strong bullish reversal. If price tests this level again, it may offer a last-chance opportunity for buyers before a larger move unfolds.
The double target strategy — TP1 at $2,666 and TP2 at $2,761 — reflects realistic profit zones based on past price structure and market behavior. Both targets lie within resistance levels that saw significant reaction in recent trading sessions, making them ideal zones for partial or full profit-taking depending on price momentum.
In the broader context, despite ETH’s recent 10% drop, the asset’s ability to hold above the $2,480–$2,500 region demonstrates resilience. This range now acts as a solid foundation from which bulls could initiate a breakout, especially if macro conditions (like BTC strength or positive ETH-related news) align in coming days.
In summary, Ethereum presents a clean long setup from $2,552 with targets up to $2,761, backed by technical support, improving volume, and a bullish price structure. A secondary entry is available at $2,416 for those with higher risk tolerance. If momentum builds above $2,600, ETH could rapidly revisit prior swing highs — and this chart structure makes a compelling case for being prepared ahead of that move.
ETH/USD Technical Analysis📉 ETH/USD Technical Analysis
📅 Published: June 19, 2025
🔍 Platform: TradingView | Analyst: MQL_CodedPips
🔹 Market Context:
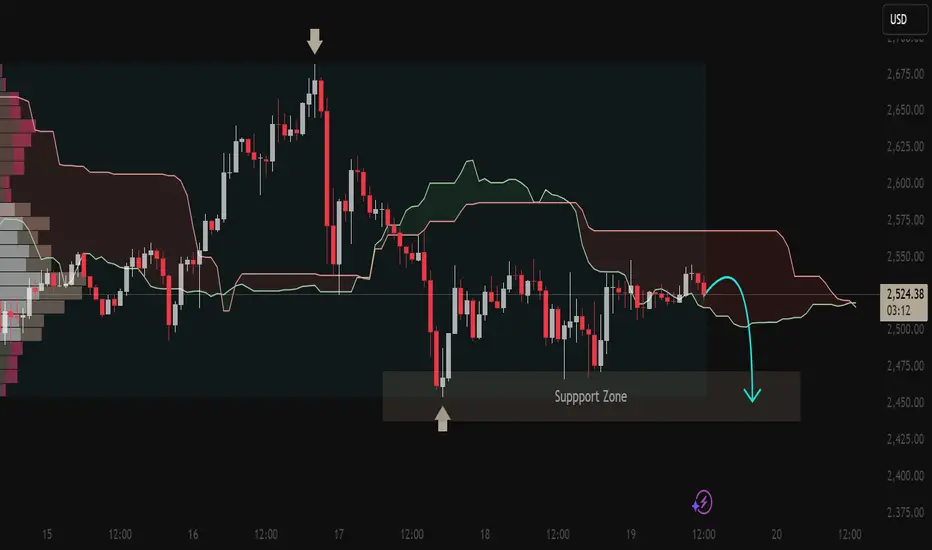
The market structure shows a clear shift from bullish to bearish momentum after rejecting a key resistance area. The price action is now consolidating below the Ichimoku Cloud — a signal of weakness and potential continuation to the downside.
🔸 Key Technical Highlights:
Rejection from Resistance:
Price formed a clear top with a long upper wick, confirming seller dominance.
Marked rejection aligns with a previous high and overbought condition.
Bearish Ichimoku Setup:
Price is trading below the Kumo Cloud, indicating bearish sentiment.
Bearish Tenkan-Kijun crossover occurred earlier, reinforcing downside pressure.
Support Zone Reaction:
A strong bounce was seen from the marked support zone, showing short-term buyer interest.
However, price has failed to reclaim above the cloud, suggesting limited bullish strength.
Volume Profile Indication:
High volume node on the left suggests strong historical activity in that zone, but failure to hold could result in a sharp move down.
Forecast Path (Illustrated):
The chart projects a potential bearish move, targeting a retest of the support zone.
If that zone fails, a breakdown toward the $2,450–$2,425 area becomes likely.
🧭 Conclusion:
ETH/USD is showing signs of distribution after a failed breakout, now leaning bearish under key technical indicators. A confirmed breakdown below the support zone would validate the short-term bearish scenario.
Outlook:
🔻 Bearish bias while price remains below the Kumo Cloud.
📌 Watch for price action at support zone for either a bounce or breakdown.
The Crypto PlayHello traders,
Beautiful PA shaping up on BTC, ETH and XRP.
Looking for short term sells into the buys.
Explained my thesis in the video.
Stay sharp chads and stay safe!
Onwards
CRYPTO:ETHUSD
CRYPTO:BTCUSD
CRYPTO:XRPUSD

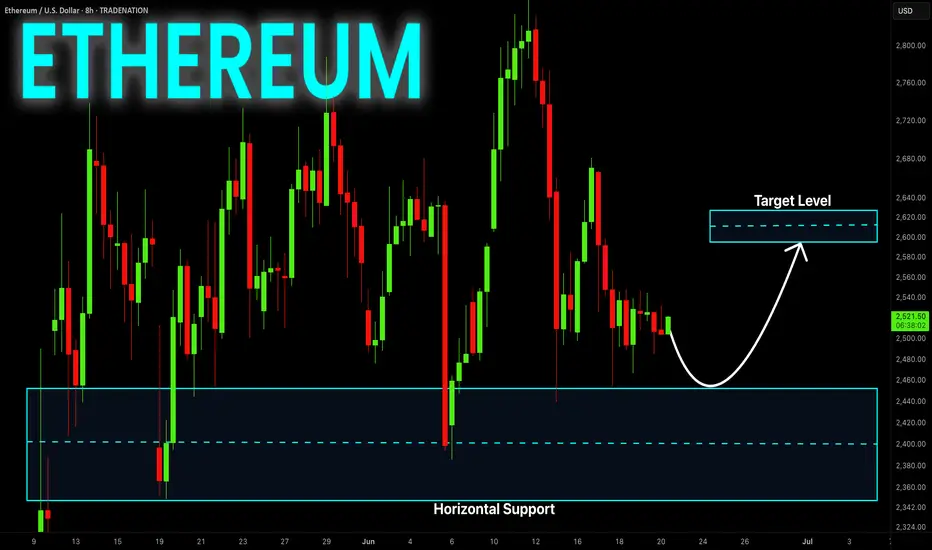
ETHEREUM Risky Long! Buy!
Hello,Traders!
ETHEREUM is consolidating
Above the horizontal support
Area around 2360$ and we
Are already seeing a local
Rebound from the level
So as we are bullish biased
A further price growth
Is to be expected
Buy!
Comment and subscribe to help us grow!
Check out other forecasts below too!
Disclosure: I am part of Trade Nation's Influencer program and receive a monthly fee for using their TradingView charts in my analysis.
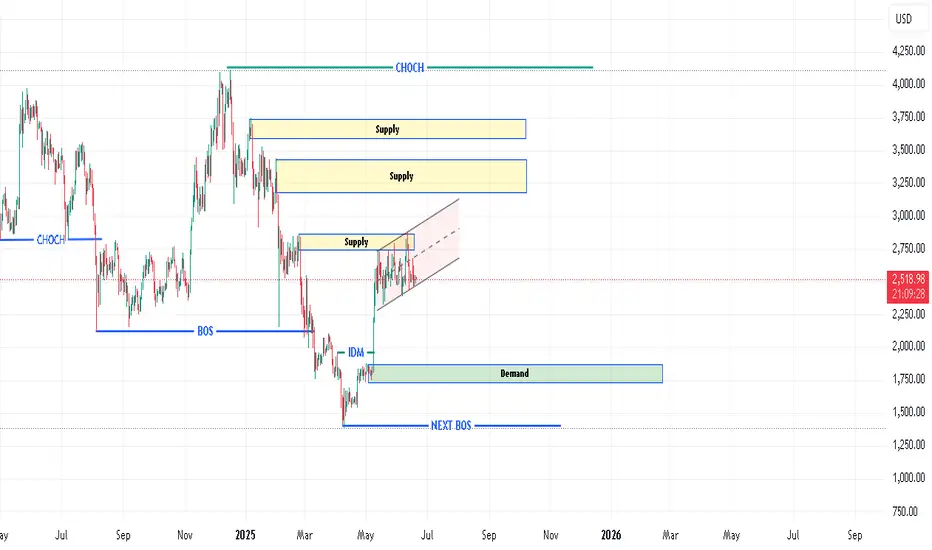
ETH SMC perspectiveDaily SMC is Sell (IDM Taken) , but there is fresh supply above( You are a buyer or seller ? ) hehe
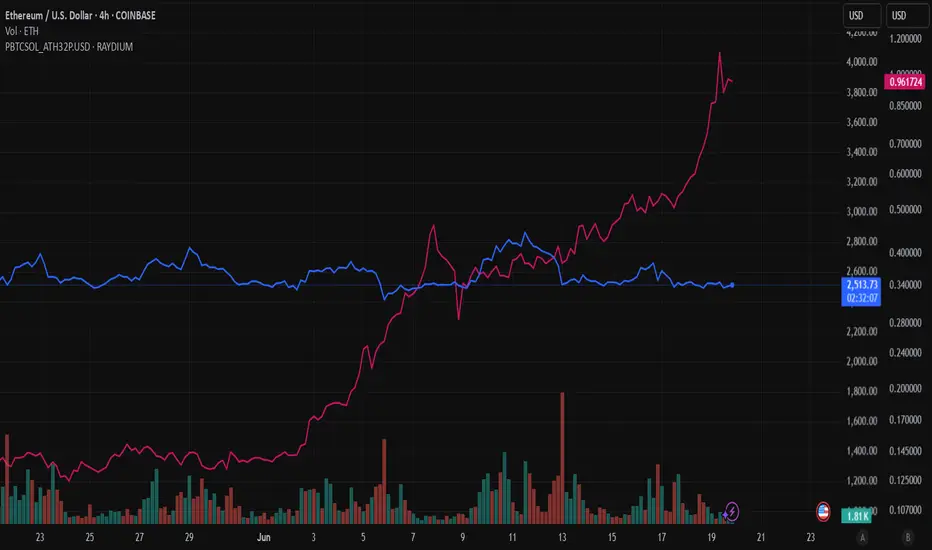
PBTC vs ETHA visual comparison of Purple Bitcoin (PBTC) and Ethereum (ETH) trends, powered by the Purple Bitcoin Compare Bot.
Detailed technical analysis of the ETH/USD chart🧭 General Context (1D, Long-Term):
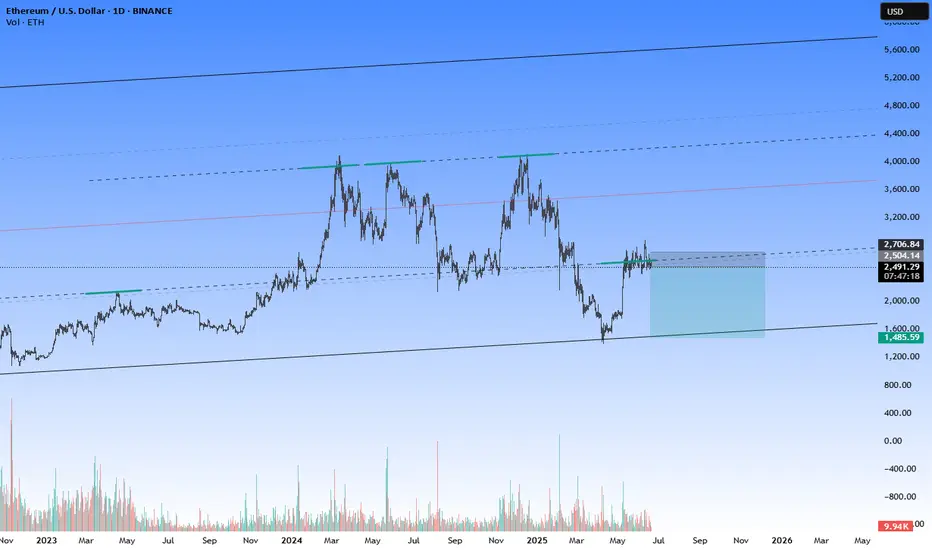
The chart covers the period from approximately September 2023 to June 2025.
ETH/USD has gone through a complete cycle: growth → decline → correction → potential consolidation/accumulation.
🔹 Market Structure (Price Action)
🔸 Trends:
November 2023 – March 2024: strong uptrend, ETH reaches highs around $4,000+
March 2024 – February 2025: clear downtrend ending with a local low around $1,600
February 2025 – May 2025: dynamic rebound – probable trend change (new higher low + higher high)
May – June 2025: currently consolidating between ~$2,400–2,800
📉 Key Support and Resistance Levels
Type Level Notes
🔴 Resistance ~2,800 – 2,900 Local high, many candles with shadows rejected from above
🟡 Resistance ~3,200 – 3,400 Beginning of strong declines from 2024
🟢 Support ~2,300 – 2,400 Local lows in June 2025
🟢 Strong support ~1,600 – 1,800 Final market low of March 2025 (possible accumulation phase)
📊 Technical indicators
✅ Stochastic RSI (at the bottom of the chart):
Currently in the oversold zone (~0–20) → may signal a potential bottom / buying opportunity
Red-blue lines are starting to wrap upwards → possible rebound
Recent crossovers of the indicator corresponded to local price movements
🔍 Technical formations
⚠️ Possible formations:
Double Bottom: February–March 2025 → classic trend reversal formation
Rising Channel: from March 2025 to present – prices are moving in a slightly rising channel
Current consolidation may be a bull flag (continuation after the increase)
📌 Summary – scenarios
🟢 Bullish scenario:
Breakout of resistance ~2,800 → possible test of levels 3,200 – 3,400 USD
Confirmation of a higher low → continuation of the uptrend
Stochastic RSI in the oversold zone → potential for an uptrend
🔴 Bearish scenario:
Drop below 2,300 USD → possible return to the area of 1,800–1,600 USD
Breakout of the structure of higher lows
Confirmation that the increase was only a correction
🧠 Final conclusions
Currently, ETH/USD is in a key decision zone: after a strong rebound, the market is resting.
Stochastic RSI suggests a potential upside impulse, but requires confirmation by a breakout of resistance.
For traders: 2,800 (resistance) and 2,300 (support) are worth watching.
For investors: 1,600–1,800 could be considered a long-term accumulation zone.

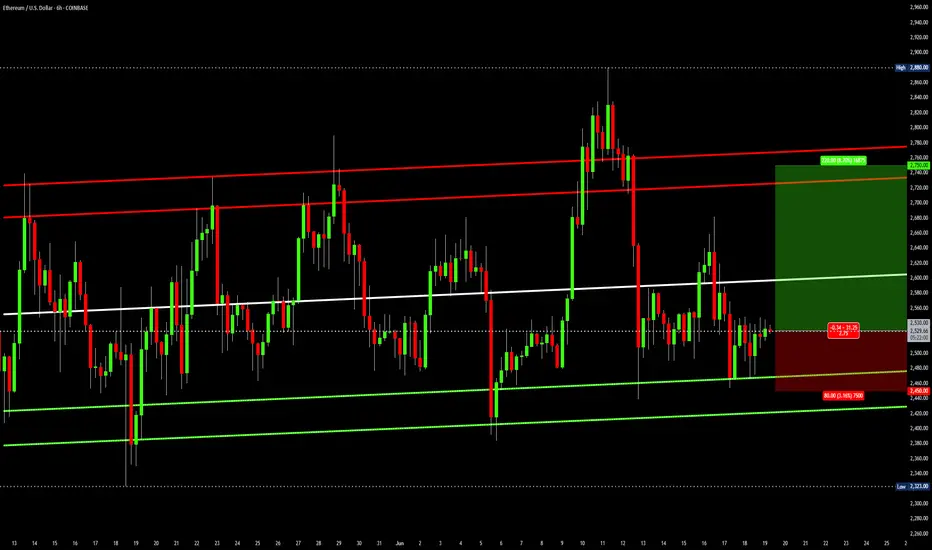
Ethereum channelThis is a straightforward analysis. Ethereum has been trading in an ascending parallel channel for 6 weeks now. As long as this pattern stays valid, ETH is a long at the bottom and short at the top of the channel, repeat. Round numbers support is 2450 and resistance is 2750.
Trade idea:
Long: 2530
Profit: 2750
Stop: 2450
ETHUSD is moving within the 2390.00 - 2880.00 range 👀 Possible scenario:
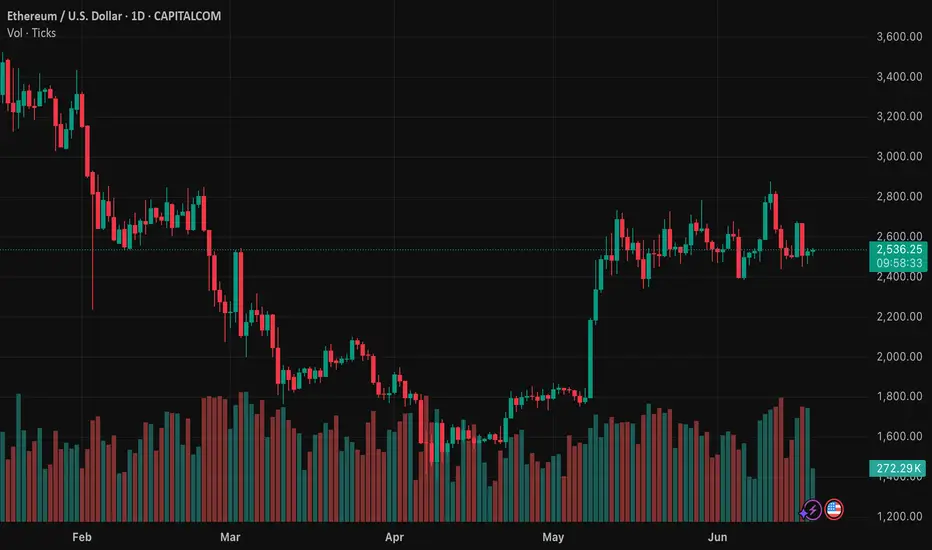
Ethereum dropped to $2,530, down 9.4% on the week, as market uncertainty weighs on momentum. Despite the pullback, over 35 million ETH (worth $89B) is now staked—an all-time high. While accumulation is surging too, with large wallets scooping up 800K+ ETH daily. On June 12 alone, whales bought 871K ETH—the biggest single-day haul this year. Ethereum’s liquid supply is shrinking as staking grows, aided by SEC guidance easing regulatory concerns. Lido, Coinbase, and Binance remain top staking providers.
The Pectra upgrade and Arbitrum’s ArbOS 40 rollout bring key enhancements like account abstraction and better L2 scaling. A golden cross is forming on ETH’s chart, but price remains under pressure amid geopolitical tensions.
✅Support and Resistance Levels
Support level is now located at 2,390.00.
Now, the resistance level is located at 2880.00.
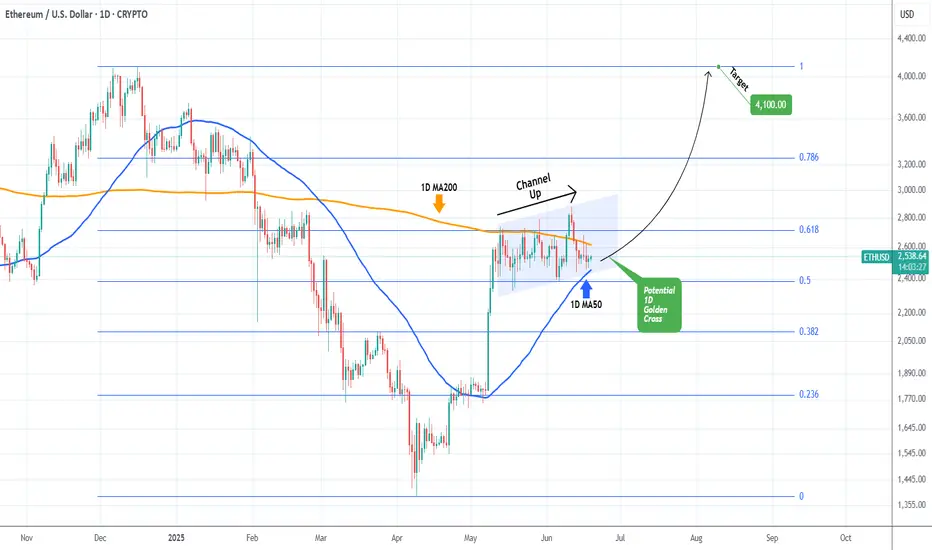
ETHEREUM Battling to hold its 1D MA50.Ethereum (ETHUSD) has been trading within a 5-week Channel Up pattern and in the past 2 days almost tested its 1D MA50 (blue trend-line). So far this is holding, showcasing the strong presence of buyers in that price region, which also happens to be the bottom of that Channel Up.
Ahead of a 1D Golden Cross that may potentially be formed in a week or so, this is the strongest buy signal we get since the April 09 bottom. Given also that the price is trading close to the 0.5 Fibonacci retracement level from the December 16 2024 High, the upside potential is significant. The obvious medium-term Target is that High at 4100.
-------------------------------------------------------------------------------
** Please LIKE 👍, FOLLOW ✅, SHARE 🙌 and COMMENT ✍ if you enjoy this idea! Also share your ideas and charts in the comments section below! This is best way to keep it relevant, support us, keep the content here free and allow the idea to reach as many people as possible. **
-------------------------------------------------------------------------------
💸💸💸💸💸💸
👇 👇 👇 👇 👇 👇
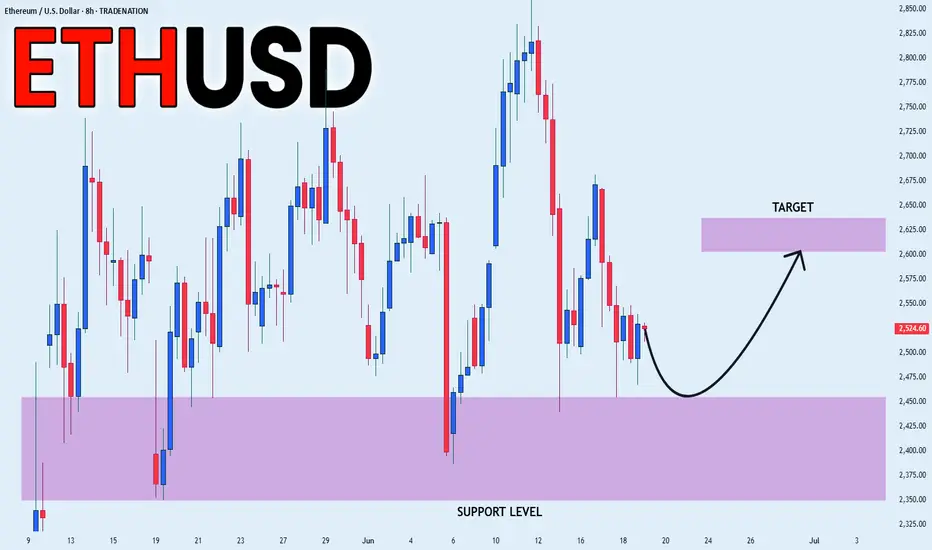
ETHEREUM LOCAL LONG|
✅ETHEREUM is going down now
But a strong support level is ahead at 2,375$
Thus I am expecting a rebound
And a move up towards the target of 2,600$
LONG🚀
✅Like and subscribe to never miss a new idea!✅
Disclosure: I am part of Trade Nation's Influencer program and receive a monthly fee for using their TradingView charts in my analysis.
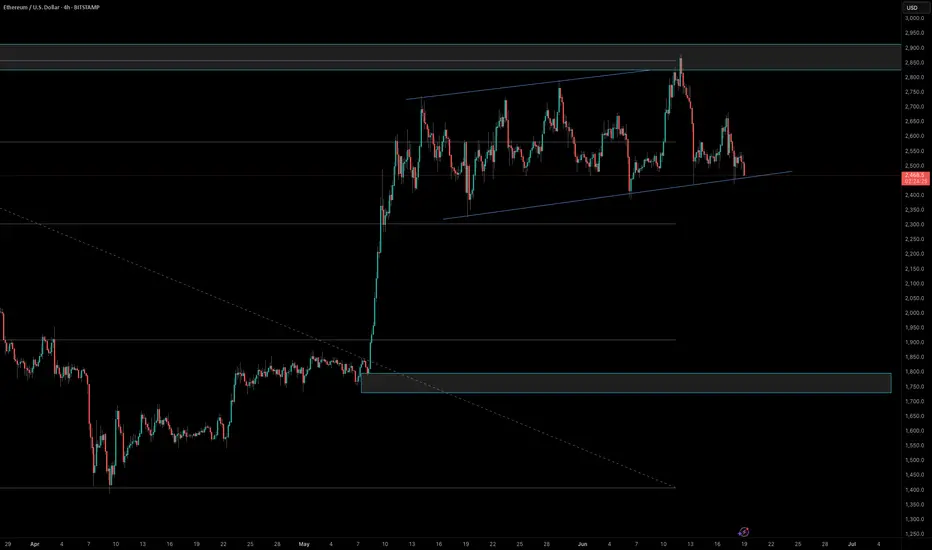
ETH is standing at the edge of the cliffCOINBASE:ETHUSD seems to have stalled between $2,400 and $2,800 without any clear fundamental reason, but from a technical perspective , the explanation is quite straightforward. After breaking down from a massive triangle pattern, ETH bounced back as if nothing had happened. However, the rally has hit a wall right at the former trendline, what used to be solid support is now acting as resistance.
This could be a sign that ETH’s upside momentum is running out. If the price breaks below $2,300 , it would likely confirm that the downtrend is just getting started and could leave ETH in a much weaker position.
Although the double top already played out and hit the 61.8% target (which might have led some to think the worst was over) there’s still a possible move toward the full 100% target, which sits just above $1,000, near the bottom edge of the triangle.
Putting fundamentals aside, this setup makes me lean heavily bearish on ETH if it drops below $2,300 . We are in front of a potential 50% decline in ETH, which is amazing specially if the risk that you are assuming is less than 5%.
On the other hand, if the price breaks above the previous trendline, it would open the door to a new, more bullish scenario with the price heading to 3.500$. Another way to play this, is by buying at 2.400$ area, and setting up a stop loss under 2.150$, the risk benefit is amazing again, so don't worry about the direction of ETH, be aware of the trading opportunities that is giving us in any direction!

ETHUSD Sell off is possible.Price tested valid resistance multiple times and formed an ascending channel.
Daily brake and close below this channel, consider its still under construction. Buy the dip!
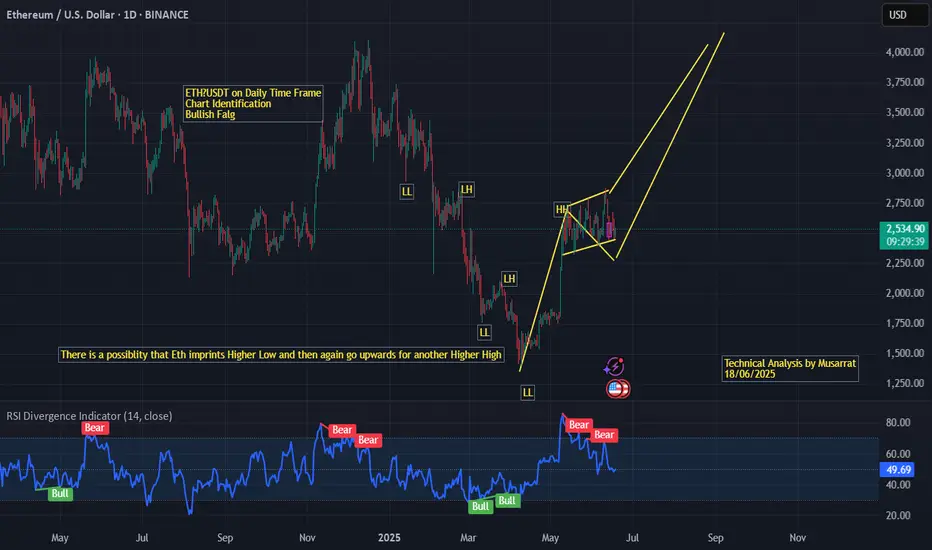
ETH/USDT Daily Timeframe – Bullish Flag Pattern IdentifiedThe chart shows Ethereum forming a bullish flag pattern after a strong upward rally, indicating potential continuation of the bullish trend. The recent price structure reflects a consolidation phase in a downward-sloping flag, following a significant impulsive move.
Key highlights:
The sequence of Higher Highs (HH) and Higher Lows (HL) suggests a shift in trend structure.
The current flag pattern aligns with the textbook characteristics of a bullish continuation setup.
RSI shows previous bullish divergence, supporting the case for upward momentum resumption.
🔸 Outlook: If ETH prints another higher low and breaks above the flag resistance, it may surge toward a new higher high in the $3,000–$3,500 zone.
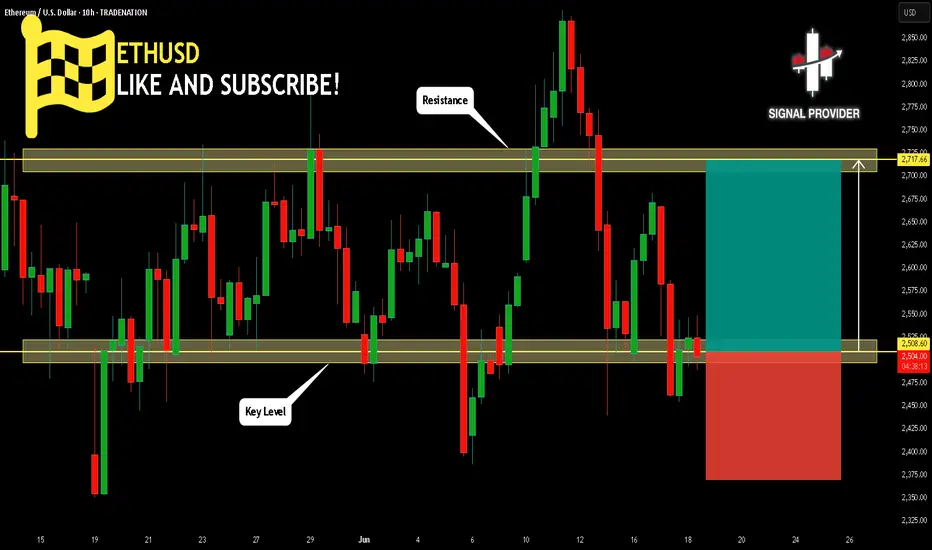
ETHUSD Is Very Bullish! Buy!
Take a look at our analysis for ETHUSD.
Time Frame: 10h
Current Trend: Bullish
Sentiment: Oversold (based on 7-period RSI)
Forecast: Bullish
The market is on a crucial zone of demand 2,508.60.
The oversold market condition in a combination with key structure gives us a relatively strong bullish signal with goal 2,717.66 level.
P.S
Please, note that an oversold/overbought condition can last for a long time, and therefore being oversold/overbought doesn't mean a price rally will come soon, or at all.
Disclosure: I am part of Trade Nation's Influencer program and receive a monthly fee for using their TradingView charts in my analysis.
Like and subscribe and comment my ideas if you enjoy them!
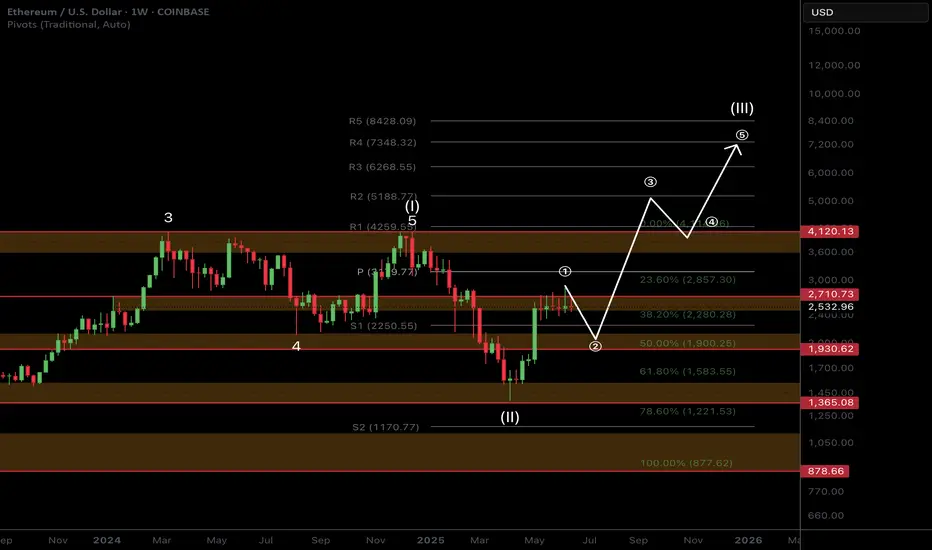
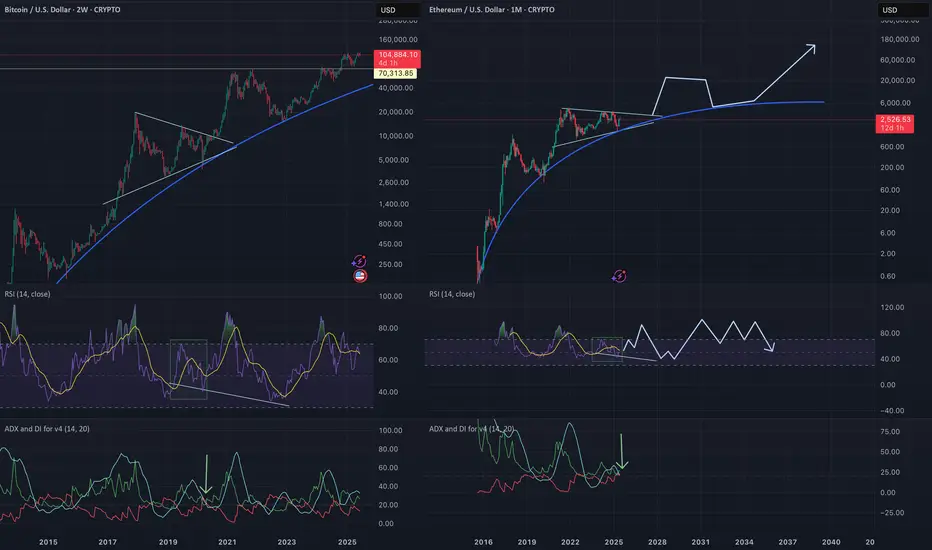
ETH Macro Analysis☕ 𝙂𝙈. CRYPTOCAP:ETH Macro analysis update...
📈 𝙇𝙤𝙣𝙜 𝙩𝙚𝙧𝙢 outlook remains unchanged and recent price action printing a doji. Target is still $7k for this cycle.
📉 𝙎𝙝𝙤𝙧𝙩 𝙩𝙚𝙧𝙢 outlook has investors looking lower towards the $1900 target but this isn't guaranteed to be reached and price action may front tat $2200.
War escalation's and retail selling are keeping price suppressed. ETF inflows and staking continue to grow!
The time for patience continues. Money is made in the sitting, weathering volatility, not flipping in and out of trades on every bit of news and price movement
𝙏𝙚𝙘𝙝𝙣𝙞𝙘𝙖𝙡 𝘼𝙣𝙖𝙡𝙮𝙨𝙞𝙨
Price is consolidating at its recent highs. Consolidation under resistance has high probability of breaking out, the longer it remains the higher the probability.
Elliot Wave (EW) analysis suggests a motif wave ended at the $2700 resistance, with a wave 2 retracement underway, likely a shallow one.
Safe trading