ETHFI/USDT10 hours ago
Key Level Zone: 1.1560 - 1.1630
LMT v1.0 detected.
The setup looks promising—price previously trended upward with rising volume and momentum, then retested this zone cleanly. This presents an excellent reward-to-risk opportunity if momentum continues to align.
Introducing LMT (Levels

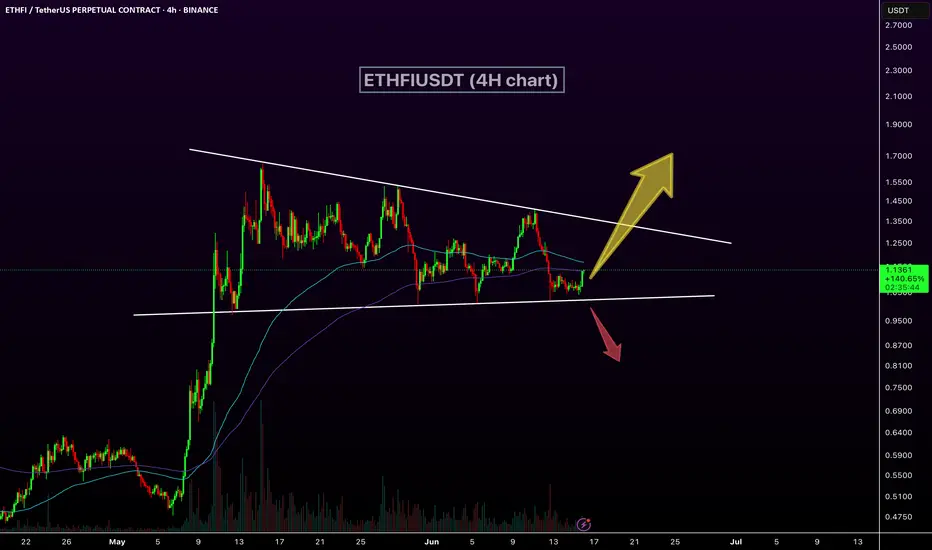
ETHFIUSDT Breakout Loading!CRYPTOCAP:ETHFI is consolidating within a symmetrical triangle on the 4H chart, with price tightening between descending resistance and rising support. A breakout or breakdown is likely soon. Watch for volume confirmation. Key levels to watch: $1.35 (resistance) and $1.00 (support). Breakout could
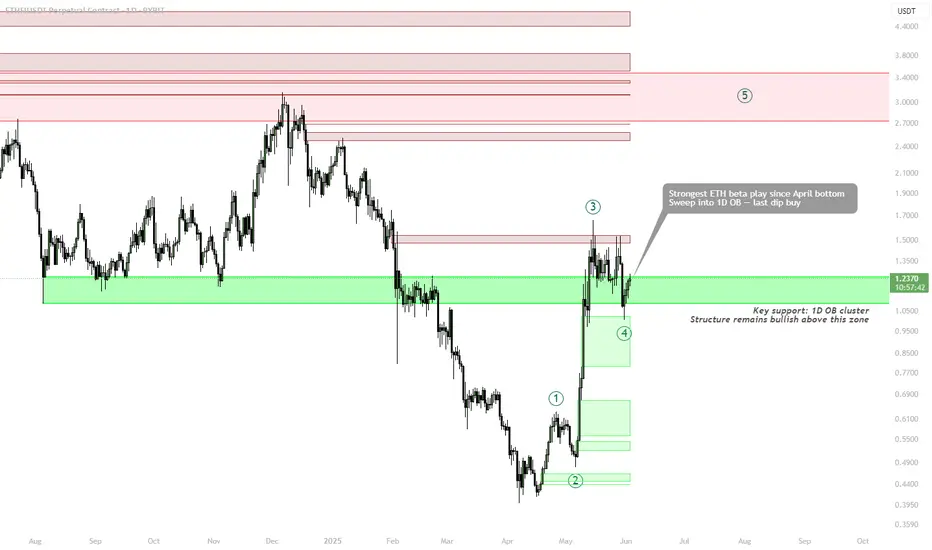
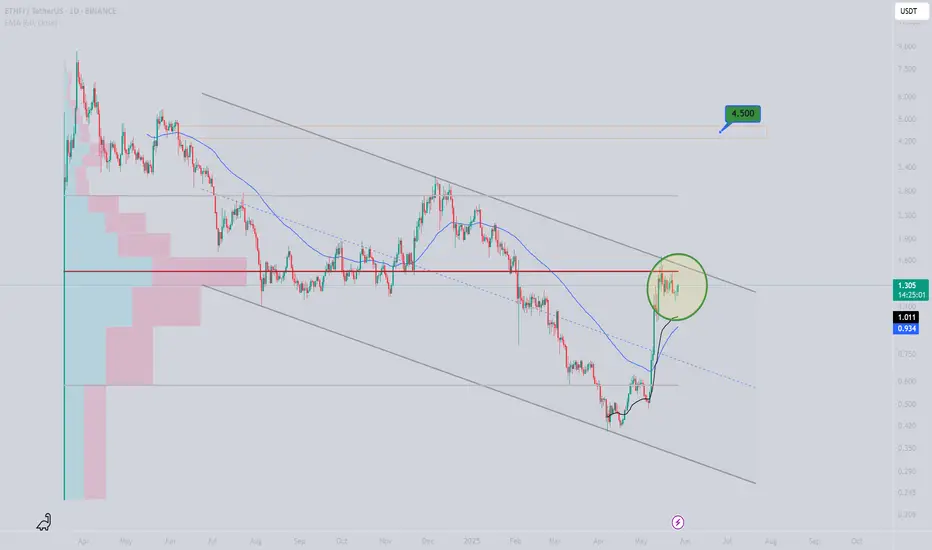
ETHFI last dip buyBINANCE:ETHFIUSDT remains one of the strongest ETH beta plays since the April bottom. After a clear impulse move and consolidation, price swept into a key 1D order block cluster, now acting as support.
Setup:
🟩 Key Support: $1.09–1.24 (1D OB cluster)
• Structure remains bullish above this zone
• R
ETHFIUSDT breakdown alertETHFIUSDT breakdown alert
ETHFIUSDT has broken down from a triangle pattern and appears to have completed a retest of the breakdown zone. If the price fails to reclaim this level and continues to reject it, we could see further downside pressure in the coming sessions.
Key levels to monitor:
– Bre

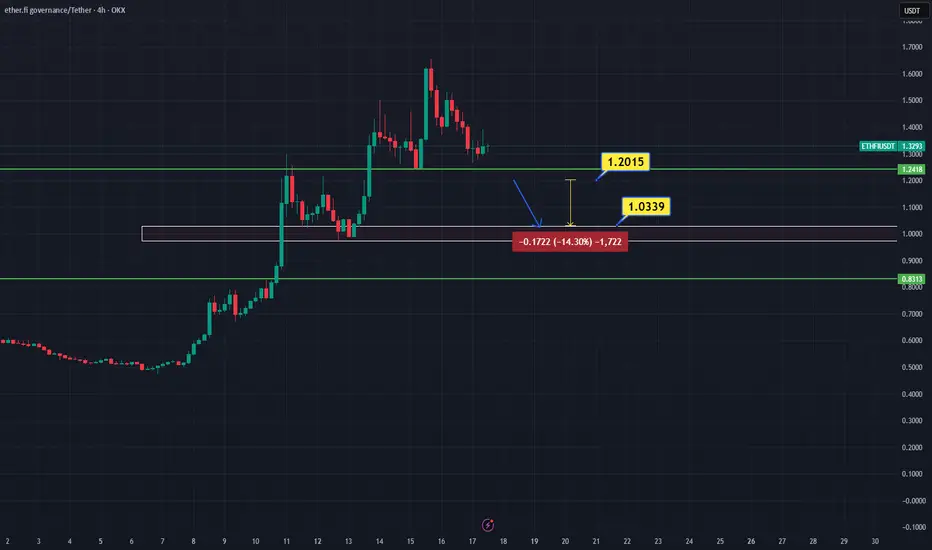
ethfi 4hIt has made a serious rise in recent days, but closing below 1.20 could bring levels to 1.034
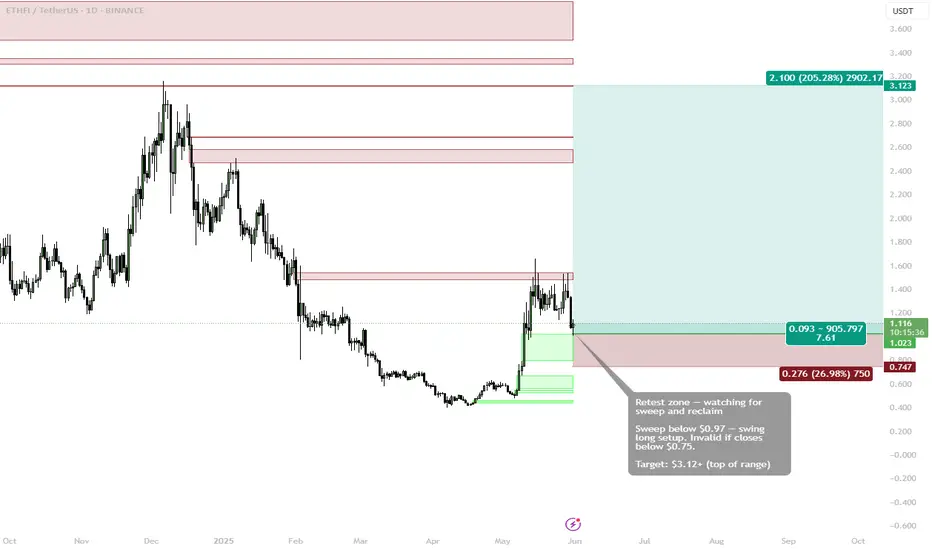
ETHFI (swing setup) — Retest in Progress Eyes on Sweep & ReclaimBINANCE:ETHFIUSDT is retesting a key breakout zone after a strong rally. Current structure suggests a possible swing long setup forming, contingent on a liquidity sweep below $0.97 and a clean reclaim.
Entry Criteria:
🟩 Retest Zone: $0.97–1.02
Looking for a sweep below $0.97 followed by a reclaim
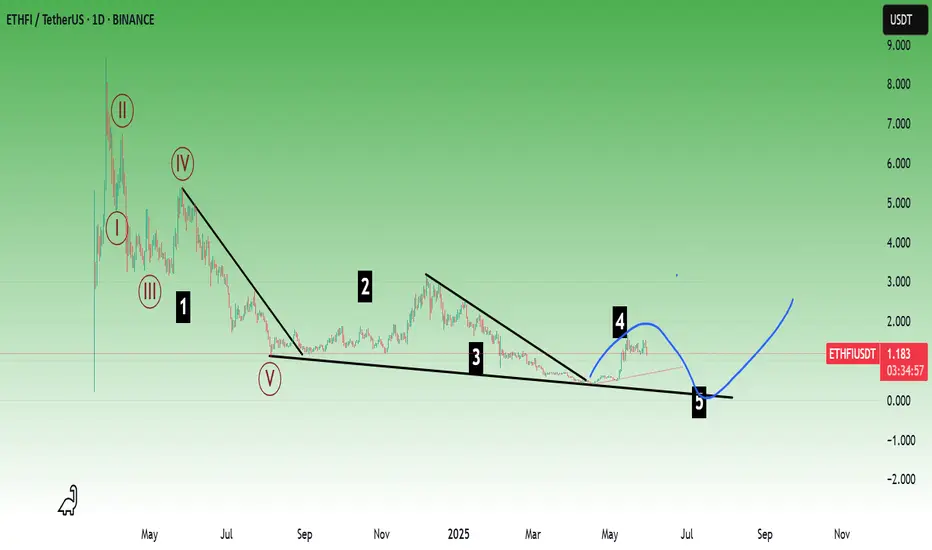
ETHFI ROADMAPTo me the view is pretty clear.
* The purpose of my graphic drawings is purely educational.
* What i write here is not an investment advice. Please do your own research before investing in any asset.
* Never take my personal opinions as investment advice, you may lose your money.
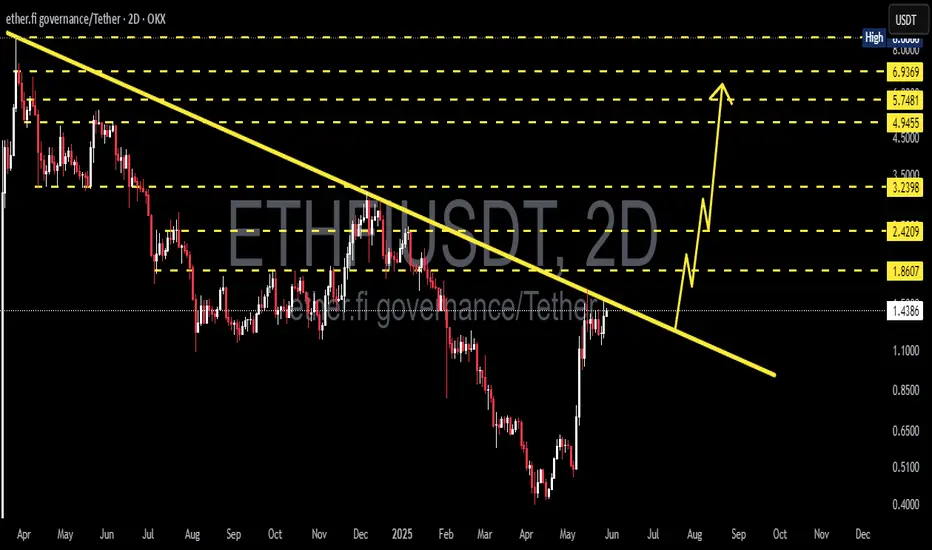
ETHFIUSDT 2D AnalysisETHFI ~ 2D Analysis
#ETHFI Buy after successfully breaking this resistance line with a short term target of at least 15%+ and a long term target of $8.7
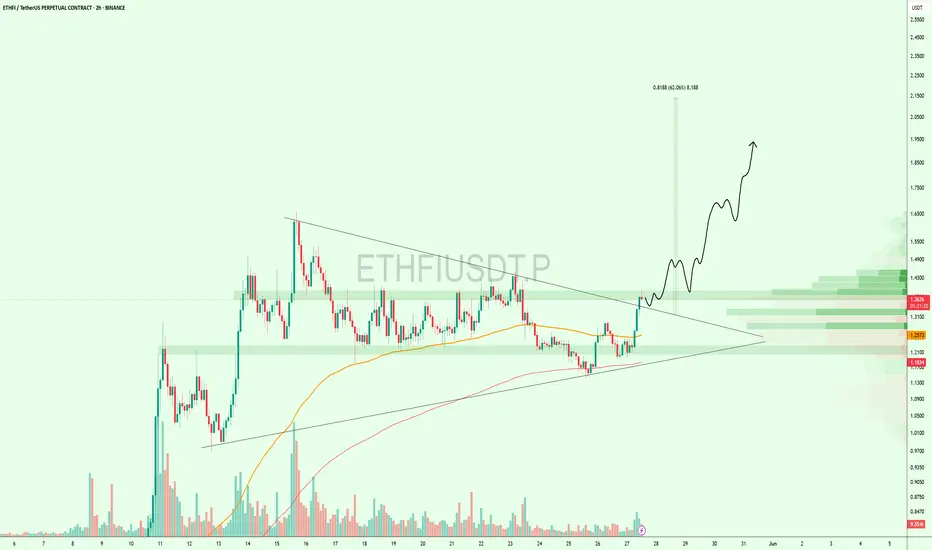
Symmetrical Triangle Breaks – $ETHFI Targets $2+CRYPTOCAP:ETHFI just broke out of a strong symmetrical triangle on the 2H chart finally escaping a long consolidation phase.
Price surged above resistance and reclaimed key EMAs, showing clear bullish momentum. If this breakout sustains, the next leg could take us toward $2.00+
Risk is tight below
ETHFIIt has good momentum
But we need to see what it does with the range it is set at
If we see demand on the higher timeframe, I think it is worth the risk.
See all ideas
Summarizing what the indicators are suggesting.
Oscillators
Neutral
SellBuy
Strong sellStrong buy
Strong sellSellNeutralBuyStrong buy
Oscillators
Neutral
SellBuy
Strong sellStrong buy
Strong sellSellNeutralBuyStrong buy
Summary
Neutral
SellBuy
Strong sellStrong buy
Strong sellSellNeutralBuyStrong buy
Summary
Neutral
SellBuy
Strong sellStrong buy
Strong sellSellNeutralBuyStrong buy
Summary
Neutral
SellBuy
Strong sellStrong buy
Strong sellSellNeutralBuyStrong buy
Moving Averages
Neutral
SellBuy
Strong sellStrong buy
Strong sellSellNeutralBuyStrong buy
Moving Averages
Neutral
SellBuy
Strong sellStrong buy
Strong sellSellNeutralBuyStrong buy
Displays a symbol's price movements over previous years to identify recurring trends.