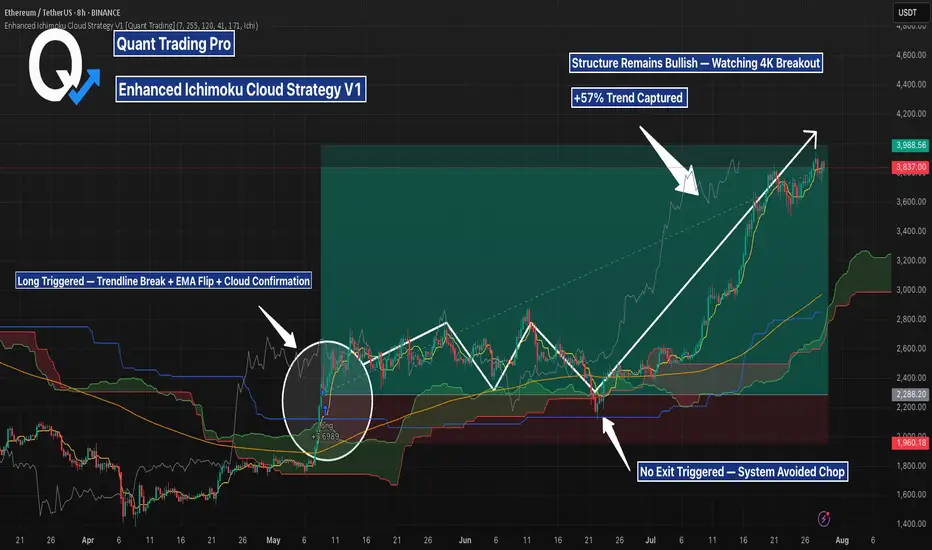
ETHUSD 8H — Strategy Nailed the Breakout, But Is $4K Next?This Ethereum 8H chart captures a powerful trend reversal, triggered by the **Enhanced Ichimoku Cloud Strategy V1**. After months of chop, the system delivered a clean entry and held the full breakout — now nearing key resistance around \$4K.
---
**📊 Setup Breakdown:**
* Entry triggered after **three major confirmations**:
* Breakout above long-term trendline
* Flip above the **171 EMA**
* Bullish **Ichimoku Cloud alignment**
* Strategy entered long near **\$2,530**, and has held the move for over 80 days
* Current price: \~\$3,988 — a **+57% trend** captured without exit signal
---
**⚙️ Strategy Logic:**
The strategy uses:
* Custom Ichimoku inputs: *(7 / 255 / 120 / 41)*
* A 171 EMA trend filter for signal clarity
* Optional “Cloud Mode” to confirm direction
* A memory-based system that reduces false chop signals
On this trade, the system **ignored mid-trend noise**, stayed in position, and let the move fully play out — exactly what it’s designed for.
---
**🔍 What to Watch Next:**
* Price structure remains bullish as ETH nears the psychological **\$4K resistance**
* Cloud support rising beneath — confirming healthy structure
* A clean break above \$4K could trigger another leg, while rejection may form a range
---
This is a prime example of how **low-frequency, high-conviction signals** can lead to massive upside when paired with disciplined exits. Backtest this strategy on your favorite altcoin pairs and compare.
Let me know when you’re ready to move to the next chart brother — this one’s ready for the spotlight 🔥
ETHUPUSDT trade ideas
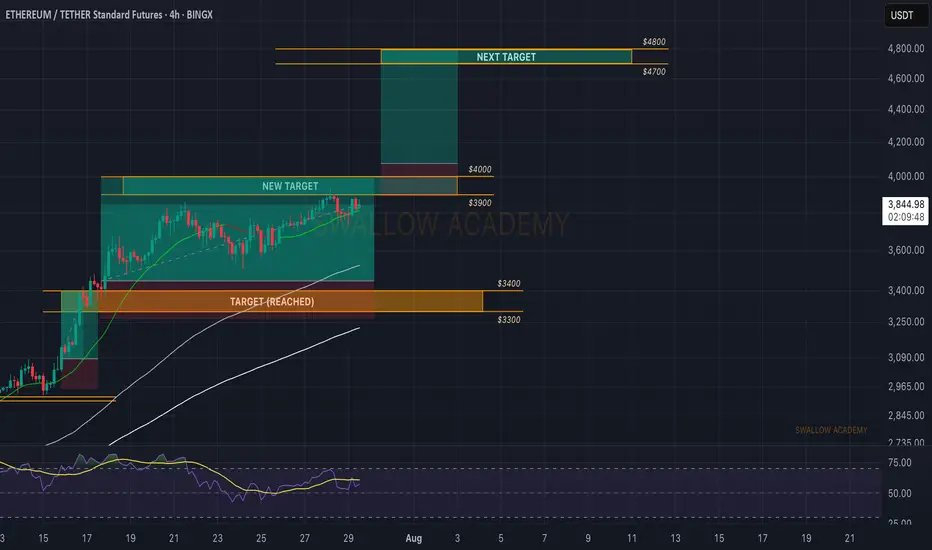
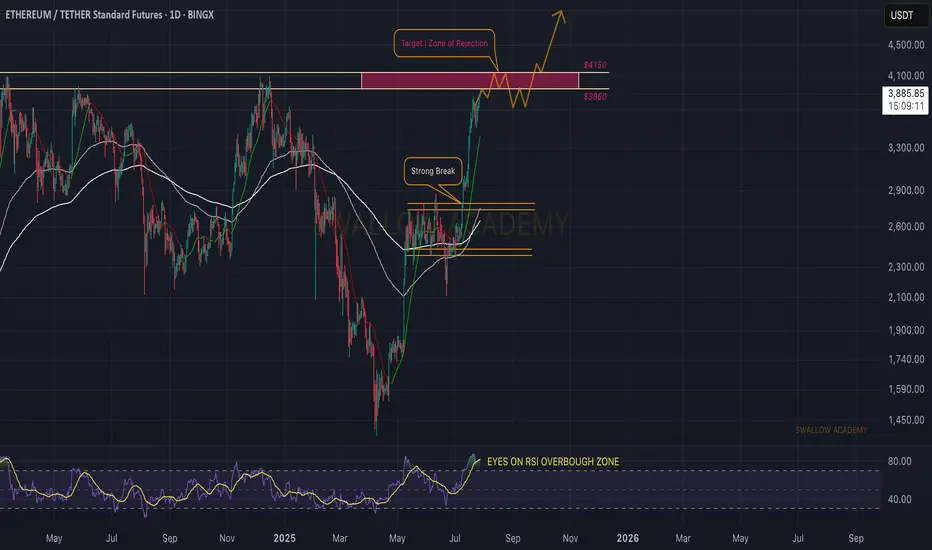
Ethereum (ETH): Approaching $4000, Targeting Next $4800Ethereum is still below our current target, which is $4000. Soon to approach it, we are looking for a breakout from there and another trade to be opened right after the breakout.
The game plan is simple: 1 trade has been successfully closed, and the second one is almost near the target. Now waiting for the third one to be activated!
Swallow Academy
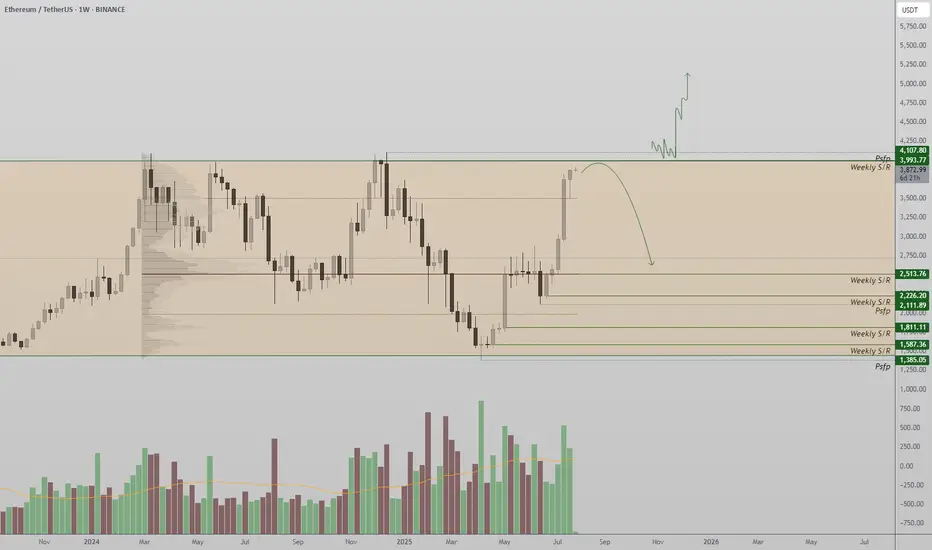
Weekly trading plan for EthereumLast week's BINANCE:ETHUSDT price action performed perfectly according to our scenarios - hitting our first target and establishing a new local high. Currently, price remains above the weekly reversal level at $3,751, maintaining potential for an advance toward Resistance #2.
Key Considerations:
While above $3,751 → Resistance #2 remains in play
Break below reversal level + trendline → Likely retest of last week's low
Such breakdown would likely breach both primary support levels
Trade Plan:
Bulls: Watch for continuation above $3,751
Bears: Require confirmed break of trendline + reversal level
As always, confirmation is key - trade the breaks, not the anticipations

ETHUSDT short positionhi traders
🔻 Short Position Setup – Overextended at Resistance
ETH/USDT is currently trading near a major resistance zone (~$4,080–$4,330), which historically marks the top of the trading range. This level has acted as strong resistance multiple times in the past, and price is now showing signs of overextension after a sharp upward move.
📊 Technical Indicators
RSI (14): Currently overbought at 77.44, with the moving average at 81.65 — levels that have previously led to pullbacks.
Volume: Elevated during the move up, but may begin to taper as momentum slows into resistance.
🧭 Trade Strategy: Short From the Top
Entry Zone: Around current levels near $4,080–$4,330
Rationale: Shorting the top of the range with overbought RSI, expecting a retracement or range rejection
🎯 Target Zones (Take-Profit Levels)
We are monitoring multiple support levels for potential profit-taking:
TP1: $3,494
TP2: $3,133
TP3: $2,827
TP4 (max target): $2,354–$2,363
⚠️ Important Note: Although we’ve identified several potential targets, we expect to close the short position earlier — depending on how the price behaves during the retracement. We'll monitor market structure, volume, and lower timeframe signals on the way down.
🛡️ Risk Management
Stop-loss: Above the previous highs (~$4,330), to limit downside risk if the breakout is sustained
Regular monitoring is essential, as macro conditions and ETH sentiment can shift rapidly.
✅ Conclusion:
We're recommending a short trade at the top of a well-defined range, with confirmation from overbought RSI and historical rejection zones. The trade includes multiple targets, but it’s likely to be managed actively and closed partially or fully before reaching the final levels.

ETH: Will Price Continue Upwards Movement! ETH has been steadily bullish in recent times, as the crypto market experienced a significant increased a safer option to invest around the global investment community. DXY and other major currencies currently experiencing a major drawdown in prices which indirectly helping the crypto market to remain bullish. While looking at how eth has performed in recent past, we can see it creating a record high in coming weeks.

Ethereum Price to Reach $4,000, but Market Top Suggests DelayBINANCE:ETHUSDT current price stands at $3,872, holding above its local support level of $3,742. While ETH is approaching the $4,000 mark , it has not yet managed to breach it. This resistance could continue to hold, limiting Ethereum's immediate potential for further gains.
Currently, 96% of BINANCE:ETHUSDT total supply is in profit. Historically, when the profitable supply surpasses 95%, it signals a market top . This has been followed by price corrections as investors begin to secure profits.
If the market top triggers a reversal, BINANCE:ETHUSDT price could drop to $3,530 or lower . A sharp decline to $3,131 is also a possibility, erasing much of the recent gains made in the past month.
On the other hand, if the influx of new addresses continues and strengthens, BINANCE:ETHUSDT may finally break through the $4,000 resistance. Should this happen, ETH could rise towards $4,425, with a renewed surge in price. This would invalidate the bearish thesis and push Ethereum into a new bullish phase.

#ETHUSDT: Price is going as expected in previous ideas on eth!!ETHUSDT is performing well as expected in our previous analysis, as the price has reached the $4000 area. There are two potential areas where the price could reverse. The first is a small correction, which could cause a sharp price reversal without a significant price correction. The second area is a void price, which may be filled before any further strong bullish movement.
Please use strict risk management while trading.
Team Setupsfx_
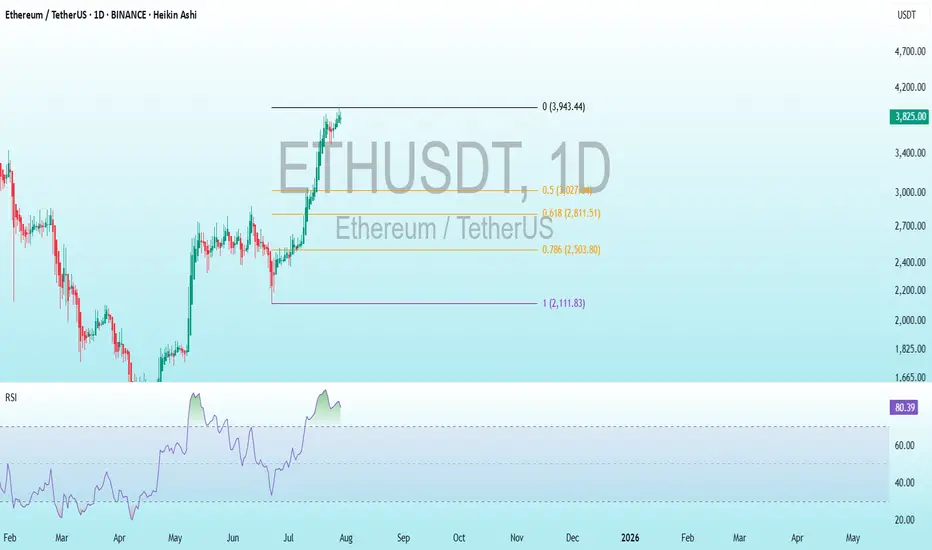
ETH Bearish DivergenceBINANCE:ETHUSDT
Rezistance Levels: 3,943.44.
Support: 2,111.83
Trade Setup:
Target 1: 3,027.64 (0.50 Fibonnaci Golden Zone).
Target 2: 2,811.51 (0.618 Fibonnaci Golden Zone).
Target 3: 2,503.80 (0.786 Fibonnaci Golden Zone).
Target 4: 2,111.83 (1 Fibonnaci).
Stop Loss: 3,943.44 (above recent high, ~25% above current price).
RSI Analysis: The RSI shows a bullish divergence (price making lower lows while RSI makes higher lows), suggesting potential upward momentum. Current RSI is around 80.39, nearing overbought territory (>70), so caution is advised.
ETH at final leg of 5th WaveAre you Ready to Touch 4000$ and start BIG Drop?
ETH is in final reound of 5th wave of 5th, 5 of 5. After that I expect a BIG drop

Eth Targetseth short term trade but once the market breals obver 3960 and sustain the longs will work great to 4350 level

Ethereum at a Critical Crossroad: Will $4,000 Finally Break ?Ethereum is once again approaching the psychologically significant $4,000 resistance level, a high-timeframe barrier that has rejected price on multiple occasions. As the second-largest cryptocurrency by market cap pushes higher, traders are closely watching for signs of a breakout—or another range-bound rejection.
Ethereum has entered a decisive phase, with price action now testing the upper boundary of a long-standing trading range. After multiple failed attempts to breach the $4,000 mark, ETH is consolidating just below this level, creating an environment filled with both opportunity and risk. Whether Ethereum can break through or gets rejected again will shape its mid- to long-term outlook.
Key Technical Points:
- Major Resistance at $4,000: A psychologically important level and long-time price cap on high timeframes
- Defined Trading Range: ETH has remained range-bound between $1,300 and $4,000 for an extended period
- Critical Candle Closes Needed: Breakout requires strong daily or weekly closes above $4,000 to confirm
Ethereum’s price is hovering just under the $4,000 resistance zone, which has acted as a ceiling for price action since early 2022. From a high time frame perspective, ETH has been range-bound, trading between $1,300 as the range low and $4,000 as the range high. Each visit to this upper boundary has led to a rejection and a subsequent rotation back toward mid-range or lower levels.
Now, with momentum building and bullish sentiment returning across the crypto market, Ethereum finds itself at another pivotal moment. The key technical requirement for a confirmed breakout will be a decisive daily or weekly close above the $4,000 level. Without this confirmation, any temporary push above the resistance could result in a fakeout and trap late long entries.
Volume behavior around this zone remains mixed. While there is some bullish buildup in recent sessions, there has not yet been a significant influx in volume to confirm conviction from buyers. This aligns with the historical pattern of Ethereum trading at resistance before eventually pulling back, suggesting caution is still warranted.
However, should ETH close decisively above $4,000 and turn this level into support, it would mark the first major break of this range since its inception. This would likely trigger a wave of bullish momentum, possibly sending Ethereum to new yearly highs, with $4,500–$5,000 being the next logical resistance zones based on historical price pivots and Fibonacci extensions.
What to Expect in the Coming Price Action
Ethereum’s price action is currently neutral-bullish but hinges entirely on its interaction with the $4,000 resistance. A confirmed breakout could usher in a powerful rally toward new highs, while another rejection would likely continue the long-standing range between $1,300 and $4,000. Until a decisive move occurs, traders should remain cautious and reactive rather than overly anticipatory.
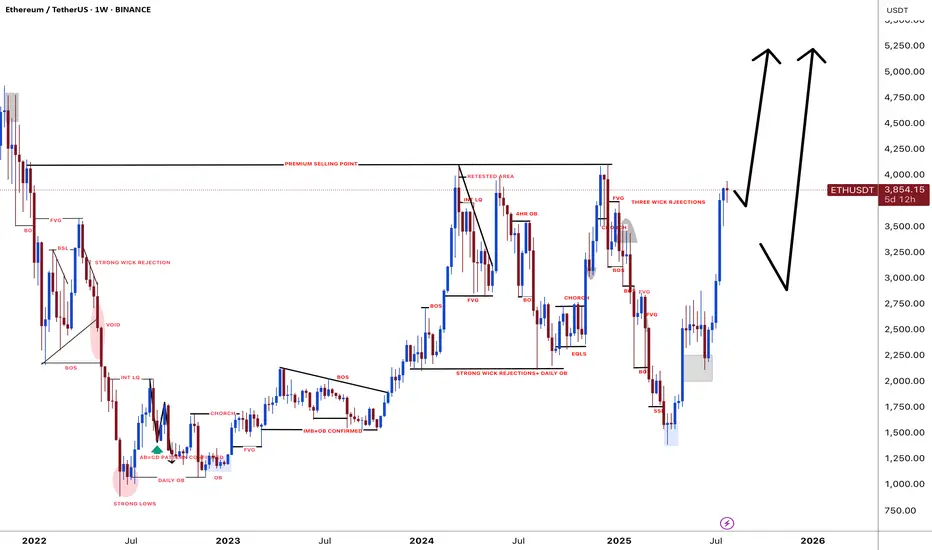
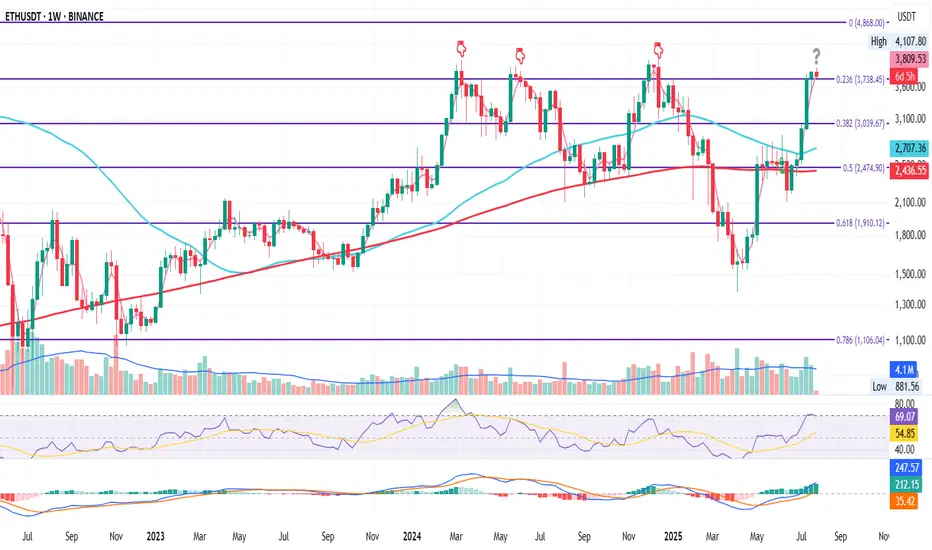
ETH Weekly Flip ZoneETH on the Weekly
ETH just closed the week above the 0.236 Fib level at $3738.45.
It’s the fourth attempt to conquer this zone since the June 2022 bottom.
If price holds above this level, the odds of continuation increase.
If it fails, we could see downside.
It may also just consolidate here for a while.
RSI just touched overbought, and MACD remains green — still some room for upside.
I remain bullish long term, but this looks like a smart area to manage risk if you’re late to the move, or take partial profits.
Always take profits and manage risk.
Interaction is welcome.
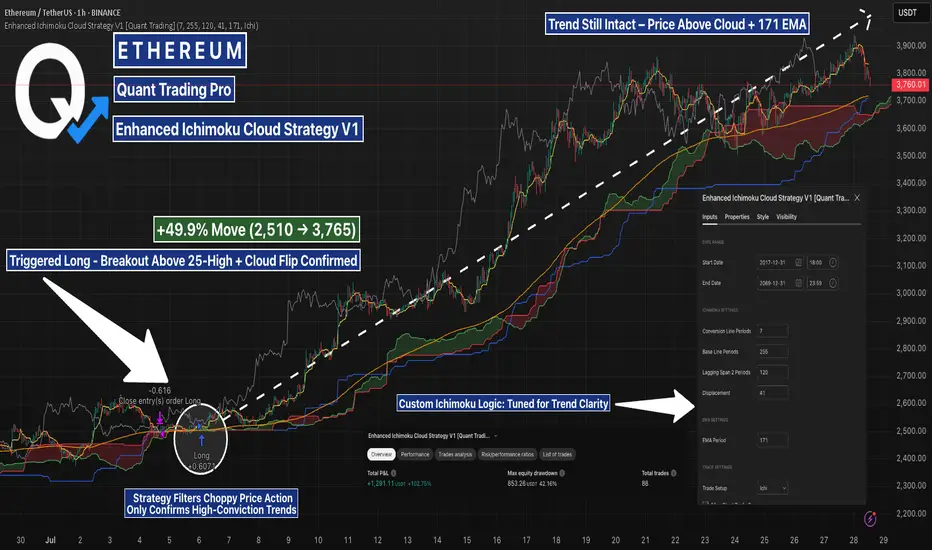
ETH 1H Cloud Strategy Nailed the Trend, But Is It Losing Steam?This Enhanced Ichimoku Cloud Strategy filtered out the chop and triggered a high-conviction long at 2510 — backed by a bullish cloud flip, 25-period breakout, and alignment above the 171 EMA. Since then, price has climbed nearly +50%, with the trend still intact above both cloud and EMA.
The custom parameters (7 / 255 / 120 / 41) are tuned for clarity and patience, making it ideal for swing entries on volatile assets like ETH and SOL.
Want to optimize for your own asset? Just load the strategy, tweak the inputs, and run a parameter test using TradingView’s Strategy Tester.
#ETHUSD #Ichimoku #TradingStrategy #TrendFollowing #TradingView #CryptoTrading #AlgoTrading
Buy LimitI think it's a great zone to buy — but only if the selling volume decreases as the price approaches that area. Otherwise, we wait for the volume to drop. But I will never buy above that price, even if I miss the move.
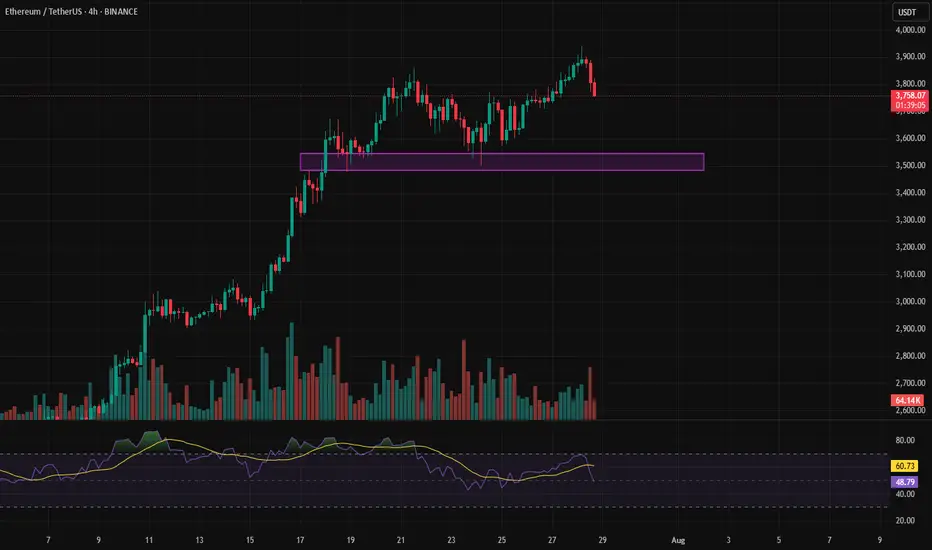
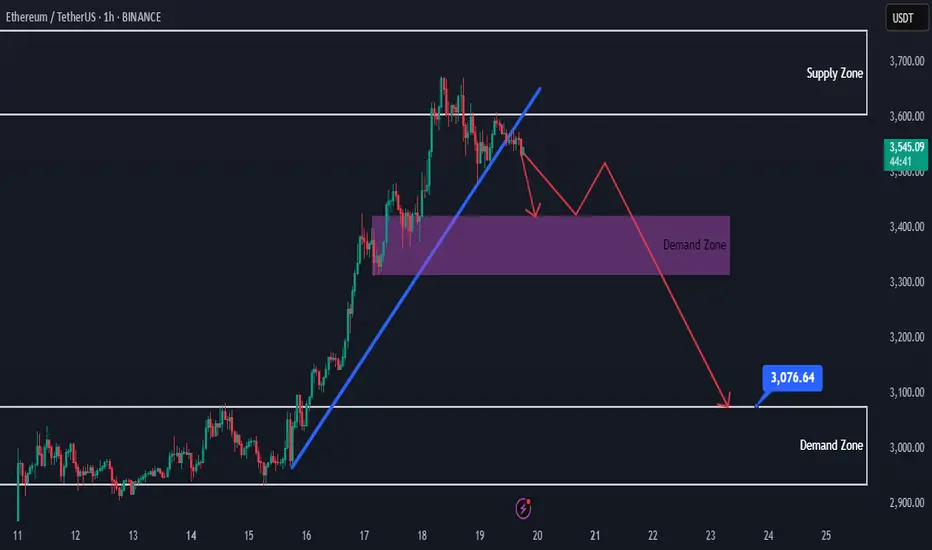
Ethereum at Key Supply — Short-Term Sell OpportunityHello everybody!
Ethereum has reached a strong supply/resistance area in the daily timeframe.
As we see on the chart, lower highs have started to forming.
In addition to that, an upward trendline has been broken.
Keeping in mind that overall trend is bullish, we can look to short time sell positions here.
The first target can be 3300-3400.
If the price breaks below 3300, we can expect it to go lower toward 3100 area.
Manage your risk and trade safe!
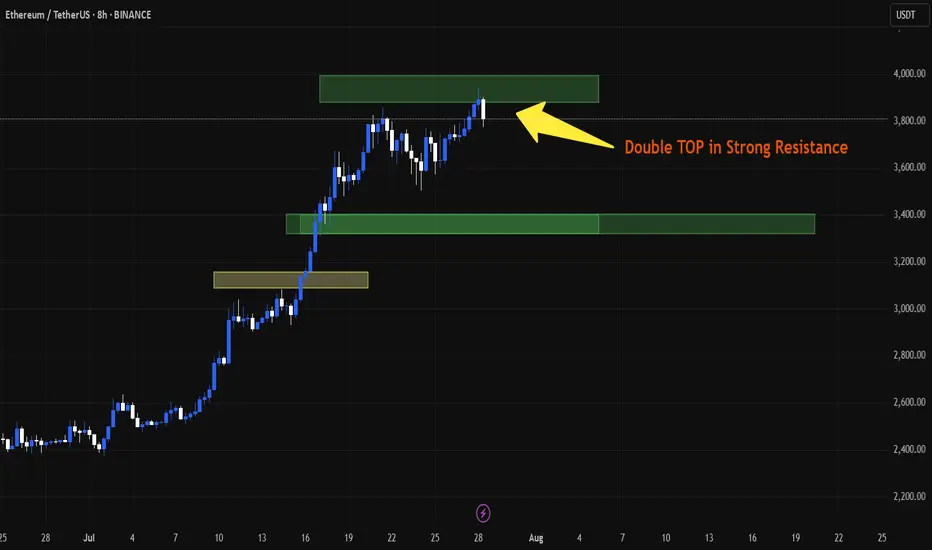
ETH may have PULL BackAs we can see, a double top has formed at around $4,000 and I guess we have a pullback to around $3,500. The new RSI is showing a pullback and strong divergence. If ETH breaks $4,000, this analysis will be rejected.
ETHEREUM Long Outlook – Grand Supercycle Perspective(2025.05.21)Hello everyone,
This is SeoVereign, operator of the SeoVereign Team.
Today, I would like to share an Ethereum analysis based on the daily (1D) chart for the first time in a while.
Before reading this post, please refer to the idea I uploaded on April 18, 2025, through the link below. It will help you better understand the context:
🔗
(Clicking the image will take you to the corresponding link.)
If you look at the April 18 idea, you’ll see that I presented a bullish outlook based on the Deep Crab pattern.
This analysis is a continuation of that idea.
Through years of research, I’ve observed that when a Deep Crab pattern sees a rebound from the PRZ (Potential Reversal Zone), the trend that begins from that point tends to extend for a long time.
If you look closely at the chart, you’ll also see the 2.24 Fibonacci extension level.
Some people messaged me saying, “Since it went above 1.902 and even exceeded the 2.0 Fibonacci line, isn’t this Deep Crab invalid?”
However, I’ve studied harmonic patterns in depth for a long time and have set my own Fibonacci criteria based on that research.
In this particular Deep Crab case, I define the invalidation level as 2.24.
Therefore, I judged that the pattern is still valid, and this allowed me to forecast a long-term bullish trend.
Back to the main point,
Based on this Deep Crab pattern, I’ve consistently maintained a bullish outlook on the daily chart,
and so far, there have been no clear signals indicating a reversal into a bearish trend.
Thus, I would like to post a continuation of the bullish outlook on the daily chart.
On May 19, 2025, there was a sharp drop around the 2,587 USDT level.
At that time, our team expected the bullish trend that started from around 2,447 USDT to hold its low and continue.
However, the price broke below 2,447 USDT and made a new low.
We then closely monitored Bitcoin’s movement in response.
Typically, strong volatility occurs before a major trend begins.
Bitcoin was also showing significant volatility at the time.
So we concluded: “Let’s maintain a bullish stance, but do not be fully convinced until the previous high of 2,587 USDT is clearly broken upward.”
And by the time this post is published, we’ve confirmed that the price has indeed broken above 2,587 USDT.
Therefore, I have come to the conclusion that the bullish trend is still valid.
Based on this, I present the following three target levels.
🎯 SeoVereign’s Ethereum Bullish Targets
1st Target: 3,000 USDT
2nd Target: 3,400 USDT
3rd Target: 3,700 USDT
The market still shows strong volatility.
I sincerely hope you all trade wisely and calmly, achieving great returns,
and may great fortune be with you both in trading and in life.
I’ll see you again in the next daily analysis.
Thank you.
- SeoVereign

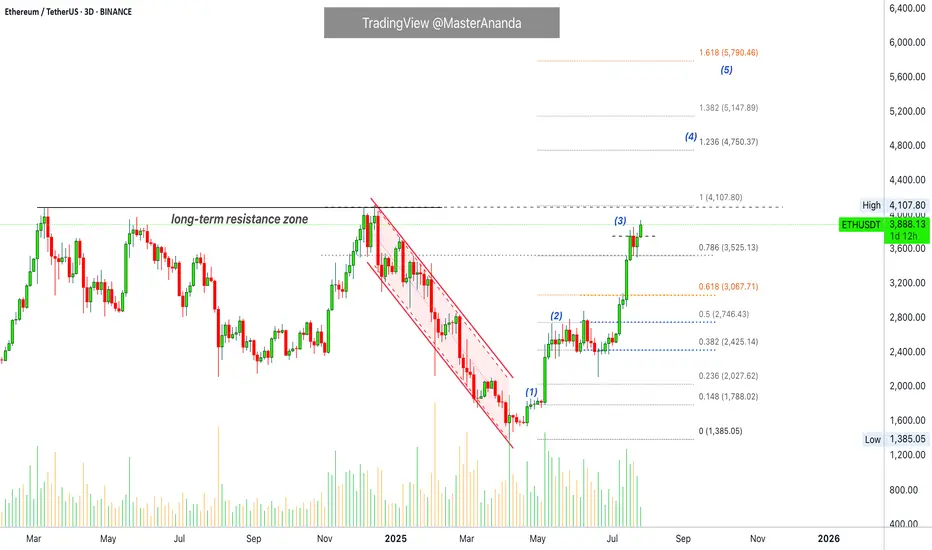
Ether Update · Accumulate, Buy & Hold · 2025 StrategyGood morning my fellow Cryptocurrency trader, I hope you are having a wonderful day.
Ethereum continues really strong and today is trading at the highest price since December 2024. Right now getting close to a long-term resistance zone that was first established in March 2024. As soon as ETHUSDT manages to break $4,100 as resistance, we can expect a major advance toward a new all-time high. Remember, sustained long-term growth, just as it is happening already. Notice the slope on the rising wave since April. It will continue just like this, prices going higher and higher until a final jump produces very high prices based on a long wick.
Market conditions have not change since our last update. Everything is extremely bullish and the chart looks even better now, the rest of the market is also looking better so the focus should be on hold and preparing a profit taking strategy. How will you profit from this trade? How do you intend to sell? How will you reduce or close your position when the time is right? You can start preparing now.
There are many ways to approach the targets but it is always wise to wait at least until a new all-time high. Since we have enough data support a new all-time high as a high probability scenario, we want to benefit as much as possible from the uptrend and thus we ignore the initial easy targets. We go for the higher targets because we are now in the 2025 bull market.
When in doubt, you don't have to be 100% right but neither 100% wrong. If you don't know how the market will behave next, instead of thinking to sell the entire position, you can sell a small portion only, say 10%. And continue like this long-term.
There are many strategies, many ways to plan and win, but for now focus on holding patiently, patience is key. Those who can wait the longer without being tempted can produce the best results. Just let it roll... The market is set to grow. Accumulation and buying now the best choice.
Namaste.
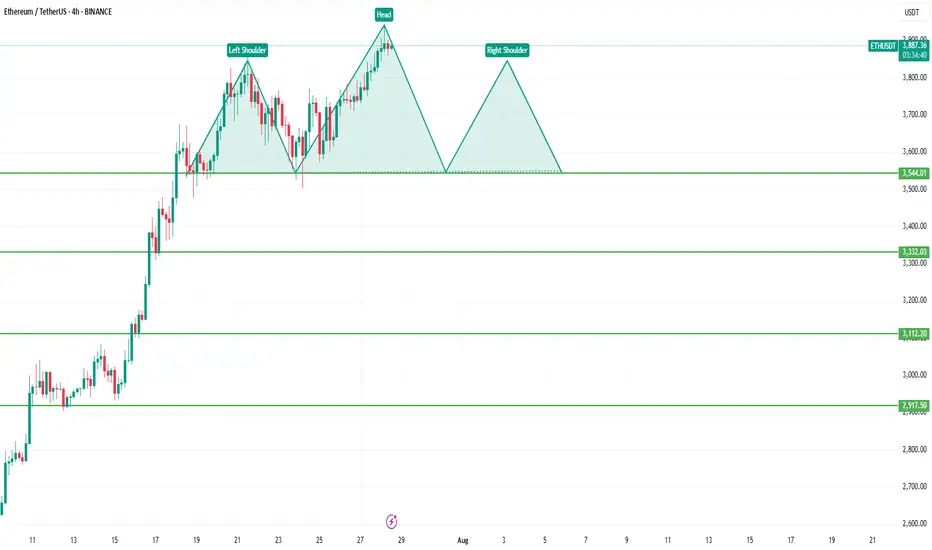
"ETH Warning Signal: Is a Bearish Breakdown Imminent?"📊 Pattern Overview: Head and Shoulders
Left Shoulder: Formed around July 24th, marked by a high near $3,800 followed by a retracement.
Head: A higher peak on July 27th, topping out near $3,888, then pulling back again.
Right Shoulder: Currently anticipated, projected to form around the same height as the left shoulder, with a potential completion near $3,800 before another decline.
Neckline: Flat support line around $3,544, acting as the crucial level that, if broken, confirms the pattern.
🧠 Interpretation
The Head and Shoulders is generally interpreted as a trend reversal pattern. In this context, Ethereum has been in a strong uptrend, but the pattern signals a potential topping out and shift toward a bearish phase.
If ETH breaks below the neckline at $3,544 with volume confirmation, it would signal that bulls are losing control, and sellers may take over.
📉 Bearish Breakdown Target
The theoretical downside target can be calculated by measuring the distance from the Head to the Neckline and projecting it downward from the neckline:
Head peak: ~$3,888
Neckline: ~$3,544
Height: ~$344
📌 Target after breakdown:
$3,544 - $344 = $3,200 (approx.), with interim support levels around:
$3,332 (horizontal support)
$3,112
$2,917
These levels might act as pause points or bounce zones if the breakdown unfolds.
🟢 Invalidation Scenario
If Ethereum invalidates the pattern by:
Breaking above the Head level ($3,888) and holding
Sustaining higher highs with strong volume
Then the bearish thesis would be invalidated, and bulls may aim for continuation toward $4,000+ levels.
🧩 Strategic Takeaways
Aggressive traders might short the neckline break at $3,544, with stops just above the right shoulder (~$3,800).
Conservative traders may wait for a retest of the neckline post-breakdown.
Risk management is key, especially in crypto markets, which are known for head fakes and false breakouts.
⏳ Final Thought
This setup doesn't guarantee a drop—it merely increases the probability of a reversal. Watch for volume on the neckline break and monitor how price reacts at key support levels.
DYOR before taking a trade
Ethereum (ETH): $4000 Incoming | Breakout or Rejection?Ethereum is not showing any remorse to sellers of the coin, and we are almost near the major resistance zone of $4000.
What we are looking for or expecting from here is either to get the proper breakout from this region or a rejection. As of now it is hard to say which one we will get so once we reach that resistance, we are going to look at further market structure development for any more signs.
Swallow Academy
EthusdNot discounting the potential for a dip into the August montly open...
Retesting the trend line break for a second time..
Then we enter etf bid war phase.. multiple companies attempting to emerge as the strategy b of ethereum.
Bitmine and sharplink are leading but there's about 10-30 companies starting to accumulate heavily..

Ethereum (ETH): Getting Closer To Our Third Target | $4000Ethereum has done really well since our entry, and we are almost at the third target. After that, we are going to expect to see the movement towards the ATH area.
As we said, money flow has to go somewhere, and as Bitcoin has had its time, now people need new projects where to get their profits from, which was of course the ETH. Still good for long, still has time to make that new ATH.
Swallow Academy

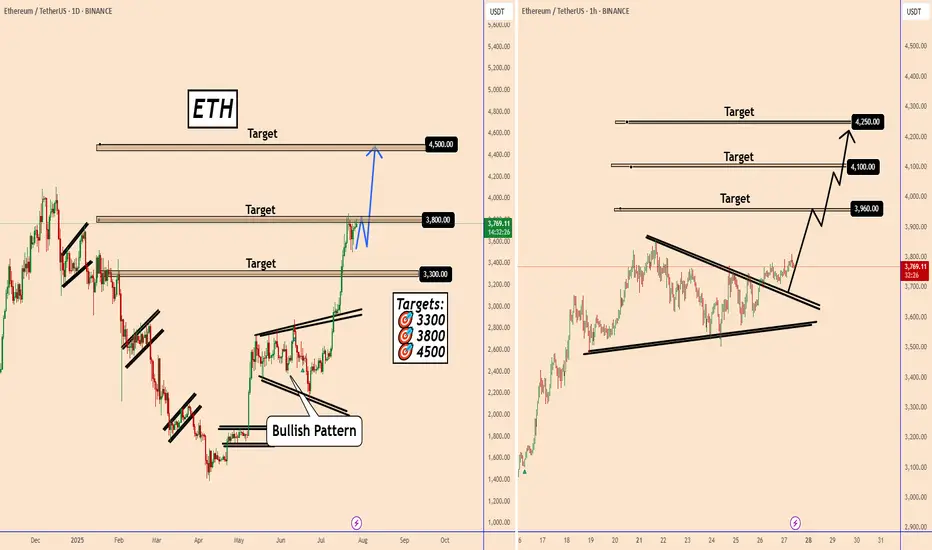
Ethereum: Multiple Time Frame AnalysisEthereum: Multiple Time Frame Analysis
From the chart, we can see that Ethereum is in a clear uptrend on all timeframes.
The daily chart is bullish and is not yet showing signs of a reversal on the May timeframe.
Yesterday, ETH also confirmed an ascending triangle pattern on a lower timeframe, indicating potential upside as shown in the chart.
Key target areas: 3960; 4100 and 4250
You may find more details in the chart!
Thank you and Good Luck!
PS: Please support with a like or comment if you find this analysis useful for your trading day