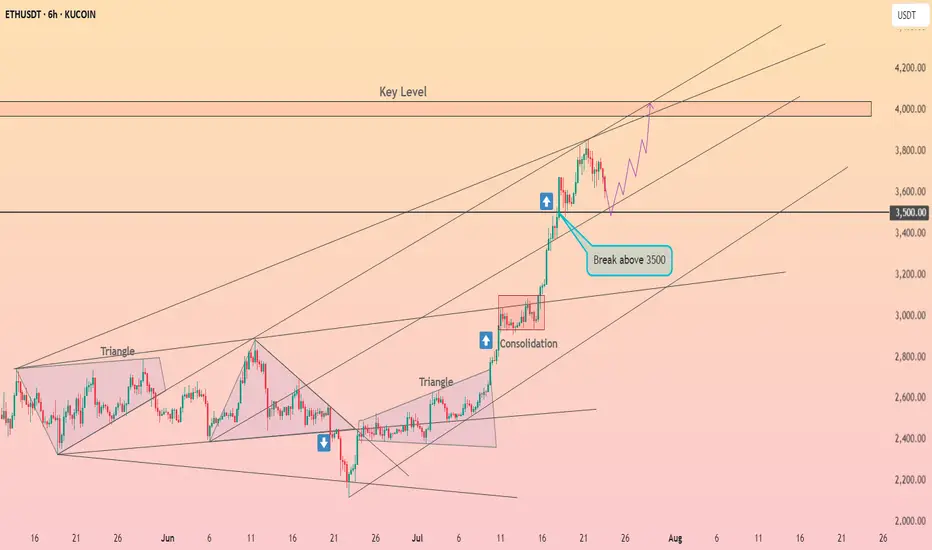
Ethereum will retest the $3,500 level ┆ HolderStatOKX:ETHUSDT is trending upward with $3,100 as the next resistance. Breakout aims for $3,250. $2,875 remains critical support. Bullish momentum intact.
ETHUPUSDT trade ideas

Ethereum Analysis + Market Overview 🚀 Ethereum Analysis + Market Overview 🚀
Before diving into Ethereum, let’s quickly review the overall market conditions 👇👇👇
(For a more detailed market analysis, you can check my previous post, I’ll link it below.)
---
🔹 Analysis style:
Reviewing previous highs/lows breakouts in the mid-term (MWC - 4H).
Entries based on momentum & volume.
---
♦️ USDT.D
Support: 4.22
Max expected correction: 4.51
If 4.51 breaks upward, this could push us toward short positions.
---
♦️ BTC.D
Yesterday’s levels & analysis still remain valid.
Remember, on HWC (1D), after the recent downtrend, there’s only been one bullish candle.
For altcoins to rally: BTC.D must drop below 61.6 → 60.83 → 60.42.
Otherwise, if BTC.D grows (bearish for alts), 62.17 is the key resistance to watch.
---
♦️ TOTAL (Crypto Market Cap)
Must break 3.91 to confirm a bullish trend.
Early signal: 3.85 (1H timeframe).
---
♦️ TOTAL2 (Altcoin Market Cap)
Early bullish signal: 1.48
Confirmation level: 1.55
---
♦️ ETH (Ethereum)
Ethereum has shown strong support around 3500, despite the 48-hour drop, which reflects solid buying activity.
Additionally, positive whale news is increasing.
Early & risky trigger: 3653 (1H) – already broken.
Next potential entries:
3750 (1H)
3833 (4H)
Preferred entry: 3750, as it allows a tighter & safer stop-loss.
Beware: Fake breakout probability around 3833 is high.
Stop-loss for all 3 levels: 3455.
---
🔸 Entry Strategy:
If volume & momentum increase → place a stop-buy order on the exchange.
If volume is weak → wait for confirmed breakout above 3750.
---
♦️ ETH.D
The chart is fully bullish.
If ETH hits 3750, an early long position could be taken.
---
💎 Follow me & hit 🚀 for more real-time updates and setups!
---

ETH/USDT – Altseason Confirmation in Sight?Ethereum's recent breakout at 1900$ is showing strong momentum and may be signaling the long-awaited start of altseason. A daily close above the red resistance box will act as a key confirmation of this shift and could trigger a parabolic move across many altcoins.
For ETH, the next upside targets are:
$3,500
$4,000
$4,700
Stay alert — a confirmed breakout here could light the fuse for the broader altcoin market.
Ethereum’s $4,000 Target Alive as Historic Rally Signs EmergeBINANCE:ETHUSDT is currently trading at $3,680, just 9% away from the critical $4,000 resistance that many investors have been waiting for over the past seven months. The altcoin is expected to continue its upward momentum despite the recent consolidation, with the potential to breach the $4,000 mark soon.
Looking at broader technical indicators, the NUPL (Net Unrealized Profit/Loss) suggests that BINANCE:ETHUSDT is poised for a significant rally . The NUPL indicator, when reaching a threshold of 0.5, traditionally signals a pause in the uptrend, followed by a sharp rally.
$ BINANCE:ETHUSDT is currently nearing this threshold , which, in the past, has marked the beginning of powerful upward price action.
As long as BINANCE:ETHUSDT remains above its key support levels, the price is likely to surge toward $4,000 . If Ethereum can maintain its momentum, a breach of $4,000 could act as a catalyst for further gains.
However, should unforeseen selling pressure arise, $BINANCE:ETHUSDTprice could slip below the $3,530 support level. In such a scenario, Ethereum may fall to $3,131, invalidating the current bullish outlook. The key will be maintaining support and capitalizing on the retail-driven surge.

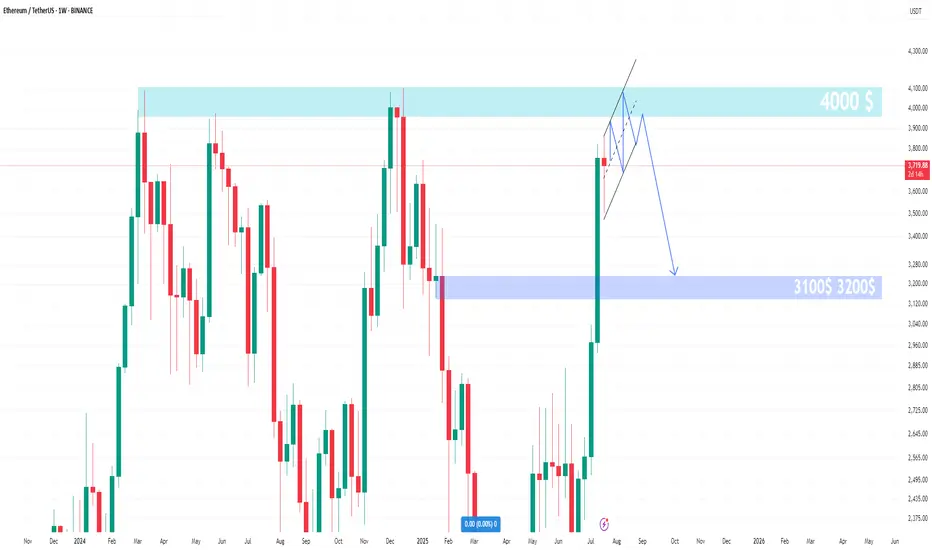
ETH-USDT Close to the supply areaI think Ethereum can grow to the $4,000 range. Then it will enter a good correction. What do you think? 😊
eth usdt short setupEth showing some correction towards 3.4-3.2k , I'm not bearish but alts needs some correction before another mini leg-up, must use sl, take some entry at 3681 and other on 3695. If tp hits first then ignore it.
Ethereum (ETH): Buyers Accumulated | Time For Boune & BreakoutEthereum had its fun this week, and now we are already seeing some signs of buyer dominance forming here.
Based on our overall target and bigger timeframes, TAs, the $4000 is the target and 4hour candels are showing that buyers have not given away anything yet but rather have just been accumulating.
As long as we are above our entry area, we are bullish, and so should you be ...
Swallow Academy

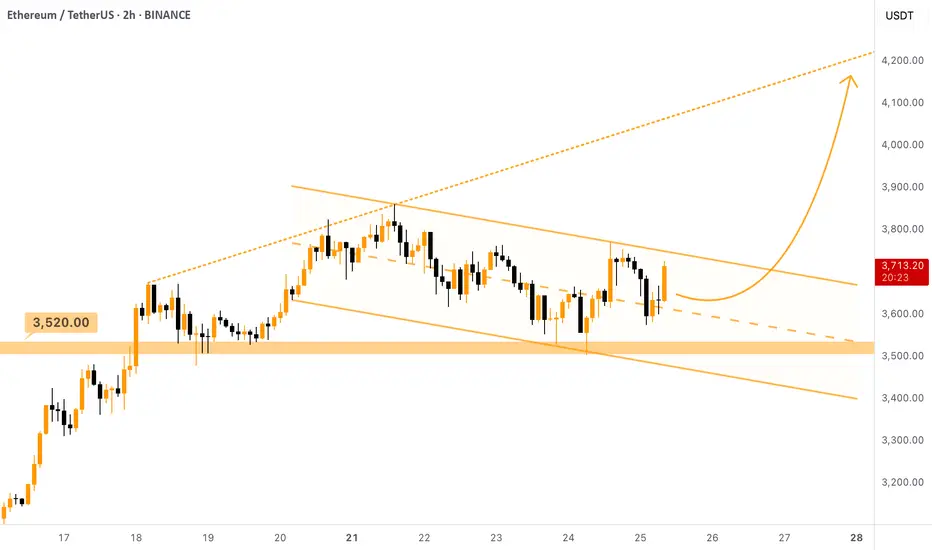
$ETH - Taking Lead Over $BTC (again)Ethereum is strong as ever here. Despite Bitcoin dumped due to the FUD of Galaxy Digital selling CRYPTOCAP:BTC worth of $3.5B, Ethereum managed not stay above the support and even umped!
It is currently forming a Descending Channel (bullish pattern) above the $3520 support level. Local setup. Once this channel is broken upwards, we can expect the price to move towards the ascending resistance that was set a week ago, target is $4100 - $4200 .
You can either enter a trade here or wait for the breakout of the descending channel, the second option is safer.
Flat, Quiet… and Full of Clues .Most traders only see the middle.
The acceleration. The “trend”. The movement.
But that’s just one-third of the story.
If you really want to understand the market’s rhythm,
you need to study how moves begin, evolve, and die.
Let’s break down the 3 key phases every market goes through —
again, and again, and again.
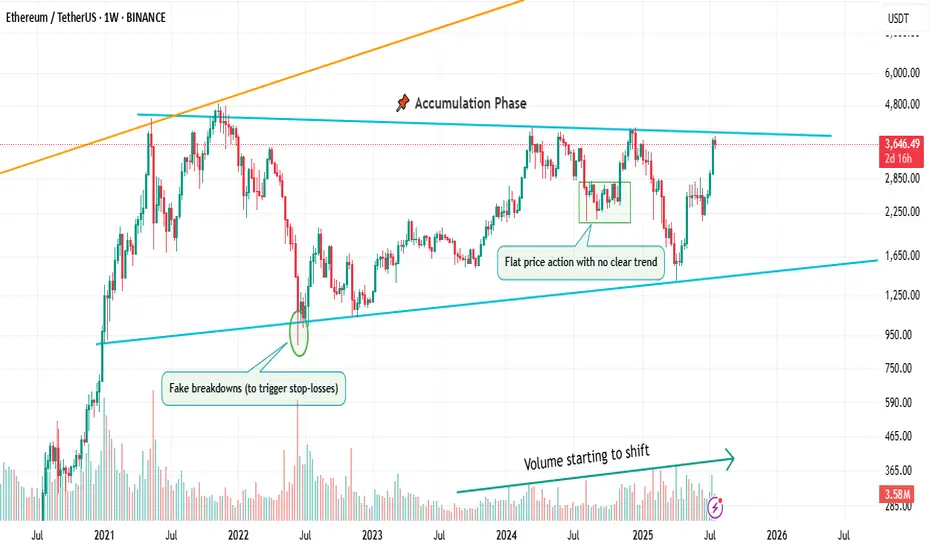
📌 1. Accumulation Phase
This is the part no one talks about.
Why? Because it’s boring. Choppy. Range-bound. Confusing.
Most traders get shaken out here.
But smart money? They’re quietly buying.
You’ll often see:
Flat price action with no clear trend
Fake breakdowns (to trigger stop-losses)
Volume starting to shift
Long wicks — both directions
This phase is a test of patience, not prediction.
And if you learn to read it well, you’ll start catching moves before they go parabolic.
🚀 2. Markup / Acceleration Phase
Here’s where everyone wakes up.
Momentum kicks in.
News gets bullish.
Breakouts start working.
Pullbacks are shallow.
And suddenly, everyone’s calling it a bull market.
But don’t be fooled.
This is not where smart money enters — this is where they ride the wave they already created.
Learn to:
Ride trends, not chase them
Add on pullbacks
Avoid FOMO entries
This is the fastest and most emotional part of the cycle — which means it rewards discipline, not excitement.
🧯 3. Distribution Phase
The party’s still on… but the hosts are quietly leaving.
Price starts to stall.
Breakouts stop working.
Volume gets heavy at the top.
And the same excitement that brought everyone in?
It’s now being used to sell into.
Distribution is sneaky.
It’s not an obvious top.
It’s a process — just like accumulation.
You’ll often see:
Lower highs forming quietly
False breakouts to trap buyers
Increasing volatility
Bullish news… with no follow-through
If you’re not paying attention, you’ll keep buying strength —
right before the rug gets pulled.
So what’s the lesson here?
Markets don’t just “go up or down.”
They prepare, move, then exhaust.
And if you learn to spot these transitions —
you’ll stop reacting late
and start positioning early.
That’s the real edge.
currently we are on the accumulation phase so in this idea I tried to show you the real story behind it and as well talk about the two others to beware of them also in the right moment I will talk about them , but for now let's focous on the current phase because we want to be part of the smart money and enjoy the next phase which is 🚀Markup / Acceleration Phase .
—
🧠 Save this post.
🔁 Revisit it when you’re confused.
📊 Because the chart isn’t random — it’s just cycling
And also remember our golden rule :
🐺 Discipline is rarely enjoyable , but almost always profitable. 🐺
🐺 KIU_COIN 🐺
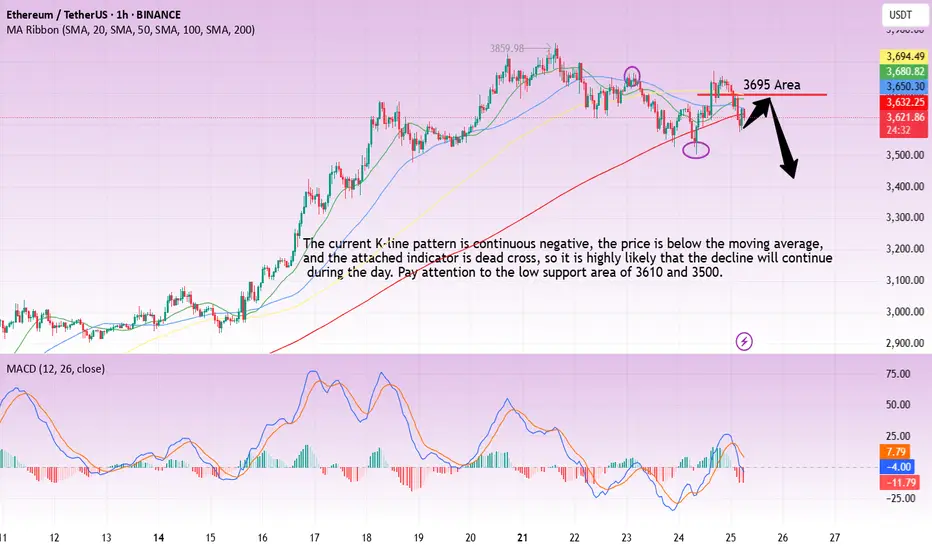
ETH-----Sell around 3690, target 3615 areaTechnical analysis of ETH contract on July 25:
Today, the large-cycle daily level closed with a small positive line yesterday, the K-line pattern was single negative and single positive, the price was at a high level, and the attached indicator was golden cross and running with shrinking volume. From the big trend, the current trend is in a weak trend, the price rebound is not strong and has not continued, the trend is prone to fall under pressure and test the low point downward, so the trend has changed; the short-cycle hourly chart yesterday hit a high in the US market and fell under pressure in the Asian morning. The current K-line pattern is continuous negative, the price is at a low level, and the attached indicator is dead cross running. It is highly likely that the decline will continue during the day. Yesterday's low point of 3500 is the position that needs to be paid attention to today. The current hourly chart resistance is near the 3695 area.
Today's ETH short-term contract trading strategy:
Sell in the 3690 area after the rebound, stop loss in the 3720 area, and target the 3615 area;
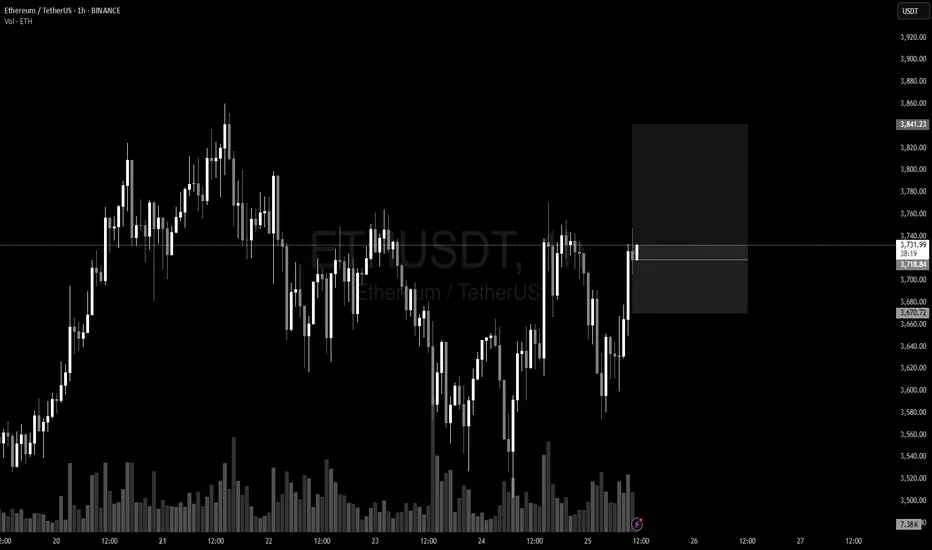
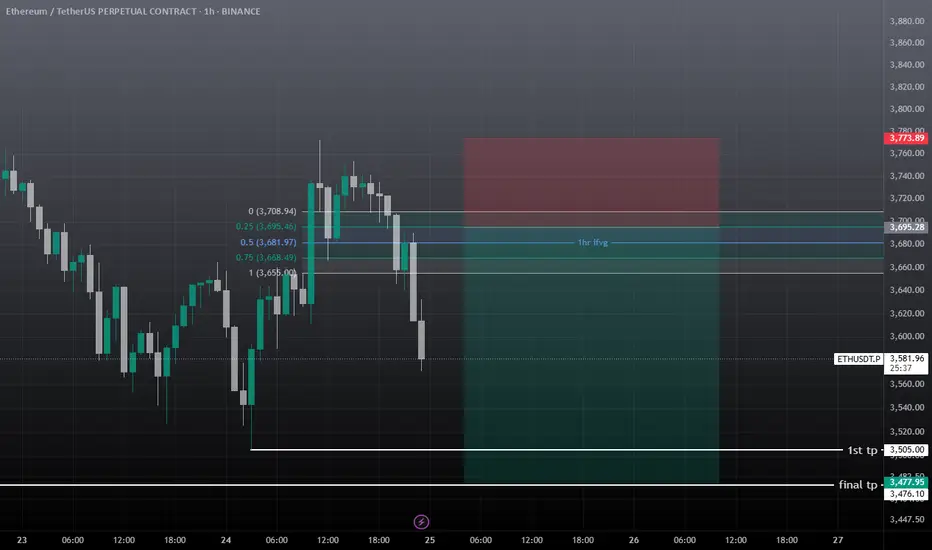
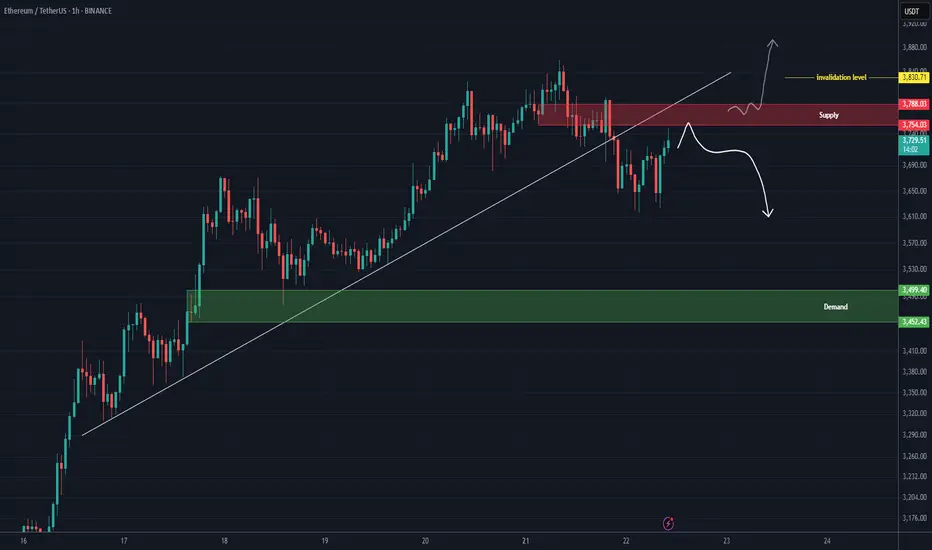
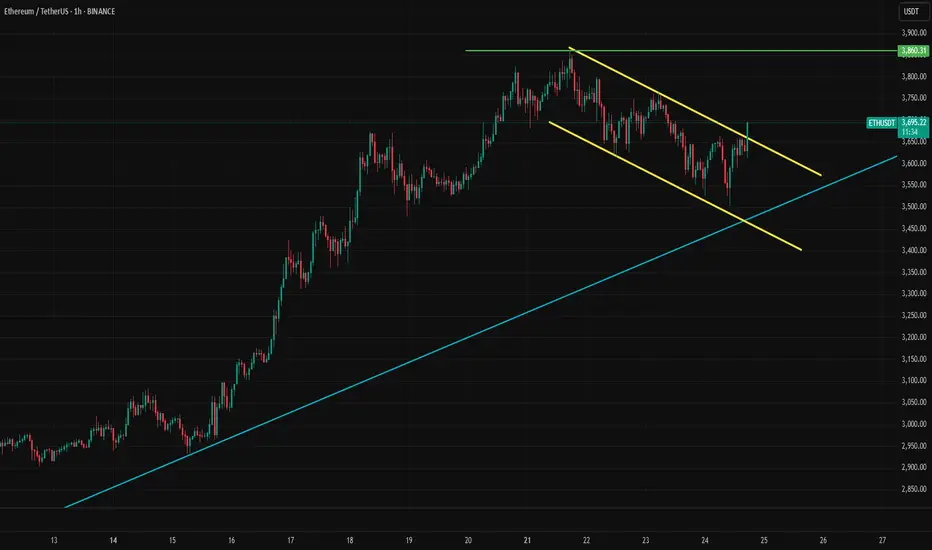
ETH analysis (1H)A trendline has been broken, and a resistance zone has formed on the chart. As long as Ethereum fails to hold above the red zone, the price may experience a drop.
The green box can be considered the target.
If the price stabilizes above the red zone and a daily candle closes above the invalidation level, this analysis will be invalidated.
For risk management, please don't forget stop loss and capital management
Comment if you have any questions
Thank You
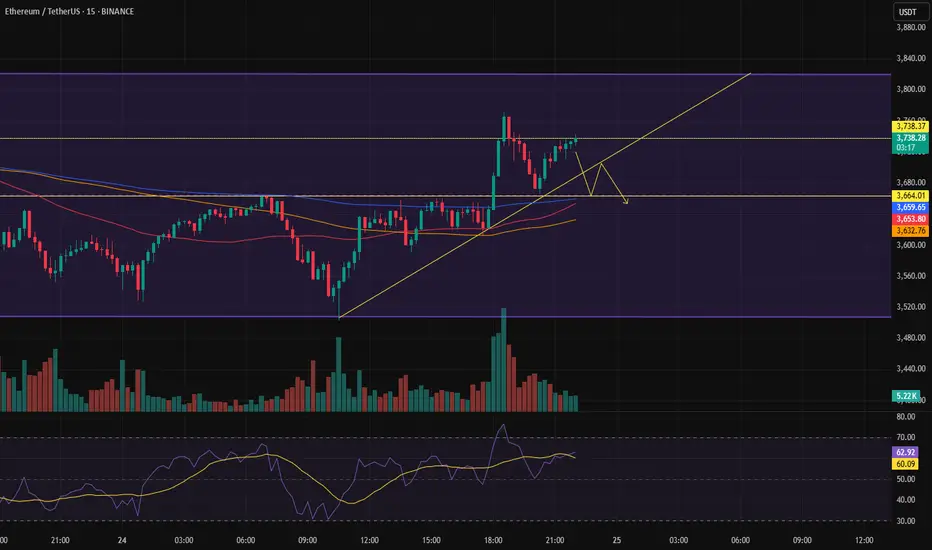
$ETH | Ready to fly (Inverted head and shoulders)BINANCE:ETHUSDT.P
On 1H TF, the price is forming inverted head and shoulders pattern, which is a strong bullish pattern.
The price has retested the trendline support and bounced back.
Expecting it to breakout above yellow line soon.
A breakout above the yellow line will be a bullish and pattern confirmation.
We can initiate a long entry from here.
Please do proper risk management and must use stop loss.
NFA, DYOR

ETH ~ Receive more than you expect!Such nice momentum to see but buys at red! but always place to limits to take those buys!
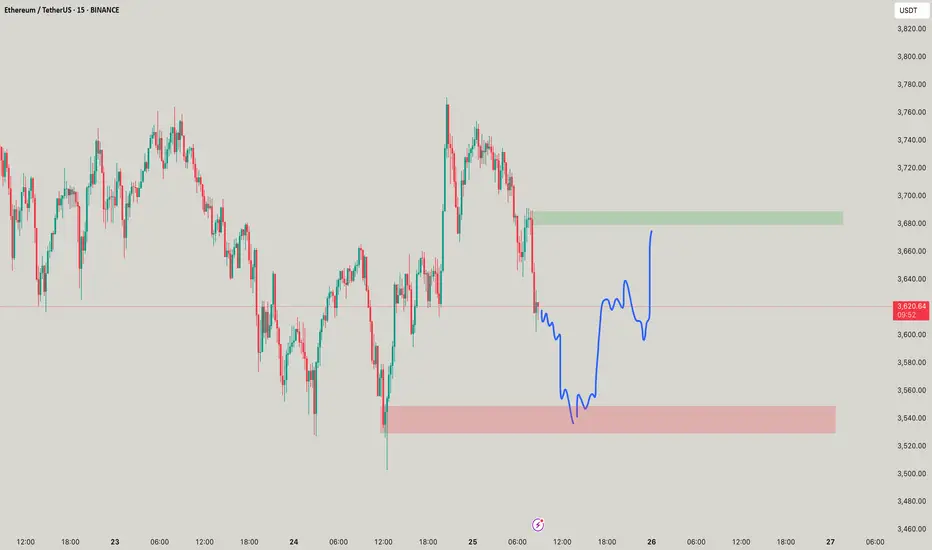
Sell opportunity?If the trendline breaks in the lower timeframe, a short position can be taken down to the bottom of the channel.**
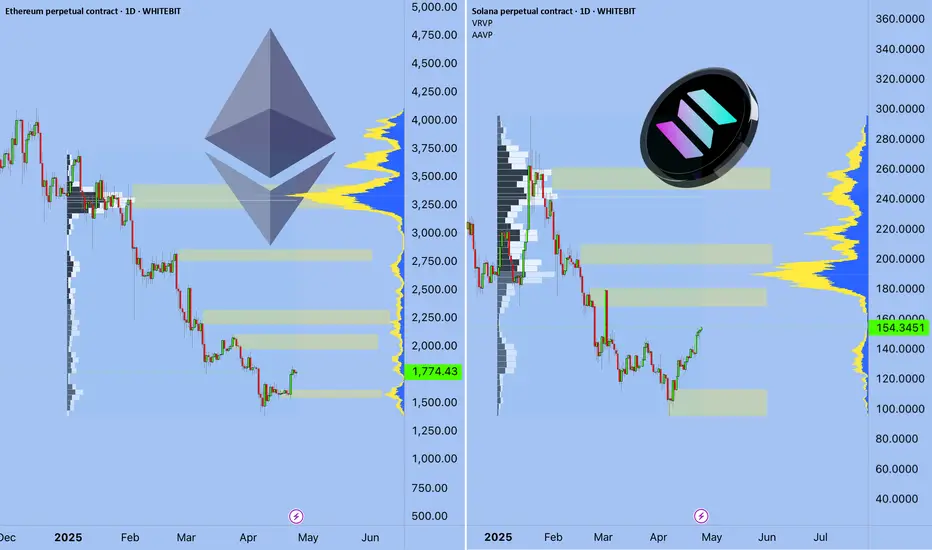
Ethereum vs SolanaIn 2025, the competition between Ethereum and Solana is no longer just a rivalry — it’s a pivotal chapter in blockchain evolution.
We are witnessing a clash of two philosophies:
Ethereum — maturity, security, and deep ecosystem
vs.
Solana — speed, efficiency, and adaptability.
📈 Price Resilience vs. Market Legacy
While Ethereum still holds the crown in market cap and institutional trust, Solana is rewriting the rules with superior transaction speed and cost-effectiveness.
The question is no longer "Who is better?"
It’s "Who is evolving faster?"
⚡ Key Drivers Shaping the Ethereum-Solana Rivalry
1️⃣ Scalability vs. Stability
Solana leads with up to 65,000 TPS, attracting high-frequency traders, NFT creators, and DeFi innovators.
Ethereum, relying on its Layer-2 solutions, tries to balance security with scalability.
2️⃣ Institutional Shifts
Funds like Galaxy Digital and Ark Invest are reallocating capital towards Solana, betting on efficiency and growth.
Ethereum, meanwhile, is waiting on ETF approvals to regain momentum.
3️⃣ Technological Innovation
Ethereum focuses on sharding and Layer-2 expansion.
Solana pushes aggressive ecosystem growth but pays the price with occasional network instability.
📊 Market Performance Snapshot — 2025
Ethereum: ▼ 56% YTD | ~$1,600
Solana: ▼ 40% YTD | ~$135
Solana’s DEX market share jumped to 39.6% in Q1, driven by meme coins and retail traders.
Ethereum’s dominance continues to erode under macro pressures and rising competition.
But don’t be fooled — Ethereum's foundation remains strong. Institutional adoption and infrastructure upgrades still offer potential for a rebound.
📉 ETH/BTC Looks Like a Meme
ETH/BTC:
SOL/BTC: Potential -50% in next 160 weeks ➡️
ETH/SOL:
⚡ Where Did the Liquidity Go?
The real question isn’t why ETH is dropping —
It’s why no one cares.
Layer 2 solutions — Arbitrum, Optimism, Base — have drained liquidity from Ethereum’s mainnet.
DeFi activity? → Migrated to L2
Users? → Choosing lower fees and speed
Ethereum L1? → A blockchain for whales and archives
No liquidity = No rally
No narrative = No attention
Funds are betting on Solana and L2, not Ethereum’s base layer.
🎯 When Could ETH Take Off?
Only if we see:
A strong “Liquidity Returns to L1” narrative (RWA could be a trigger)
Spot ETH ETFs launching with institutional accumulation
A new DeFi wave on L1 (unlikely with current gas fees)
Or simply — when the market decides to pump forgotten assets
For now, Ethereum is about patience.
Smart money is flowing into L2, Solana, and high-risk narratives.
🕒 But Time Will Tell...
Today, we debate ETH vs. SOL.
Tomorrow — the bull market ends, and we’ll be discussing entirely different narratives.
Are you SOL or ETH?
As always, stay one step ahead.
Best regards,
EXCAVO
______________________________
Disclosure: I am part of Trade Nation's Influencer program and receive a monthly fee for using their TradingView charts in my analysis.
SELL ETH 25.7.2025Reversal trade order: SELL at H1~M15
Type of entry: Limit order
Reason:
- Candle creates reverse number 1 model
- The bottom hasn't touched any peak yet (meaning it hasn't reached a strong reversal zone)
Note:
- Management of money carefully at the price of bottom of M5 (3,716)
Set up entry:
- Entry sell at 3,751
- SL at 3,776
- TP1: 3,716
- TP2: 3,670
Trading Method: Price action (No indicator, only trend and candles)

Huge Bear Trap next in line??Ethereum Exit Queue: 518,180 ETH
Half a million ETH is currently queued for unstaking on Ethereum...
Keep in mind, August 1st, Trump's Reciprocal Tariffs get in effect
Everyone's talking about BTC's new ATH, ETH's rally, XRP new ATH, but no one is talking about August 1st...
Manipulation is taking place. Stay safe, because a huge bear trap might be next in line (BTC back to 90K)
*NOT INVESTMENT ADVICE*
#crypto #ethereum #eth #btc #bitcoin #trading #xrp #trump #tariff #finance #economy
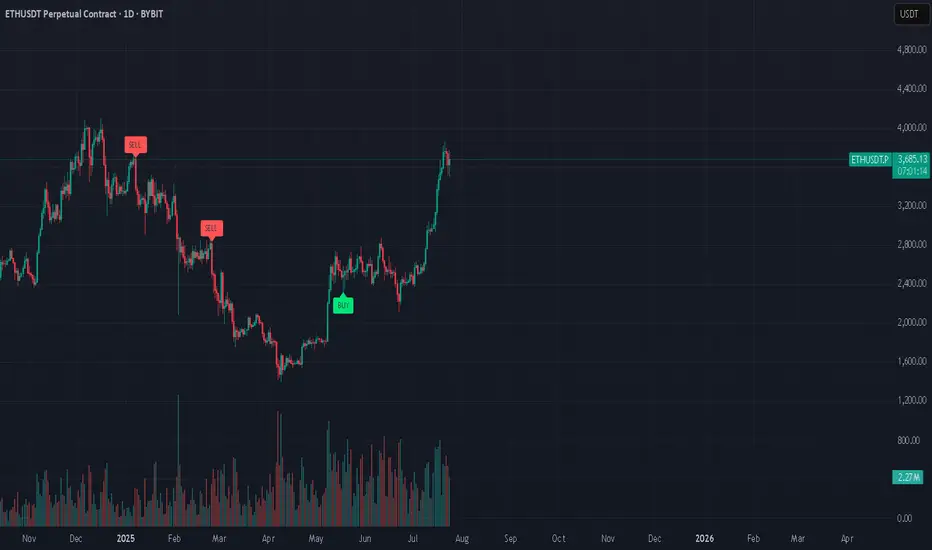
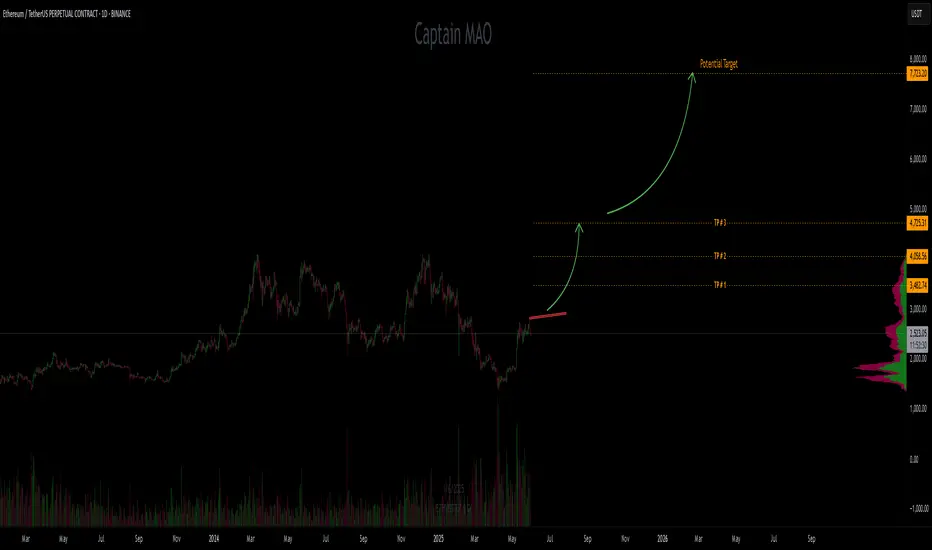
Why Ethereum Will Continue Growing · Trading Above ResistanceEthereum started its latest bullish on the 9th of April. Each advance has been preceded by a period of consolidation.
ETHUSDT (Ether) recovered from its bottom range 23-April, immediately it went sideways for 14 days before moving forward (1). As soon as Ethereum reached $2,700, we have the same pattern but extended, more sideways before moving forward. See this as (2) on the chart. This time the consolidation period lasted 57 days.
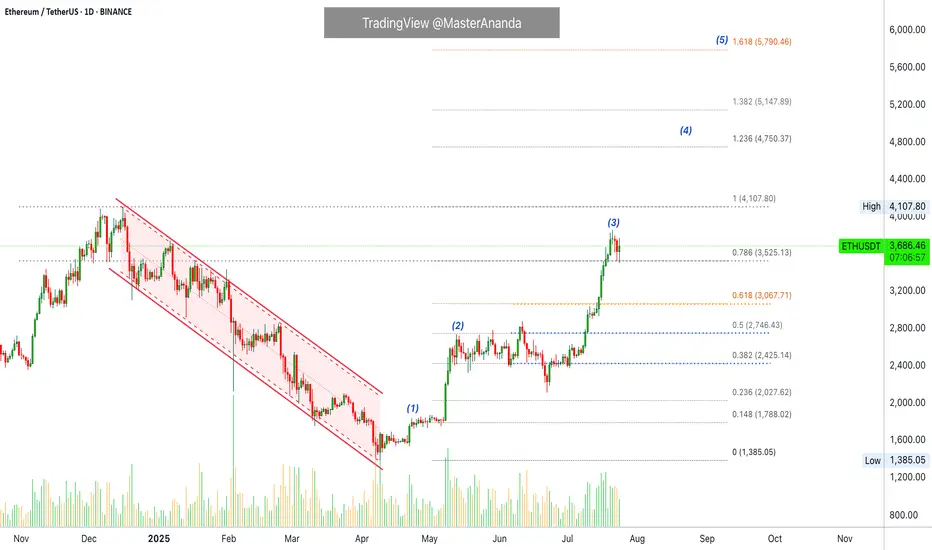
The last advance was even stronger (3), Ethereum peaked at $3,860 and we can expect another sideways period, a pause, repeating the same pattern as before. Now, there is an interesting part. The first is a prediction: This consolidation period wont be as long as the second one. The second is related to resistance and support. Notice how ETHUSDT peaked above 0.786 Fib. and this level is being tested as support. The fact that bullish action managed to conquer this level and stop above it, not below, favors the bulls. This means that the market is strong and set to continue growing. There is no significant bearish volume on the red days and the action is neutral so we can expect an advance; the next high will be a new all-time high. We will name it (4) on the chart.
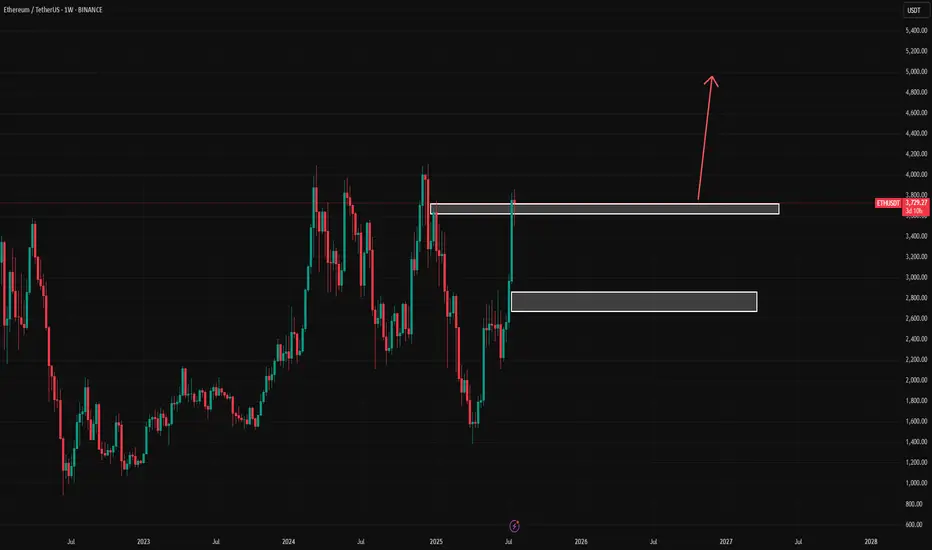
This price pattern should repeat giving us additional growth. After a new all-time high, there will be resistance shy of 6K. And then we expect higher prices with Ethereum peaking around $8,500. Depending on how this level is handled, we can look for $10,000 or even $11,000.
Right now the chart is bullish and points higher.
Continue to hold long-term. It is still too early to fold; it is too early to sell. We are going higher.
Thank you for reading.
Namaste.
Ethereum will retest $3,500 ┆ HolderStatOKX:ETHUSDT bounced from $2,875 and is approaching $3,100. Breakout may target $3,250 next. Bullish structure remains.
ETH/USDTHello friends, my analysis for Ethereum is bullish and I think it will continue its recent gains. What do you think?
Ether is About to Break the FlagETH is making an attept to break flag formation. 3860 top could be the short term target for upward moves. Over the medium term, 4100 could be the main target. Our bull cycle top target is 6830 for the moment. This was a quick update,please check our earlier post for details.
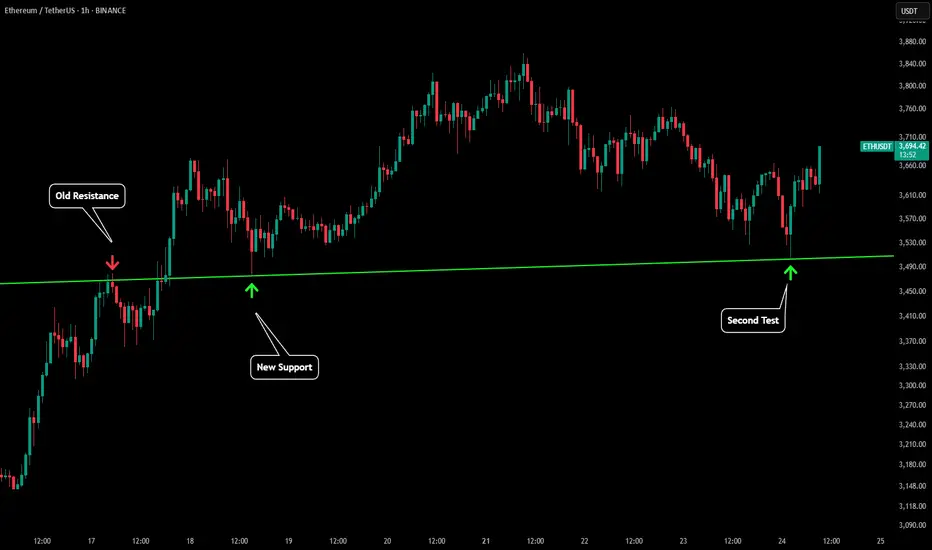
ETH - Perfect Test & BounceTo fully understand this post you will need to refer to our 3 previous posts. Here is the play by play of chart analytic mastery.
In this first post we made almost 2 weeks ago we outline "ETH'S CRAZY IMPORTANT LINES". In this post there were a lot of lines drawn and what we were saying was ETH was about to have a 20%+ rally to test the green trendline that we labeled "WATCH TRENDLINE".
Then we made an updated post titled "ETH - CHARTS DONT LIE" once price had teleported to our green trendline. This was establishing our green trendline as a very key level.
Once price had broken above the green trendline we made a post titled "ETH - PULLBACK INCOMING". What we said was ETH was likely to have a pull back that would bring us back to the green trendline marked "first support".
Fast forward 3 days and to the exact dollar price tested the green trendline and has seen a solid bounce so far! Hope you have been able to follow the incredible technical provided in real time by Viaquant!