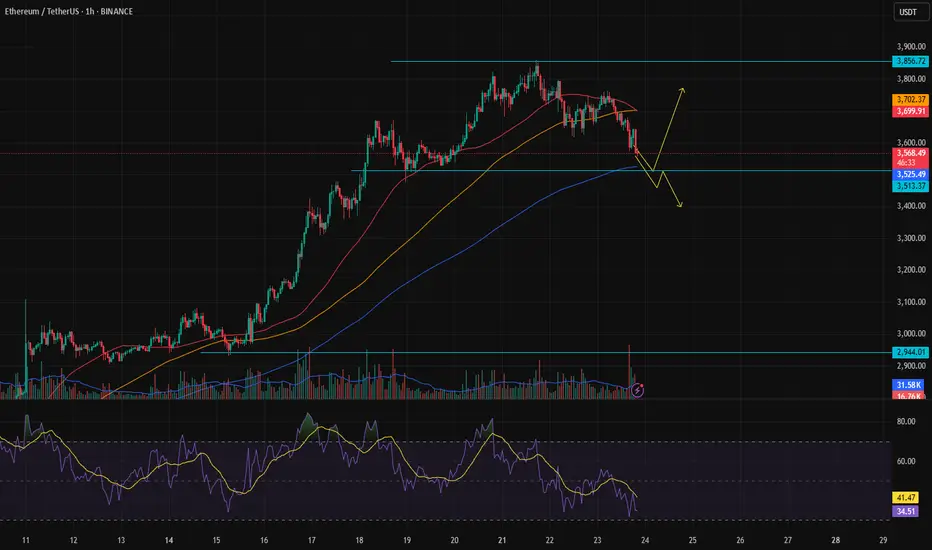
ETH Just Lost Key Support — Next Stop: $2,879?Ethereum (ETH) appears to be losing steam on the 4-hour chart as it fails to sustain above the critical $3,860 resistance level. After a strong rally, the price structure has started showing signs of exhaustion — the previous bullish momentum has clearly stalled, and ETH is now forming lower highs and lower lows. This breakdown marks a potential shift in trend, especially considering the clean rejection from $3,860 with several upper-wick rejections signaling aggressive selling pressure.
The green ascending trendline, which supported ETH throughout its recent rally, has been breached. Price has broken below the trendline and is now moving in a declining structure highlighted by the recent bearish wave. Sellers have stepped in, and the most recent candles indicate a bearish continuation setup forming just below a failed support-turned-resistance near $3,533.
There’s a visible trade setup taking shape:
• Entry: $3,530–$3,550 (post-retest of broken trend support)
• Stop-loss: $3,650 (above recent local highs)
• Target 1: $3,200 (key support level)
• Target 2: $2,879
• Target 3 (extended): $2,635 if downside pressure intensifies
This short setup offers a solid risk-reward ratio, especially if momentum accelerates below $3,500. The sell signal seen earlier aligns with this potential reversal zone, and unless ETH reclaims $3,650 with volume, the bears look likely to stay in control.
In summary, ETH on the 4H timeframe is now trading below major support, with a bearish structure, trendline breakdown, and rejection at resistance — all aligning for a short-biased move in the coming sessions. Any bullish invalidation would require ETH to push and close above $3,650 convincingly. Until then, the path of least resistance appears downward.
ETHUPUSDT trade ideas

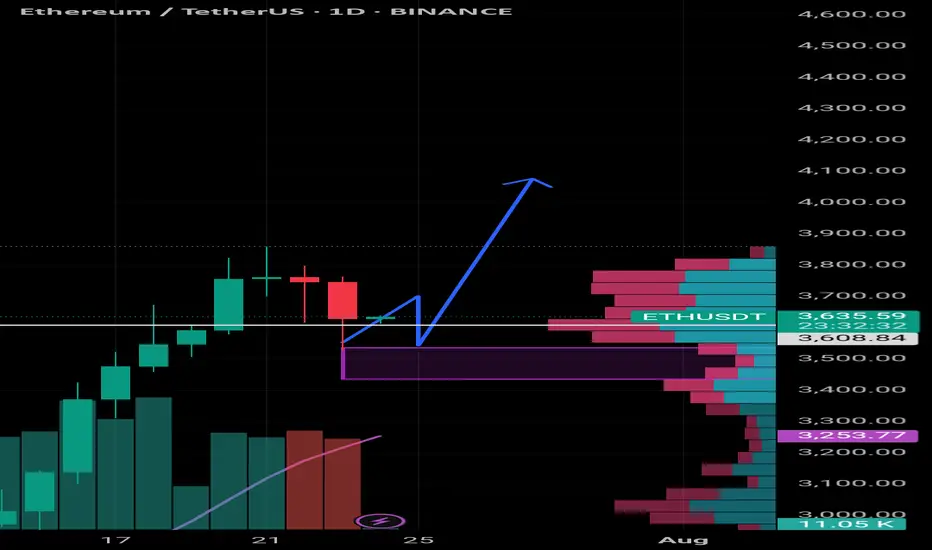
Ethusdt buy / long setupEth has a good pullback yesterday. Eth showing strong momentum against all the market. Long at cmp 3641, first tp is 3960 the next is 4.1k. must use sl.

Ethereum (ETH) has taken the lead in the crypto market, surpassiEthereum (ETH) has taken the lead in the crypto market, surpassing Bitcoin."
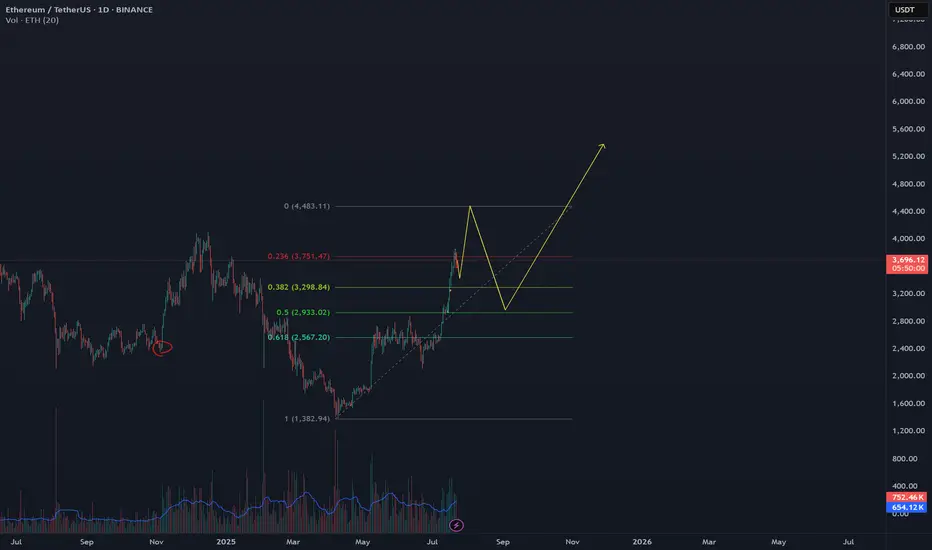
ETH - 5500 USD in the short-term (Banks and states buying!)ETH is pumping, and altcoins with it. That means we are in an alt season, which I predicted in the previous post here on July 9, before the pump:
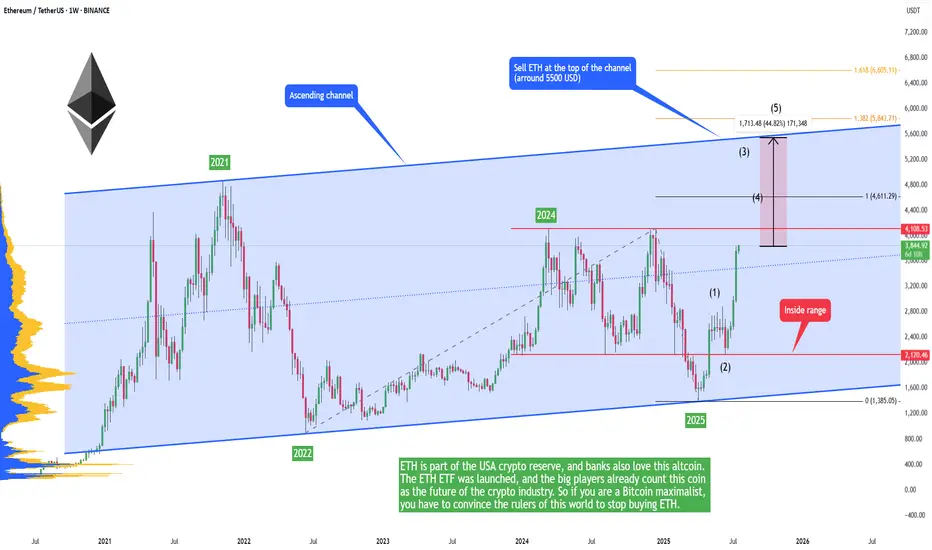
ETH is part of the USA crypto reserve, and banks also love this altcoin. The ETH ETF was launched, and the big players already count this coin as the future of the crypto industry. So if you are a Bitcoin maximalist, you have to convince the rulers of this world to stop buying ETH.
But we are here to make money; we don't care about the crypto technology, which is too restricting anyways. Worse than paper money or fiat or gold. Let's be honest, if there were no charts and no trading on cryptocurrency, no one would even talk about it, and the government would silently integrate this technology.
So I am very bullish on ETH in the short term, because the price is inside this ascending channel and is breaking out with strong bullish momentum. Of course you don't want to buy the top and sell the low. We are somewhere in the middle, so if you buy now, sell at 5500 USDT. This is where the market will most likely stop for a long time before going higher.
We are in an alt season because BTC.D is going down! That means some altcoins can 10x or 50x in the next weeks. This is very important - Write a comment with your altcoin + hit the like button, and I will make an analysis for you in response. Trading is not hard if you have a good coach! This is not a trade setup, as there is no stop-loss or profit target. I share my trades privately. Thank you, and I wish you successful trades!
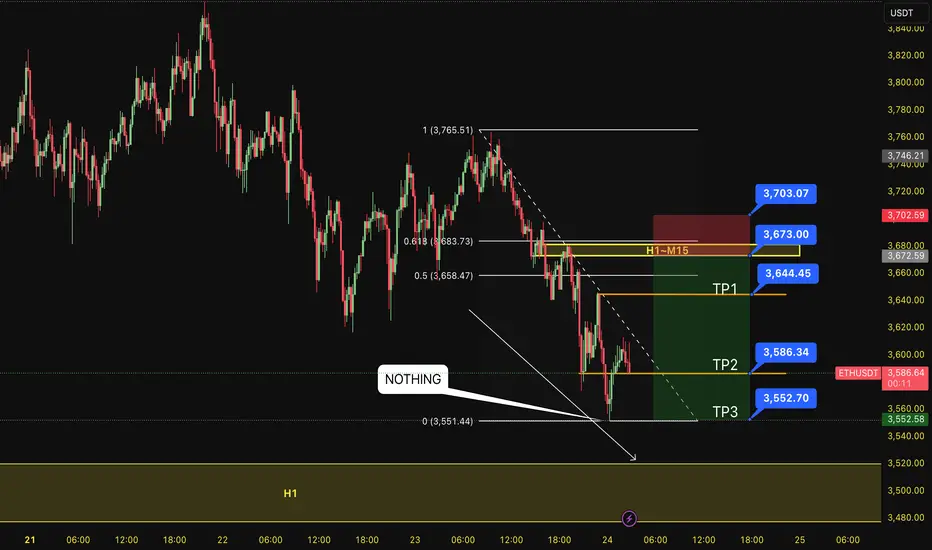
SELL ETH 24.7.2025Confluence trade order: SELL at H1~M15
Type of entry: Limit order
Reason:
- The bottom doesn't touch anything. It is expected to continue to decline into H1.
- Keylevel H1~M15~FIB 0,5-0,618
Note:
- Management of money carefully at the price of bottom (3,644)
Set up entry:
- Entry sell at 3,673
- SL at 3,703
- TP1: 3,644
- TP2: 3,586
- TP3: 3,552
Trading Method: Price action (No indicator, only trend and candles)
ETH risk of further downside moves 1HR chartIf ETH breaks $3539, could see a further drop to next support. This is short time frame, the bigger Macro trends are still in tact.

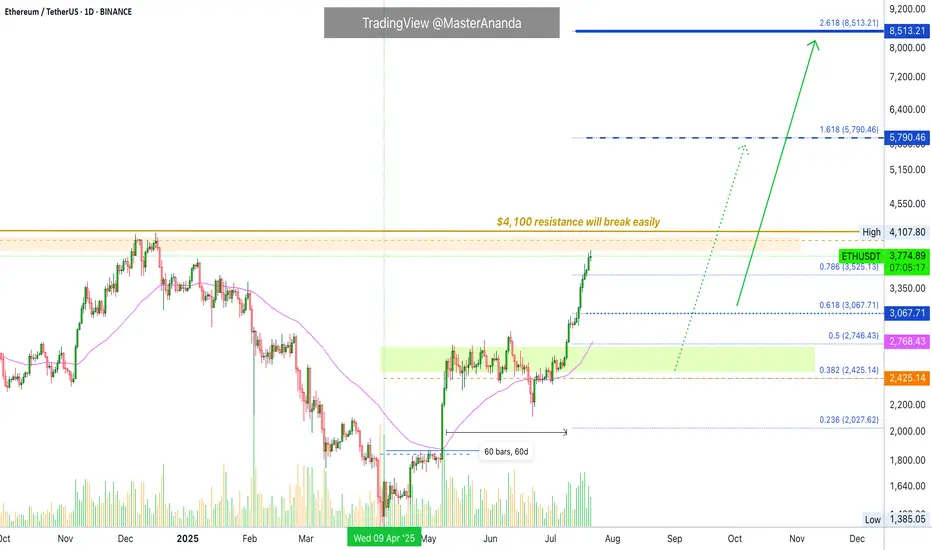
How far will the drop go?Ethereum is currently in a downtrend, and so far we don't see any signs of a reversal yet.
But let’s not forget that in the higher cycle, the trend remains strongly bullish.
Now you may ask — when is the best time to buy Ethereum?
3500? Or 3400?
We need to wait a bit to get more confirmations before answering that.
I’ll share the best buy zone with you soon in the near future.
Good luck!
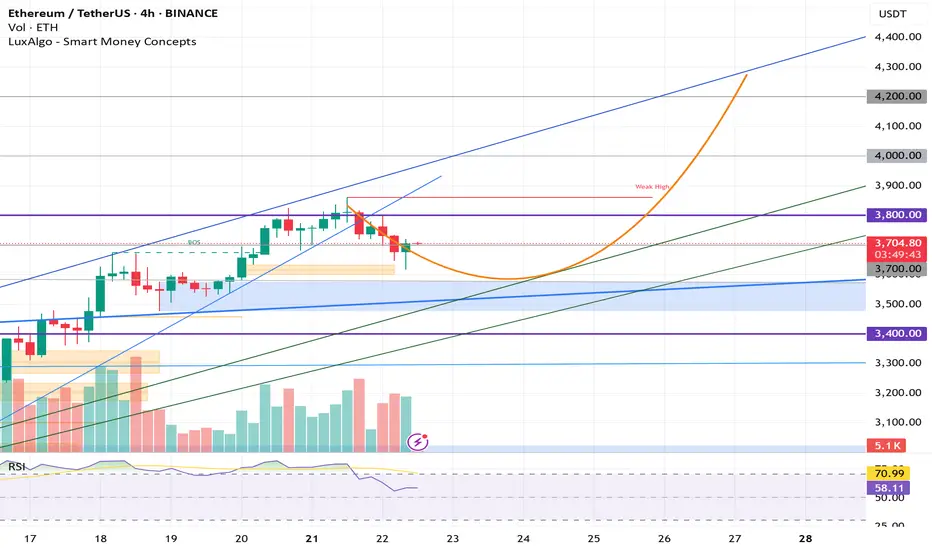
ETH in correction mode. But only for a while!As a result of breaking the previous biggest resistance of CRYPTOCAP:ETH , this was predicted to require a correction and range. However, Ethereum is expected to start breaking 4200 as soon as we anticipated.
ETH Short PositionHi
This is good zone for ETH correction , it's my personal idea and not trading advice.
please manage your risk .:)

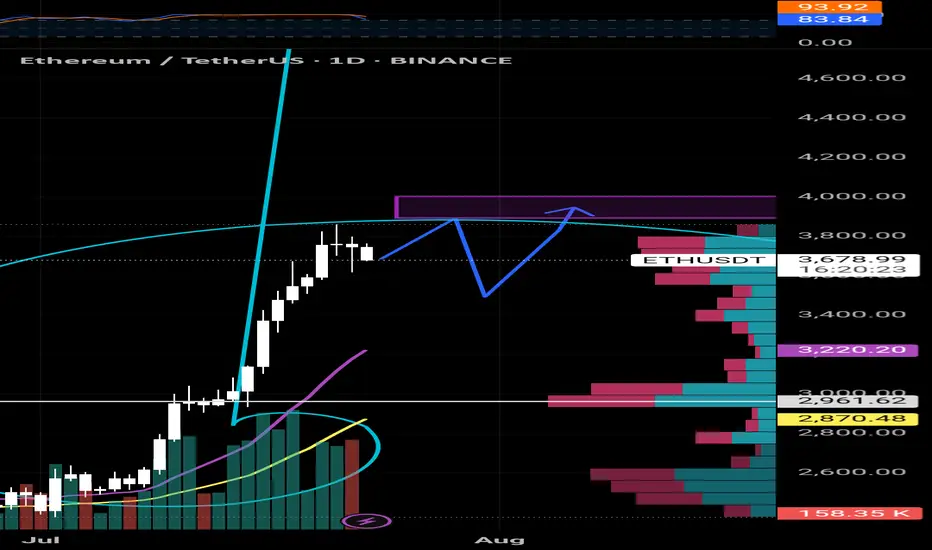
Ethereum Update · Minor Break Below $4,000, Nothing ChangesOk. Straight up has been confirmed but as you already know, the market never moves straight down neither straight up. It seems Ethereum is about to take a small break. This shouldn't alarm you nor be a concern, we are set for sustained long-term growth. When bullish momentum dies down, the market tends to take a break, a pause, before additional growth.
Please remember that these breaks are very tricky, they can last just a few days, say 3-6 days, just as they can go for weeks. It is very hard to predict. In fact, we don't try to predict the duration of those, we simply focus on the bigger picture and know that a new all-time high will be hit in the coming months. This new all-time high will be followed by additional growth.
The short-term can be tricky though. Ethereum will continue rising, but watch out, it can make a pause and this time can be used wisely to profit beautifully from smaller altcoins. Don't let your capital just sit around when it can grow.
Ethereum is awesome but it is also a giant. The smaller altcoins is where the true opportunities lie. The opportunity to quadruple in a matter of months. And this process can be repeated several times for the duration of the bullish cycle.
Namaste.
ETHUSDT SCALP SESSION SMC Analysis | Liquidity Sweep → IMB/OB Reclaim | Long Setup
Price action shows a clear sweep of Buy-Side Liquidity (BSL) above previous highs, followed by a sharp rejection and move downward. Liquidity was collected both at the top (BS Liquidity X) and below (Sell Side Liquidity ✓), confirming a classic liquidity grab setup.
Price is currently retracing into a Fair Value Gap (FVG) and approaching the zone marked as Real IMB and OB, indicating a potential high-probability reversal area.
Key confluences:
✅ BSL taken
✅ SSL taken
🕳 IMB Liquidity filled
📉 Pullback into FVG
🎯 Anticipating reaction from the OB zone (~3620) for a long continuation.
This setup targets a return toward previous inefficiencies and liquidity pools around 3694–3867. Entry confirmation required inside the OB zone or on lower-timeframe structure shift.

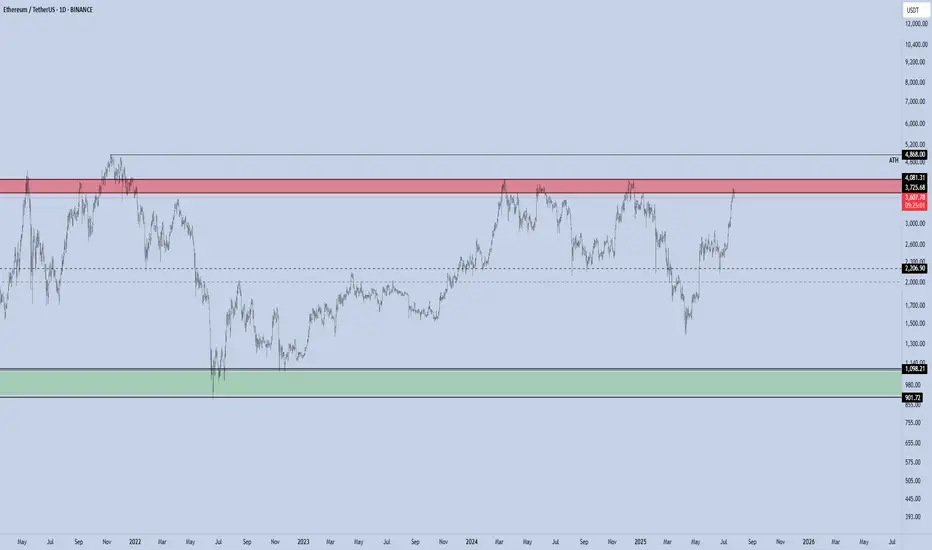
ETH - Altseason ??ETH has rallied sharply and is now entering the major resistance zone between $3,725 and $4,081, which has repeatedly acted as a local top during previous cycles.
This red zone represents a high-supply area, and historically ETH has struggled to break and hold above it without a significant catalyst.
Rejection here could lead to a pullback toward the $2,300–$2,000 range.
A clean breakout and weekly close above $4,081 would flip this resistance into support and open the path toward the all-time high (ATH) at $4,868.
If ETH reclaims this red zone and flips it to support, it will act as a major trigger for a broad Altseason.
Historically, such ETH strength is a key confirmation that capital is rotating from BTC into the altcoin market.
Currently, momentum is favoring bulls unless this red supply zone causes a strong rejection.
Ethereum Ready for Breakout Above $3850?📊 Ethereum Quick Analysis | Breakout or Breakdown?
✅ As long as ETH stays between $3400 - $3600, the bullish outlook remains intact.
🚨 A confirmed close below $3200 could mark the end of the bull market.
🚀 A clean, shadowless candle close above $3850 may push price toward $4100.
⚠️ However:
📉 Expect retail sell-offs around those highs
💸 But heavy institutional buying could send ETH to $6230 in the short term.
🔥 Altseason is officially here — get ready for explosive moves!
🎯 I'm here to track and update all major targets in real-time 💥
#BullRun#altseason#ETH

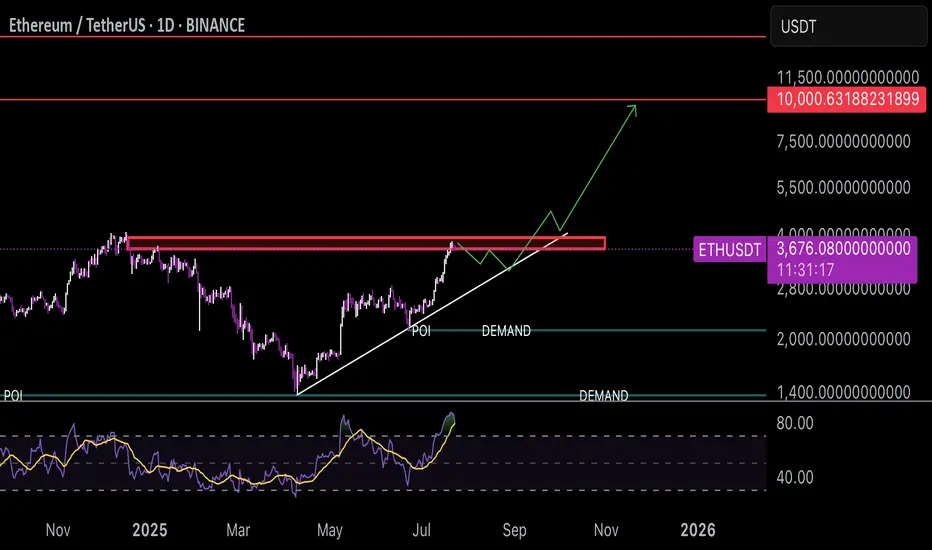
EthFor a technical analysis of the provided ETH/USDT 1D chart, here are the key points:
1. **Current Price and Changes**: The current price is around 3,672.23 USD, down 1.99% (74.54 USD) from the previous day.
2. **Support and Resistance Levels**:
- **Resistance**: Near 3,672.24 USD (current SELL level), marked by the red line.
- **Supports**: Demand levels around 1,800 and 40 USD indicate potential support zones if the price drops significantly.
3. **Trend and Direction**: An upward trend line from the chart's bottom to the current point suggests an overall bullish trend, though the recent break below the resistance line may indicate weakness.
4. **Indicators**:
- The POI (Point of Interest) line near 3,672 USD highlights a key level where price is fluctuating.
- The lower indicator (likely RSI or similar) shows price oscillations, currently in a neutral zone with no clear buy or sell signal.
5. **Short-Term Outlook**: If the price fails to stabilize above 3,672 USD, it may move toward lower demand levels (e.g., 1,800 USD). A breakout and stabilization above resistance could target 10,000 USD (based on the upward trend line).
For a more detailed analysis, consider adding indicators like MACD or Bollinger Bands. Would you like me to create a visual chart in a separate panel?
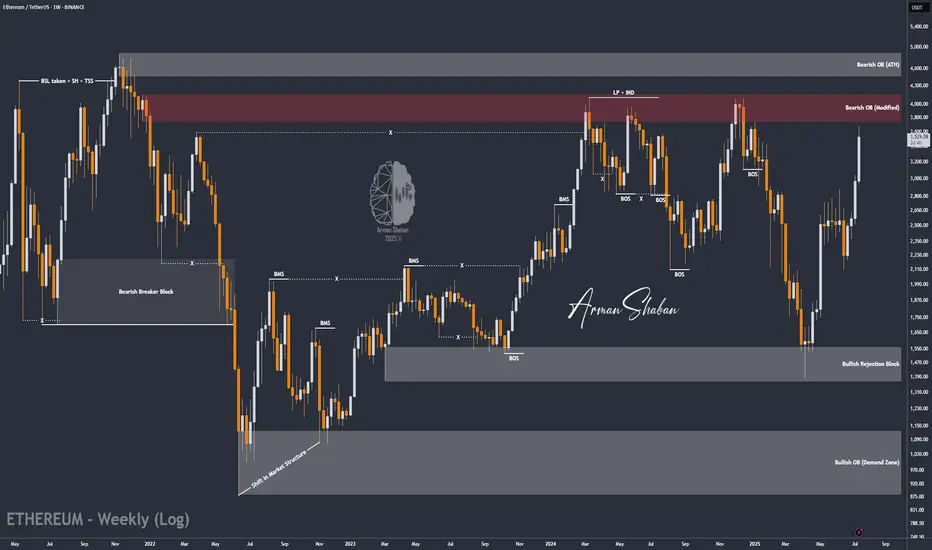
ETH/USDT | The Next Target is $4000 and it's Close! (READ)By analyzing the Ethereum chart on the weekly timeframe, we can see that this cryptocurrency remains one of the strongest major cryptos in the market, continuing its bullish rally despite the overall market correction. It has already hit the next target at $3500, and I believe we might see Ethereum reaching $4000 sooner than expected! Based on previous analyses, if this bullish momentum continues, the next targets will be $3740, $4100, and $4470.
Please support me with your likes and comments to motivate me to share more analysis with you and share your opinion about the possible trend of this chart with me !
Best Regards , Arman Shaban
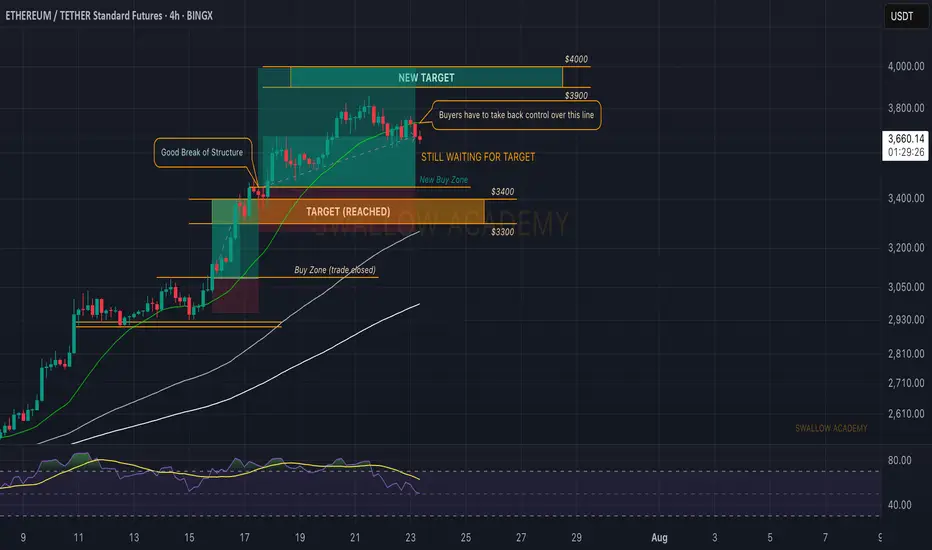
Ethereum (ETH): Bollinger Bands Middle Line Has Been Broken!Well, buyers have to take back the control over the middle line of BB in order to see further movement to upper zones from the current market price.
This is one crucial zone, as upon sellers taking dominance here, we will most likely fall back closer to our entry point here.
But even after that, we still will be expecting the $400 area as our major target (psychological target) will be reached with time so we wait patiently!
Swallow Academy
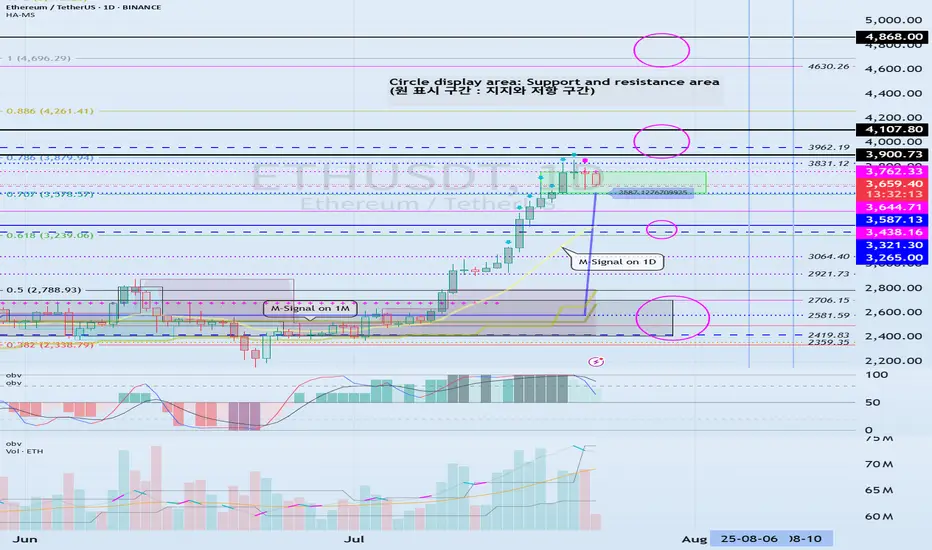
Check if HA-High indicator is forming at 3587.13
Hello, traders.
If you "Follow", you can always get the latest information quickly.
Have a nice day today.
-------------------------------------
(ETHUSDT 1D chart)
HA-High indicator is showing that it is about to form at 3587.13.
Accordingly, if the HA-High indicator is newly created, the support in the 3587.13-3762.33 section is an important issue.
If it falls below 3587.13, it is likely to touch the M-Signal indicator on the 1D chart.
Therefore, we should check whether it touches the area around 3265.0-3321.30 and rises.
-
This can be seen as a time to test whether it will continue the first step-up trend while rising in the important section of 2419.83-2706.15.
ETH's volatility period is around August 6-10, but we should check what kind of movement it shows after passing the volatility period of BTC.
-
Thank you for reading to the end.
I hope you have a successful transaction.
--------------------------------------------------
- This is an explanation of the big picture.
(3-year bull market, 1-year bear market pattern)
I will explain more details when the bear market starts.
------------------------------------------------------
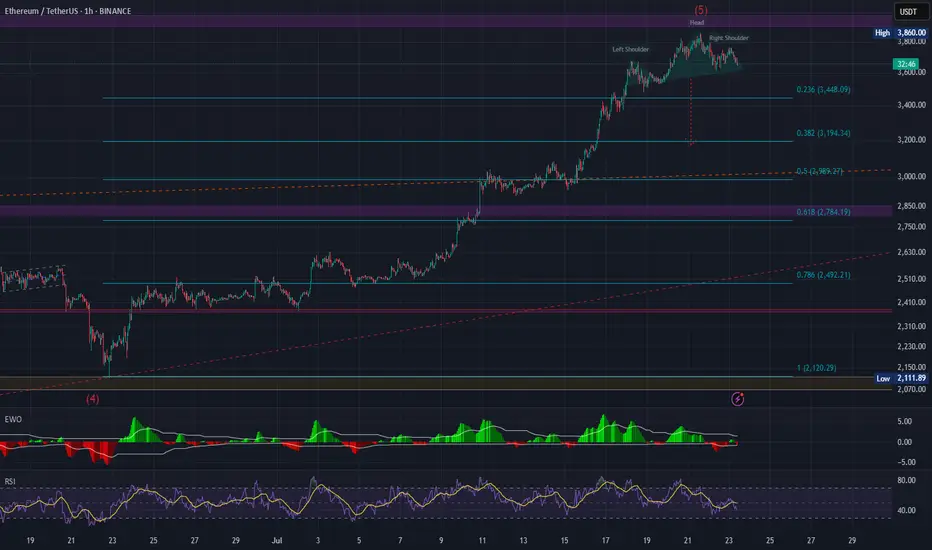
H&S formation at 1H chartETH/USDT almost completed formation of H&S patern at 1H chart. If neckline will be broken it's mean Elliot wave completed and we can expect deep correction. Also RSI divergence confirming this reversal
Ethereum Breakout Could Spark the Next Altseason!A Massive Altseason Is Brewing… 🚀
Ethereum just flashed a major monthly breakout after printing a clean Morning Star reversal right at key support.
Now it's pushing against the upper resistance zone, a structure that held it back for over two years.
If CRYPTOCAP:ETH breaks and closes above this level, it won’t just be bullish for Ethereum — it could ignite the biggest altcoin season since 2021.
Why it matters:
📌 ETH is the heart of the altcoin ecosystem.
📌Historical breakouts like this led to 1500%+ moves.
📌The pattern and price action are lining up perfectly again.
Once Ethereum breaks cleanly above $4,000, expect altcoins to explode across the board — Layer 2s, DeFi, AI tokens, and even the meme coins could all start flying.
Keep your eyes on ETH. Its breakout is the spark… the altseason fire is coming.
DYOR | Not Financial Advice

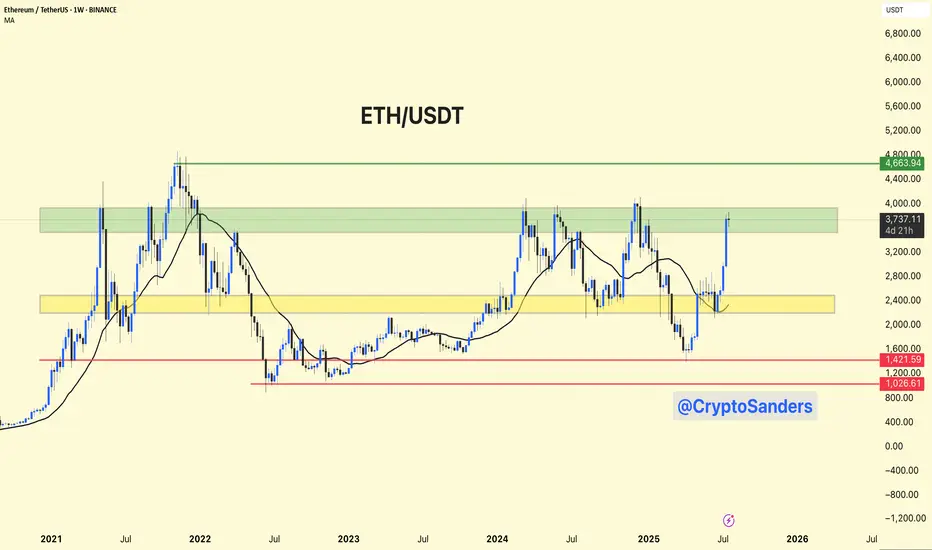
ETH/USDT – Weekly Chart Analysis !! ETH/USDT – Weekly Chart Analysis
ETH is testing a major historical resistance between $3,700 – $4,000 (highlighted green zone).
A clean breakout above this level could push price toward the next key resistance at ~$4,660.
Previous accumulation zone around $2,400 – $2,800 (yellow box) now acts as strong support.
Long-term floor at $1,420 and $1,025, though currently far below.
Bullish Breakout Potential: If ETH sustains above the green resistance, it may retest $4,660+.
A failure to break above $4K could lead to a healthy pullback toward the yellow zone (~$2,800).
Stay updated and manage your risk accordingly.
DYOR | NFA
ETHS Swing long to $4100Just now opened a swing long position on eth...though looking at it from the 4hr kinda looks like it might get hit today or tomorrow....that be awesome
Playing it conservative.
Stop is below prior week low at $3580
The prior week closed with little top wick rejection with big strong body. Daily also close similar . 4hr and 1hr tend is also aligned so basically all trends align from weekly to 1hr which stacks the odds significantly in our favor.
And fundamentally there has been a lot of talks about Etereum.. Lets see how it goes.
Roughly 2.42 RR. I did size up to like 4 times my usual risk.

gold vs ethIf we follow this fractal, we should top around $4k and then a pullback to $3k followed by news highs in Q4