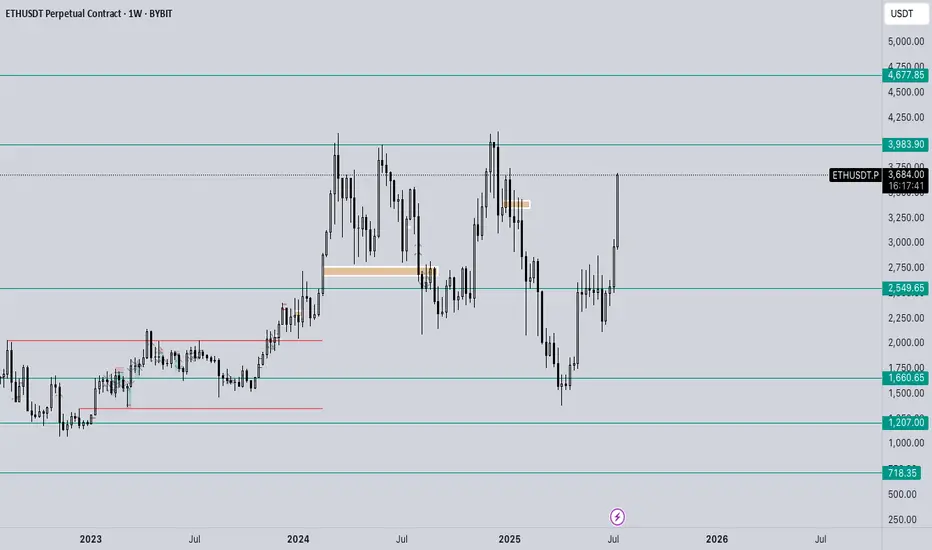
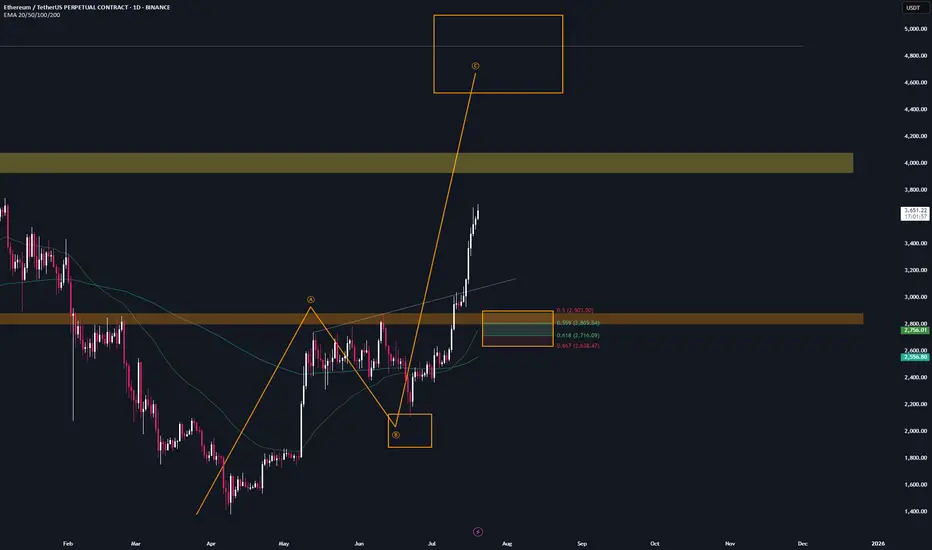
Ethereum LONG The Power of 3!
Letsgooo 10K!
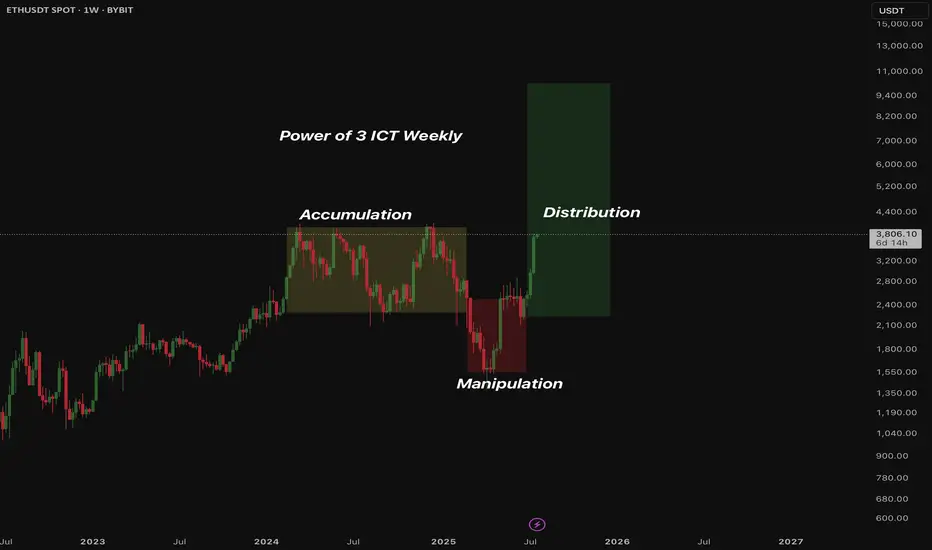
On the daily we've seen a power of 3 ict played out.
Now on the Weekly chart.
ETHUPUSDT trade ideas
ETH Approaching Major Resistance — Watch for Range High Deviatio
ETH has rallied strongly and is now testing the range highs around $4,100.
The most likely scenario is a direct tap or wick above the range highs — this is a classic spot where the majority expects continuation, but also where deviations (fakeouts) frequently occur.
If price closes above and holds, it could trigger further upside. However, the risk/reward (RR) for fresh longs here is not attractive after such an extended move.
A deviation above range high (quick push above, then close back inside) is possible and would be a bearish signal in the short term.
After this wave, any deep dips in ETH will likely be a high-conviction buy, given the strong bullish momentum.
ETH is showing extremely bullish momentum as it approaches a major weekly resistance at the range high. The obvious play here is a sweep or break of this level, but with the move being so extended, a deviation or fakeout becomes increasingly likely. While momentum is still up, waiting for a dip or failed breakout (deviation) is a better risk/reward play than chasing longs here. Any meaningful pullback will likely present an excellent buying opportunity given the macro strength.

Ethereum (ETH): Too Good To Be True | We Are Close To $4000Ethereum is very close to the $4000 zone, which is both a psychological zone (thanks to it being a round number) and a major resistance zone for us currently.
What we see is simple: movement to that upper resistance zone where we expect to see some smaller rejection, eventually a breakout, and further movement to upper zones towards the new ATH.
Swallow Academy

ETHUSDTOn the daily time frame, Ethereum is in the last dance and is in the distribution to form its last ceiling.
BINANCE:ETHUSD BINANCE:ETHUSDT
aram pishbin

Ethereum (ETH): 2/4 Targets Reached | $4000 Incoming Ethereum has been outperforming BTC in every way; since our entry on this trade, we have had 112% movement, and soon our third target is going to be hit.
As mentioned, $4000 is our next target, where we are expecting to see some kind of strong rejection due to the round number, where usually a lot of liquidity is sitting.
So currently we are aiming for $4K and once we are there, we will be monitoring the markets to see if we will expand further or go into a smaller correction!
Swallow Academy
Ethereum to 4k$CRYPTOCAP:ETH Bulls Target for 4,000$.
#Ethereum price surge 26.40% last week and closed above the daily resistance at $3,730 on Sunday. At the time of writing on Monday, it hovers at around $3,780$.
If ETH continues its upward trend and the daily level at $3,730 holds as support, it could extend the rally toward its next key psychological level at $4,000.
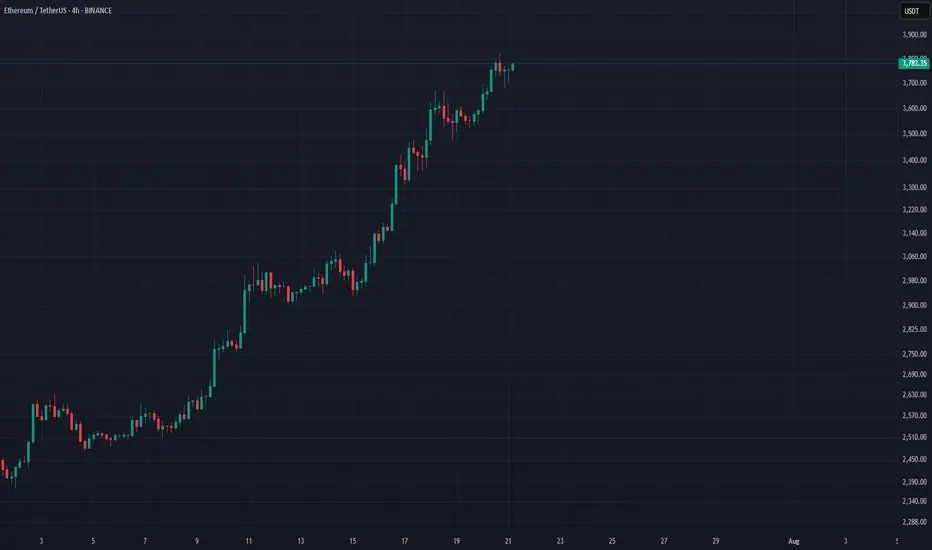
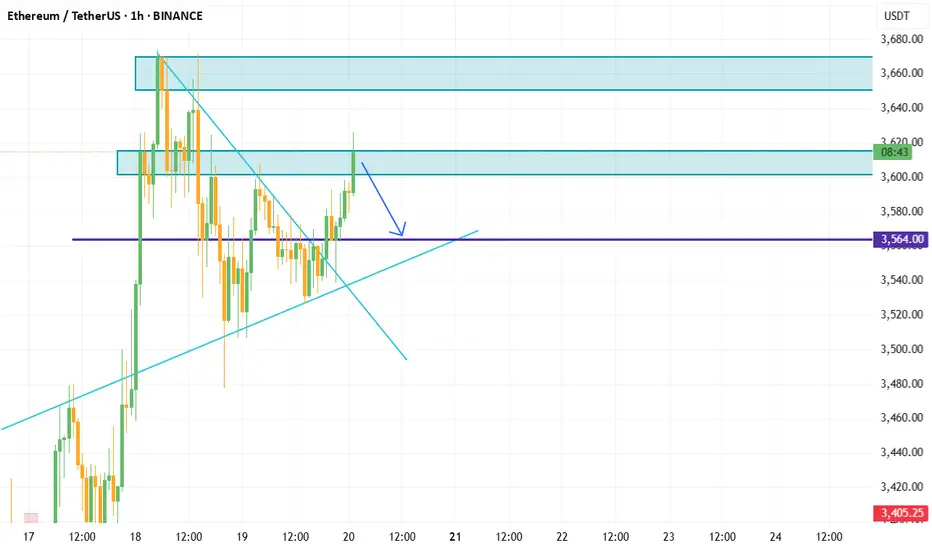
ETH-----Buy around 3600, target 3660 areaTechnical analysis of ETH contract on July 18:
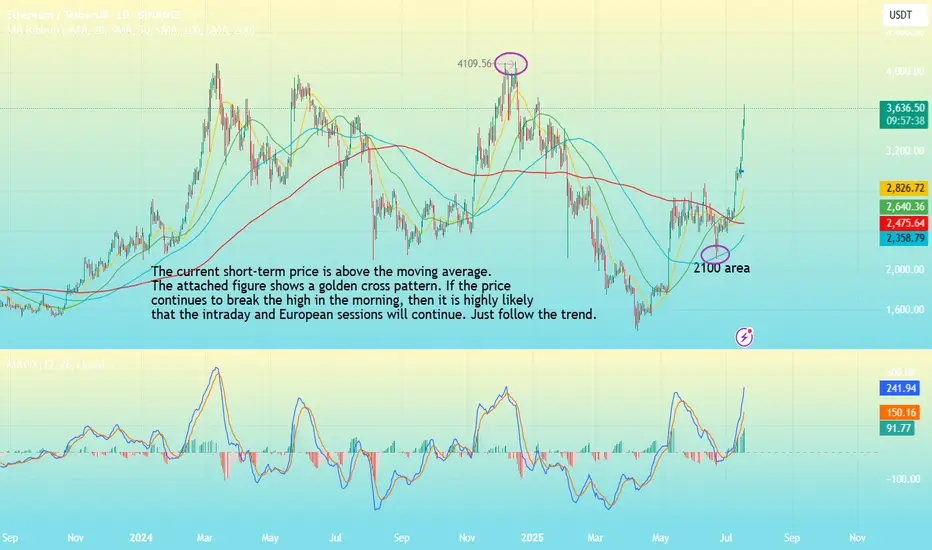
Today, the large-cycle daily level closed with a small positive line yesterday, the K-line pattern continued to rise, the price was above the moving average, and the attached indicator was running in a golden cross. The general trend of rising is still relatively obvious. Recently, you can see that Ethereum is stronger than the big cake, and the continuous high-breaking prices are getting closer and closer to the previous historical highs. So this month there is a chance to touch or test; the short-cycle hourly chart rose strongly in the morning and broke the previous day's high position. The current price is above the moving average, and the attached indicator is running in a golden cross. The intraday and European sessions still depend on the trend of continuing to break high.
Today's ETH short-term contract trading strategy:
Buy in the 3600 area, stop loss in the 3570 area, and target the 3660 area;
ETH Weekly Recap & Game Plan 20/07/2025📈 ETH Weekly Recap & Game Plan
🧠 Fundamentals & Sentiment
Market Context:
ETH continues its bullish momentum, driven by institutional demand and a supportive U.S. policy environment.
We captured strong profits by sticking to the plan (see chart below).
🔍 Technical Analysis
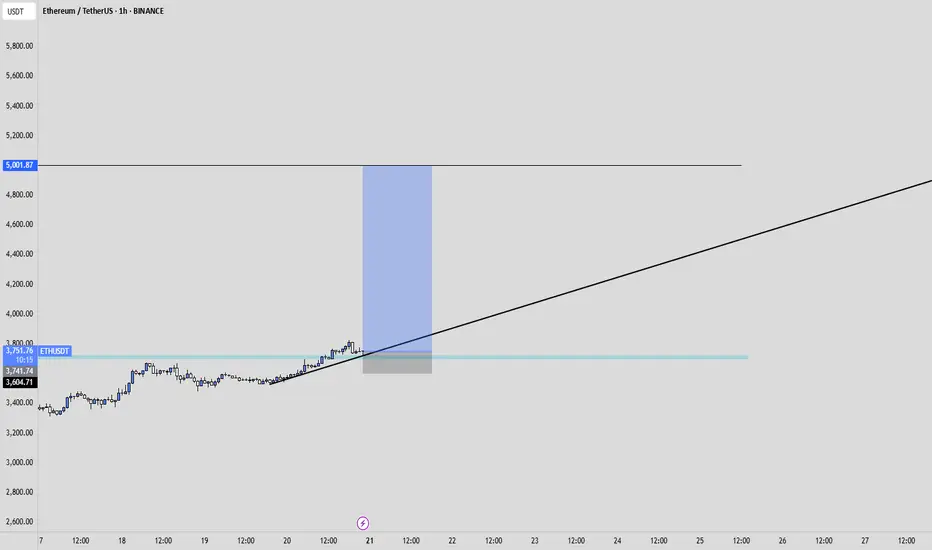
✅ Price has run into HTF liquidity at $3,750
📊 Daily RSI has entered the overbought zone, signaling potential short-term exhaustion.
We may see a brief retracement or LTF liquidity grabs, which could be enough to fuel a further push higher — potentially to $4,087.
🧭 Game Plan
I’m watching two key downside liquidity levels:
$3,534 (black line)
$3,464
A sweep of either could provide the liquidity needed for continuation toward $4,087.
⚠️ I’ll wait for LTF confirmation before entering a position.
📌 Follow for Weekly Recaps & Game Plans
If you find this analysis helpful, follow me for weekly ETH updates, smart money insights, and trade setups based on structure + liquidity.

ETH to 5000USDBINANCE:ETHUSDT
Key take away points :
-Ethereum has been uptrending for a long time already.
-We did not break previous ATH yet.
-I believe we are in the alt season, and ethereum is just getting started.
-I expect price to break previous ATH within months, and to potentially reach 5-6K USD.
ETH in Liftoff Mode — But Resistance AheadEthereum has been trending hard — with the Hull Suite catching the breakout perfectly from the $2,200 base.
But now it’s flying straight into a key resistance zone that capped price earlier this year.
This is where many trend strategies get tested. Will Hull keep riding the wave — or will we start seeing signs of exhaustion?
📊 Watching closely how it reacts near the previous supply zone. These are the conditions where robust backtests matter most.
—
#ETHUSD #Ethereum #TrendAnalysis #HullSuite #BreakoutTrading #ResistanceZone #QuantTradingPro #TradingView #CryptoAnalysis

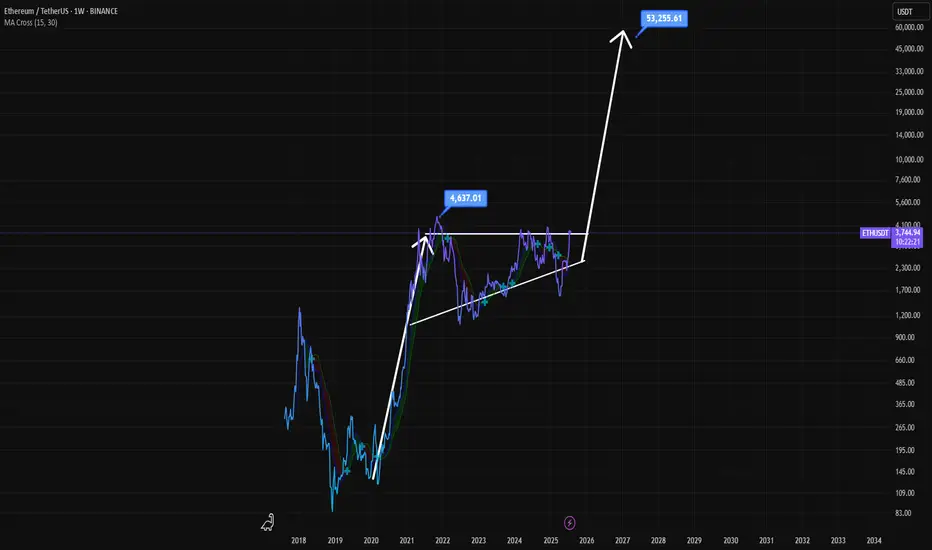
Ethereum's Path to $53,000: Multi-Year Breakout Pattern?This is a long-term technical analysis chart for the Ethereum/TetherUS (ETH/USDT) pair, presented on a weekly (1W) timeframe and using a logarithmic scale. The logarithmic scale is important as it visualizes percentage-based movements equally, which is crucial for analyzing an asset that has experienced exponential growth over many years.
Crucially, the date on the chart is "Jul 20, 2025," which is in the future. This indicates the chart is not just an analysis of past events but a speculative forecast of future price action.
Key Elements and Pattern Analysis
The chartist has identified and drawn a classic bullish continuation pattern known as an Ascending Triangle. Let's break down its components:
The Prior Uptrend (The "Flagpole"): Before the triangle formation, there was a massive upward price move starting in 2020 and peaking in late 2021. This powerful uptrend is the prerequisite for a bullish continuation pattern.
The Ascending Triangle Pattern: This is the multi-year consolidation phase that has been forming since the peak in late 2021.
Horizontal Resistance: The top of the triangle is a flat resistance line drawn at the previous all-time high, marked with a label at $4,637.01. The price has tested this level and failed to break through it, establishing it as a significant supply zone.
Ascending Support: The bottom of the triangle is a rising trendline. The price has made a series of "higher lows" since the market bottom in 2022. This indicates that despite pullbacks, buying pressure is consistently stepping in at higher price levels, showing underlying strength.
The Projected Breakout and Target: The core of this analysis is the prediction of what happens next.
Breakout: The chartist predicts that the price will continue to consolidate within this triangle until approximately late 2025 or early 2026. At that point, it is projected to break out decisively above the horizontal resistance.
Measured Move Target: The extremely bullish price target of $53,255.61 is calculated using a common technical analysis technique called a "measured move." The height of the triangle at its widest part (from the low around mid-2022 to the resistance line) is measured and then projected upward from the breakout point. This results in the highly ambitious target.
Interpretation and Narrative
The story this chart tells is as follows:
After its parabolic run in 2020-2021, Ethereum entered a necessary, long-term consolidation period.
During this multi-year phase, it has been building a massive base of support, with buyers absorbing selling pressure at progressively higher prices (the higher lows).
The chartist believes this long period of accumulation will eventually resolve to the upside, with a powerful breakout above the previous all-time high.
Such a breakout would signal the end of the consolidation and the beginning of a new major bull market cycle for Ethereum, with a projected target far exceeding the previous peak.
Important Caveats
Highly Speculative: This is a long-term forecast. Technical patterns are about probabilities, not certainties, and they can fail. The future date and extreme target price highlight the speculative nature of this analysis.
Pattern Invalidation: The entire bullish thesis is invalidated if the price breaks down below the ascending support trendline. Such a breakdown would be a significant bearish signal, suggesting a major trend reversal instead of a continuation.
External Factors: This technical analysis does not account for fundamental factors, macroeconomic shifts, regulatory changes, or other black swan events that could dramatically impact the price of Ethereum.
In summary, the chart presents a very bullish long-term outlook for Ethereum, based on the formation of a classic ascending triangle pattern. It forecasts a multi-year consolidation followed by a powerful breakout and a new, explosive bull run to over $50,000. However, this should be viewed as one possible scenario among many, with its own specific conditions for validation and invalidation.
Disclaimer: This is not a financial advise. This analysis is purely for informational purposes and should not be considered as investment advice. Trading involves risk, and you should consult with a financial professional before making any decisions.
Weekly ETH candle sitting on 3 lines of resistance.This weekly ETH God candle is fighting with 3 lines of resistance. The white is the 25% discount zone calculated from Ethereums lowest to the highest point. Ethereum is right now roughly 25% below it's ATH. Plus two FIB retracement lines. There are 12 more hours till the end of this week, and unless we see a candle close above the 25% resistance line and a new one open, we may see some retracement. It would also be warranted to see some profit taking on the recent hype over the weekend, particularly with talks of Wall Street making announcements of plans to palce massive ETHEREUM buy orders. I expect some downtime towards the start of the week followed by the continuation of the pump possibly Tuesday or Wednesday.
ETHUSDT - Limited Return PriceEthereum is a reliable network for financial transfers and transactions and can be considered the second most popular digital currency after Bitcoin. Currently, this currency has reached the price range of $2,500 with temporary decreases, but this price is at its lowest level and the probability of liquidity entering this price area is very high. This price level can be used for long-term investment. I specify two targets for this price area: $4,000-5,000.
Sasha Charkhchian

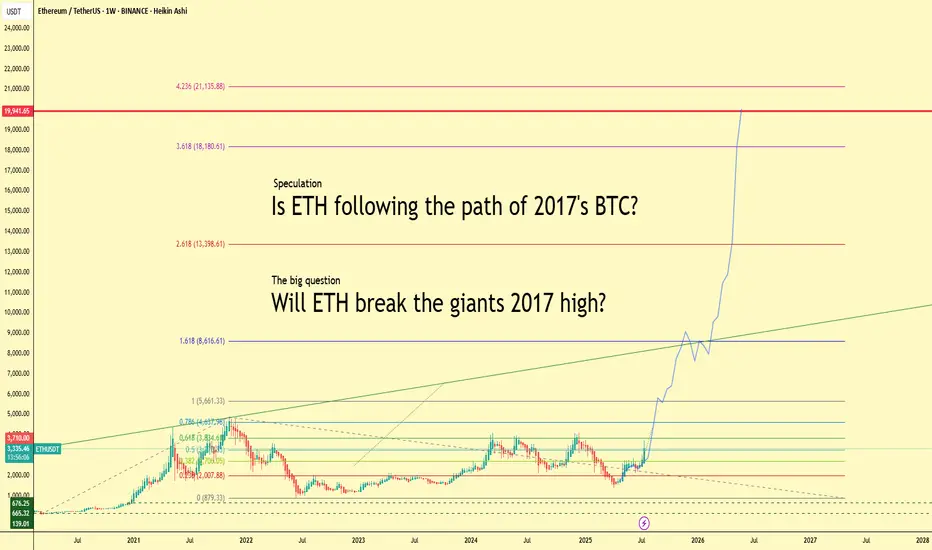
Will ETH Follow BTC’s 2017 Path? $20K in Sight?Ethereum is heating up — up more than 20% this week and currently trading above $3,300. But what if we told you this might just be the beginning?
This chart explores a bold yet exciting speculation:
👉 Is ETH repeating Bitcoin’s legendary 2017 run?
Back then, BTC went from obscurity to global headlines, smashing through $1k, then $5k, then $10k… and eventually peaking just below $20,000. Ethereum might just be lining up for a similar parabolic path.
🚀 Fibonacci Levels Say: Sky’s the Limit
The chart projects Fibonacci extensions up to:
1.618 = $8,600
2.618 = $13,400
3.618 = $18,180
4.236 = $21,135
Notice the key level: $19,941. That’s the legendary BTC high of 2017. Will ETH match or even surpass that milestone?
🧠 The Big Question:
Can ETH become the new “giant”?
While Bitcoin still leads the narrative, Ethereum’s ecosystem, real-world adoption, and institutional attention have never been stronger.
💬 Let’s Talk
Do you believe Ethereum is set to break $20K this cycle? Or is this just hopium and lines? Share your thoughts and let's compare notes.
#Ethereum #ETHUSDT #Crypto #Altseason #BTC2017 #Fibonacci #Bullrun #ETHBreakout #Parabola #CryptoSpeculation
Ethereum Price Hits 6-Month High, Up Next $4,000BINANCE:ETHUSDT has managed to navigate recent market volatility with significant support from investors. As companies increasingly mirror Bitcoin’s corporate treasury use case, Ethereum is gaining traction.
BINANCE:ETHUSDT price surged 26% over the past week , reaching $3,715 and marking a 6-month high. The rally strengthened after ETH formed a Golden Cross last week. With this bullish momentum, Ethereum is now targeting $4,000 in the coming days, benefiting from investor confidence and growing institutional interest.
However, if BINANCE:ETHUSDT bullish momentum weakens and investors opt to sell, the price could decline to $3,131 . This would erase recent gains and invalidate the current bullish outlook.

ETHUSDT | Two Opportunities. One Smart Approach.I’ve been closely watching how buyers behave under the green line — and they’re clearly not backing down. But what really catches my eye is the blue box , a clean demand zone I’ve seen act as a launchpad in the past.
You don’t need to jump in blindly.
Depending on your risk appetite, both levels are valid. But if you wait for a 15-minute breakout confirmation on the low timeframe before acting on either, your odds of success increase significantly.
This is how I keep my win rate high, waiting for the market to prove itself first.
“I will not insist on my short idea. If the levels suddenly break upwards and do not give a downward break in the low time frame, I will not evaluate it. If they break upwards with volume and give a retest, I will look long.”
Most traders rush in. You wait smart. That’s the edge.
Choose wisely. Follow closely.
📌I keep my charts clean and simple because I believe clarity leads to better decisions.
📌My approach is built on years of experience and a solid track record. I don’t claim to know it all but I’m confident in my ability to spot high-probability setups.
📌If you would like to learn how to use the heatmap, cumulative volume delta and volume footprint techniques that I use below to determine very accurate demand regions, you can send me a private message. I help anyone who wants it completely free of charge.
🔑I have a long list of my proven technique below:
🎯 ZENUSDT.P: Patience & Profitability | %230 Reaction from the Sniper Entry
🐶 DOGEUSDT.P: Next Move
🎨 RENDERUSDT.P: Opportunity of the Month
💎 ETHUSDT.P: Where to Retrace
🟢 BNBUSDT.P: Potential Surge
📊 BTC Dominance: Reaction Zone
🌊 WAVESUSDT.P: Demand Zone Potential
🟣 UNIUSDT.P: Long-Term Trade
🔵 XRPUSDT.P: Entry Zones
🔗 LINKUSDT.P: Follow The River
📈 BTCUSDT.P: Two Key Demand Zones
🟩 POLUSDT: Bullish Momentum
🌟 PENDLEUSDT.P: Where Opportunity Meets Precision
🔥 BTCUSDT.P: Liquidation of Highly Leveraged Longs
🌊 SOLUSDT.P: SOL's Dip - Your Opportunity
🐸 1000PEPEUSDT.P: Prime Bounce Zone Unlocked
🚀 ETHUSDT.P: Set to Explode - Don't Miss This Game Changer
🤖 IQUSDT: Smart Plan
⚡️ PONDUSDT: A Trade Not Taken Is Better Than a Losing One
💼 STMXUSDT: 2 Buying Areas
🐢 TURBOUSDT: Buy Zones and Buyer Presence
🌍 ICPUSDT.P: Massive Upside Potential | Check the Trade Update For Seeing Results
🟠 IDEXUSDT: Spot Buy Area | %26 Profit if You Trade with MSB
📌 USUALUSDT: Buyers Are Active + %70 Profit in Total
🌟 FORTHUSDT: Sniper Entry +%26 Reaction
🐳 QKCUSDT: Sniper Entry +%57 Reaction
📊 BTC.D: Retest of Key Area Highly Likely
📊 XNOUSDT %80 Reaction with a Simple Blue Box!
📊 BELUSDT Amazing %120 Reaction!
📊 Simple Red Box, Extraordinary Results
I stopped adding to the list because it's kinda tiring to add 5-10 charts in every move but you can check my profile and see that it goes on..

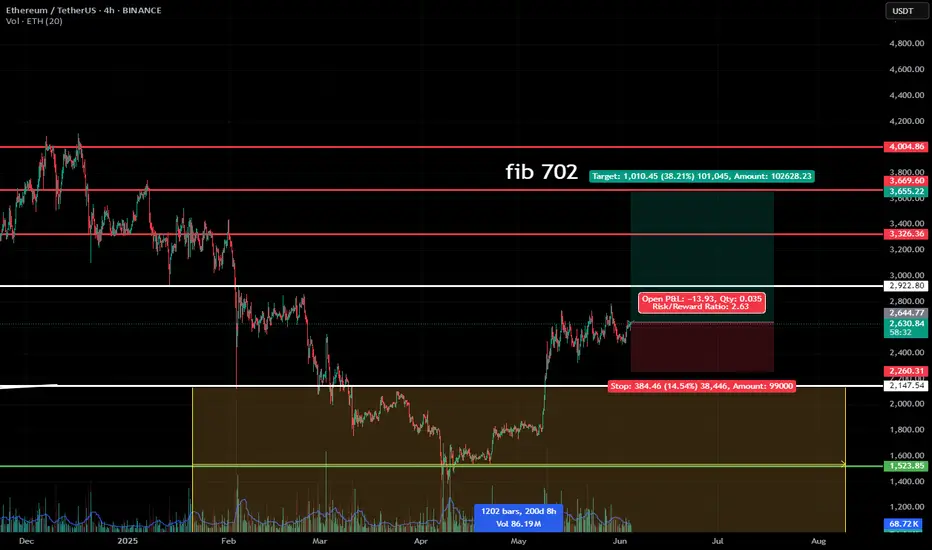
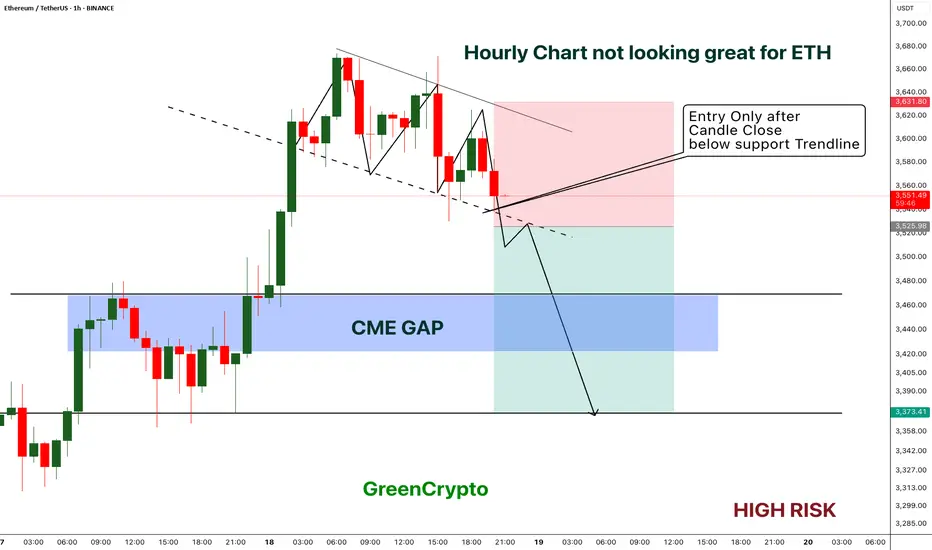
ETH - Short Trade with HIGH RISK- ETH got reject from resistance multiple times on 1H timeframe and now the price is playing near the support.
- I'm expecting overall market to cooldown this weekend, this could push the ETH to break the support
- ETH has CME gap around 3422 - 3467 range, im expecting this CME gap to be filled soon.
Entry Price: Below 3525
Stop Loss: 3631
TP1: 3471.15
TP2: 3381.76
Move SL to breakeven on TP1 hit.
Don't forget to keep stoploss.
Cheers
GreenCrypto
ETH - Ranges overview (update) We've had some nice movements on ETH lately so let's have a look at where we are.
As previously discussed IF we reclaimed 2.5K we should expect the market to aggressively trade towards the HTF buyside (3.4K and 4K).
The buyside at 3.4K has been traded through already so no let's be PATIENT and see IF we get through 4K and higher.
As always WAIT FOR THE MARKET TO SHOW YOU ITS HAND.
Stay safe and never risk more than 1-5% of your capital per trade. The following analysis is merely a price action based analysis and does not constitute financial advice in any form.
ETH | Trade setup📌 After the breakout from the last high at $2.9k, a bullish sequence (orange) has now been activated.
📊 These setups typically occur no more than twice per year on any given altcoin, so I’ll be aggressively buying each level at the B-C retracement area.
Trademanagement:
- I'm placing long orders at each level and SL right before the next level. (If the price continues climbing, I’ll adjust the trend reversal level (orange) accordingly and update my limit orders.)
- Once the trade reaches a 2 R/R, I’ll move the stop-loss to break-even.
- From a 3 R/R onward, I’ll start locking in profits.
✅ I welcome every correction from here on —
but I won’t enter any new positions at these top levels.
ETH/USDT 30m Signal📉 ETH/USDT 30m Signal
Pair: ETH/USDT
Timeframe: 30-minute
Trade: SELL
📍
📊 Level
Pips
R:R
💵 Entry
3,610 USDT
🚫 Stop-Loss
3,650 USDT
🎯 Target 1
3,570 USDT
1:1
🎯 Target 2
3,530 USDT
2:1
🎯 Target 3
3,490 USDT
3:1

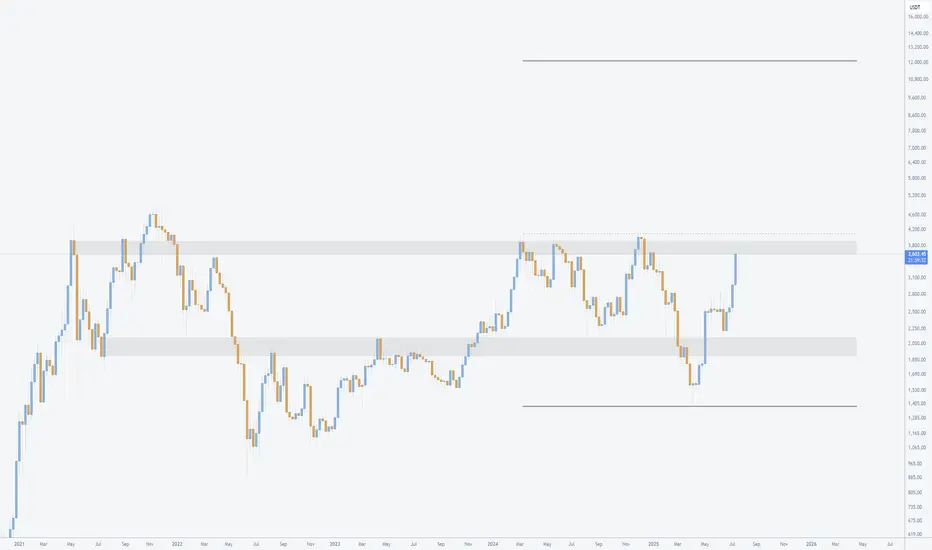
Ethereum to $12,000The chart, spanning from mid-2021 to projected levels into 2027, showcases Ethereum's price in a classic ascending channel, characterized by higher highs and higher lows. This is indicative of sustained buyer control and a maturing bull cycle.
Price Action and Key Levels: Ethereum bottomed out near $880 in June 2022 (close to the S2 support level around $900), forming a strong base. Since then, it has rallied through multiple resistance zones, with the most recent breakout above the R1 level at approximately $3,471. This breakout, confirmed by a close above the line on higher volume, flips R1 into new support and opens the door for further gains. The pivot point (P) sits around $2,800, providing a safety net, while lower supports at S1 (~$2,400) and S2 (~$1,200) have held firm during previous pullbacks. On the upside, the next targets include R2 (~$4,700), R3 (~$6,000), R4 (~$8,500), and R5 (~$11,000). Extending this using Fibonacci projections from the 2022 low to the 2024 high (a common tool for measuring bull runs in crypto), we arrive at a target of $12,000, which aligns with the upper channel boundary and historical cycle multiples.
Volume Confirmation: The bottom panel shows volume bars spiking during uptrends, particularly in the recent push above R1. This indicates accumulation by institutional investors and retail buyers alike, with declining volume on pullbacks suggesting limited selling pressure. Increasing volume on breakouts is a hallmark of sustainable rallies, reducing the risk of a false move.
Momentum Indicators: The blue line in the sub-chart appears to be the Relative Strength Index (RSI), currently hovering above 50 and trending upward without entering overbought territory (above 70). This signals building bullish momentum with room to run. Additionally, the lack of divergence between price and RSI further supports the strength of the current uptrend. If we see the RSI push toward 60-70, it could coincide with acceleration toward higher resistance levels.
Overall, the chart reflects a multi-year consolidation phase transitioning into expansion, similar to the 2020-2021 bull run. A measured move from the recent range (from ~$2,200 low to ~$4,000 high) projects an upside of roughly 3x, landing near our $12,000 target.
Fundamental Catalysts
Ethereum's technical strength is bolstered by robust fundamentals, making the bullish case even more compelling:
Network Upgrades and Adoption: Recent upgrades like Dencun (2024) have drastically reduced layer-2 fees and improved scalability, driving real-world usage in DeFi, NFTs, and gaming. Ethereum's dominance in smart contracts remains unchallenged, with total value locked (TVL) surpassing $60 billion and continuing to grow.
Institutional Inflows: The approval of spot Ethereum ETFs in 2024 has opened the floodgates for traditional finance, with billions in inflows expected to continue. Major players like BlackRock and Fidelity are ramping up exposure, providing a steady bid under the price.
Macro Environment and Crypto Cycle: With Bitcoin's post-halving rally typically leading altcoins like Ethereum, we're in the midst of a favorable cycle. Easing global interest rates and a weakening USD (as seen in recent Fed signals) further support risk assets like crypto. Ethereum's deflationary mechanics via EIP-1559 (burning fees) create scarcity, enhancing its store-of-value narrative.
Risk Considerations and Entry Strategy
While the outlook is bullish, no analysis is complete without risks. A broader market downturn (e.g., due to regulatory hurdles or economic recession) could push ETH back toward S1 at $2,400, invalidating the short-term breakout. However, the chart's structure suggests strong support there, making dips buyable opportunities.
For entry, consider positions on a pullback to the new support at $3,471 (former R1), with a stop-loss below $3,000 to manage risk. Position sizing should account for volatility—aim for 1-2% risk per trade.
In summary, Ethereum's chart screams bullish continuation, with technical breakouts, rising volume, and positive momentum aligning for a push to new all-time highs. Targeting $12,000 represents a realistic extension of the current trend, potentially delivering 3x returns from current levels around $3,500. This isn't just speculation; it's a confluence of data-driven signals in one of the most innovative assets in the market. Stay long, stay vigilant.