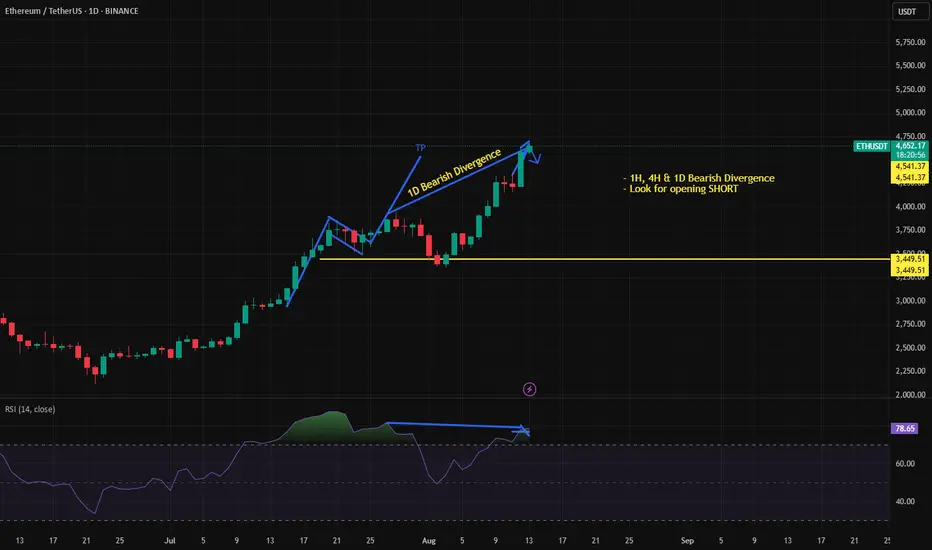
Sell Short trade Good probability in eth to sell off daily and weekly
has bearish diversion and price took liquidity from recent top
ETHUPUSDT trade ideas

ETH/USDT | ETH Surges 18% – Next Targets Above $4000 in Sight!By analyzing the Ethereum chart on the weekly timeframe, we can see that, as expected, the price continued its rally, gaining over 18% and reaching $3969. It is now trading around $3915, and I expect this bullish momentum to continue, with the price soon pushing above $4000. The next targets are $4100, $4400, and $4900. This analysis will be updated soon!
Please support me with your likes and comments to motivate me to share more analysis with you and share your opinion about the possible trend of this chart with me !
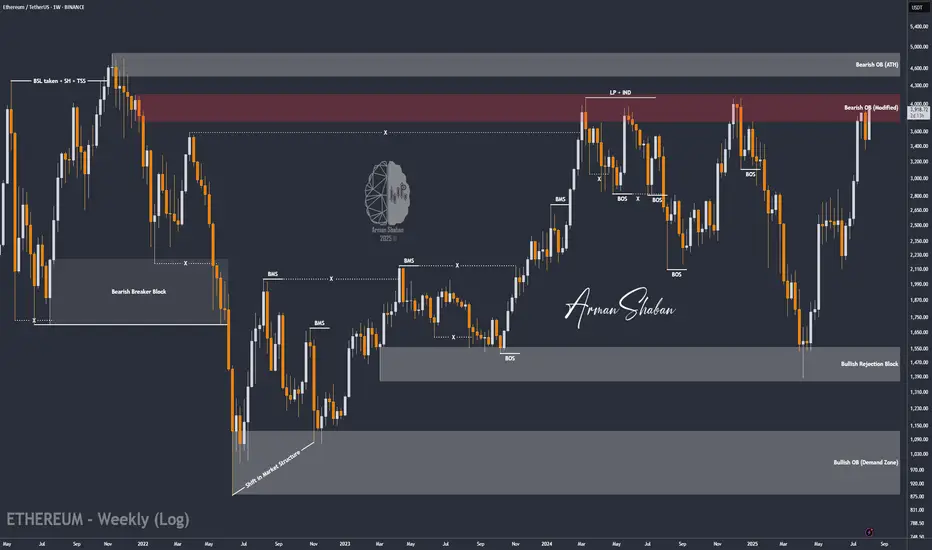
Best Regards , Arman Shaban
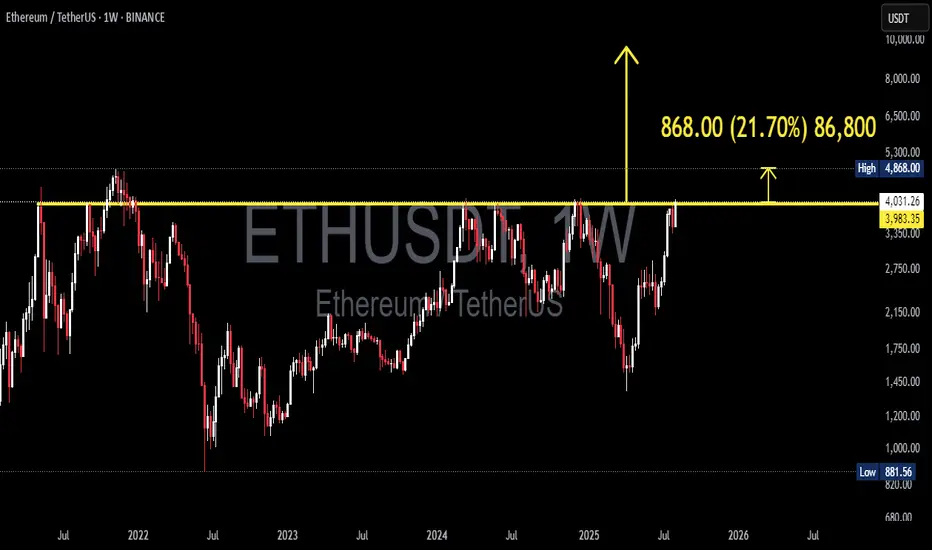
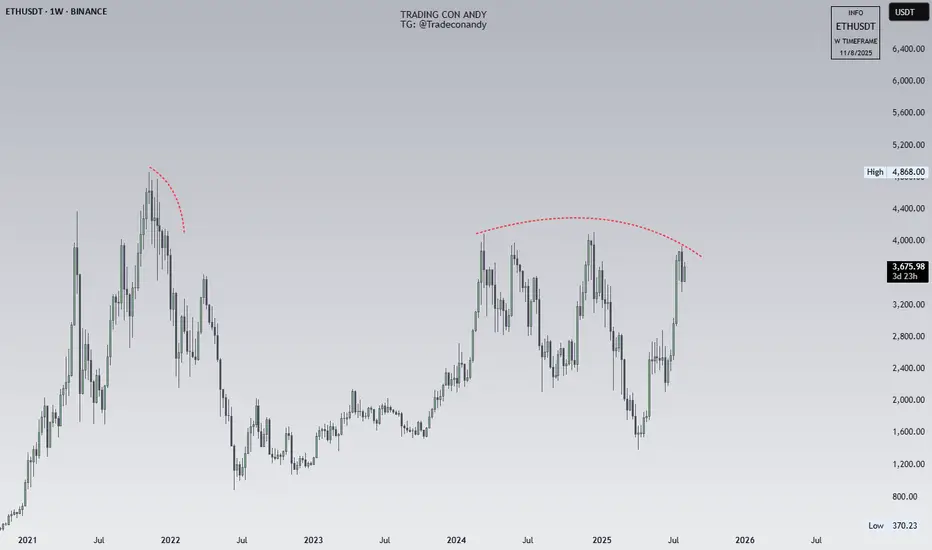
ETH/USDT — Resistance Around $4.0k: Breakout or Rejection?Summary
The weekly chart shows Ethereum testing a multi-year horizontal resistance zone around $3.9k–$4.1k, a level repeatedly tested since 2021. The measured move on the chart projects a potential target of $4,868 — about +$868 or ~21–22% upside — if a confirmed breakout occurs on the weekly timeframe.
---
Technical Analysis (based on chart)
Timeframe: Weekly (1W). The current test is highly significant due to the higher timeframe, with medium- to long-term implications.
Key Levels:
Major resistance zone: ≈ $3,950 – $4,100 (yellow line).
Breakout target: $4,868 (≈ +$868 or ~+21–22% from the breakout zone).
First support if rejected: ≈ $3,300 – $3,600. Stronger support at $2,100 – $2,750.
Price Action: Price has made multiple peaks at this zone (multiple tops), signaling strong supply. However, recent higher lows suggest growing bullish momentum — if a breakout occurs.
Pattern: Multi-year horizontal resistance. Possible outcomes:
Rejection: Acts as a triple-top / horizontal supply zone.
Breakout: Transitions into a range breakout setup with measured target.
---
Bullish Scenario (confirmation needed)
1. Confirmation signal: Weekly close above $4.0k zone with strong follow-through in the next week.
2. Entry strategies:
Conservative: Wait for a retest (resistance → support) before entering, with stop below retest (~$3.7k).
Aggressive: Enter on breakout, stop below breakout candle low.
3. Target: First target ~$4,868 (measured move). If momentum persists, higher targets may be reached.
4. Invalidation: Weekly close back below $3.7k–3.8k after breakout.
---
Bearish Scenario (if rejection occurs)
1. Confirmation signal: Bearish rejection candle (pin bar / engulfing) on weekly + no breakout close.
2. Entry strategies: Short or take profit on longs after confirmed rejection; ideally backed by bearish follow-through next week.
3. Target downside: First support $3.3k–3.6k; stronger drop could retest $2.1k–2.8k zone.
4. Invalidation: Weekly close back above $4.1k with strong bullish volume.
---
Risk Management & Notes
Weekly close is key — avoid reacting solely to intraday wicks.
Volume matters: No volume = higher risk of false breakout.
Position sizing: Keep risk controlled (e.g., 1–2% per trade), stops in logical zones.
Multi-timeframe check: Use daily chart for precise entries and watch for orderflow/news catalysts.
---
Pattern Notes
Multiple Tops / Horizontal Supply: Sellers have consistently defended this level.
Ascending pressure: Higher lows into resistance can increase breakout probability.
Measured Move: Distance from breakout zone to target is about $868 — matching the chart’s projection.
---
Hashtags
#ETH #ETHUSDT #Ethereum #Crypto #Breakout #Resistance #WeeklyChart #CryptoAnalysis #TechnicalAnalysis
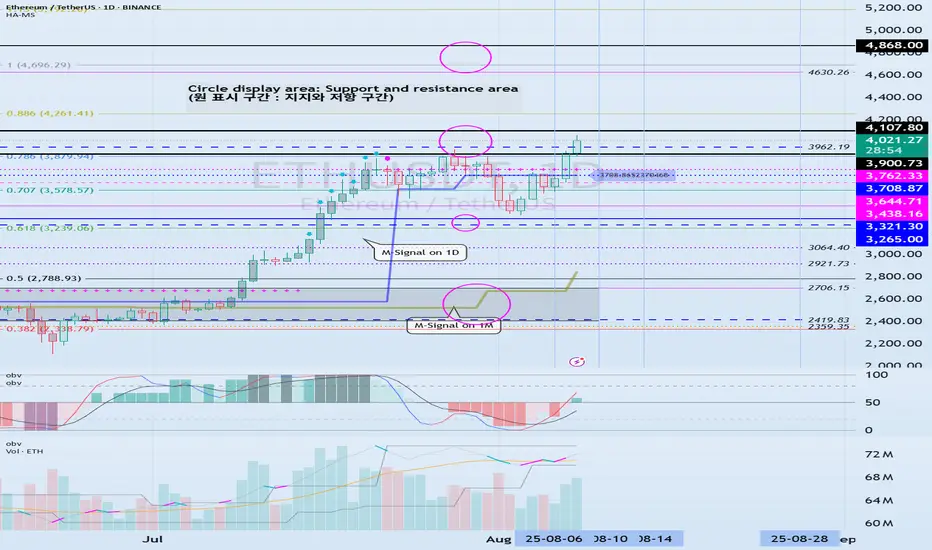
The key is whether the price can hold above 3900.73-4107.80
Hello, fellow traders!
Follow us to get the latest information quickly.
Have a great day.
-------------------------------------
(ETHUSDT 1D chart)
This period of volatility is expected to last from around August 6th to 14th (maximum from August 5th to 15th).
The key question is whether the price can find support and rise above the 3900.73-4107.80 range after this period of volatility.
The next period of volatility is expected to occur around August 28th, so we need to see if the price can hold until then.
If the price declines, we need to check for support around the HA-High ~ DOM (60) range of 3708.87-3762.33.
If not, there's a chance it could fall below 3265.0-3321.30.
-
(1M Chart)
The TC (Trend Check) indicator has risen above 0, suggesting a high possibility of further upside.
Therefore, the key point to watch is whether it can rise above the 4630.26-4868.0 range.
For an uptrend to continue,
- The StochRSI indicator must remain upward with K > D.
(If possible, it's best to avoid K entering the overbought zone.)
- The On-Board Volume (OBV) indicator of the Low Line ~ High Line channel must remain upward.
(If possible, it's best to maintain OBV > OBVEMA.)
- The TC (Trend Check) indicator must remain upward.
(If possible, it should remain above 0.)
If the above conditions are met, the uptrend is likely to continue.
To sustain an uptrend by breaking above key support and resistance levels,
- The StochRSI indicator must remain below the overbought zone and remain above D.
- The On-Board Volume (OBV) indicator of the Low Line ~ High Line channel must rise above the High Line and remain upward.
- The TC (Trend Check) indicator must remain upward. (If possible, it should remain above the 0 point.)
When the above conditions are met, there is a high probability that the price will rise after breaking above important support and resistance levels.
-
Thank you for reading to the end.
I wish you successful trading.
--------------------------------------------------
- Here's an explanation of the big picture.
(3-year bull market, 1-year bear market pattern)
I will explain more in detail when the bear market begins.
------------------------------------------------------
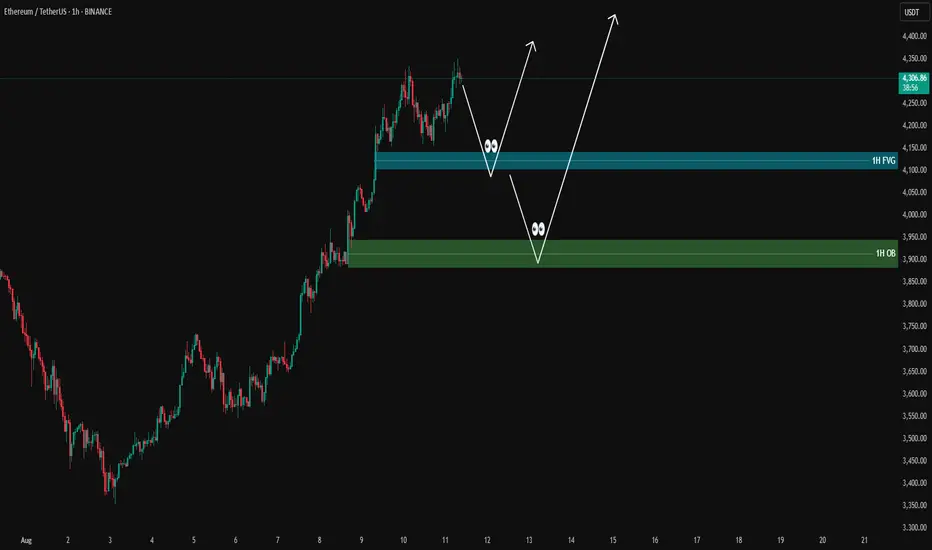
ETHUSDT analysis - 1H FVG and OB SetupsETH has recently rejected from the 4,370 area, showing signs of short-term exhaustion.
On the 1H chart, a clear FVG is located around 4,100, which could act as a liquidity target if selling pressure continues.
Below that, we have a strong Bullish OB around 3,900, aligning with previous demand and potential reversal interest.
If price retraces into the FVG zone (4,100) and shows bullish reaction in lower timeframes, short-term buys could be considered targeting 4,300 – 4,370.
A deeper move into the OB at 3,900 would be a high-probability long setup for swing traders, with upside potential toward 4,500.
For now, structure remains bullish on higher timeframes, but short-term correction is possible before continuation.
📊 ProfitaminFX | Gold, BTC & EUR/USD & Crypto
📚 Daily setups & educational trades
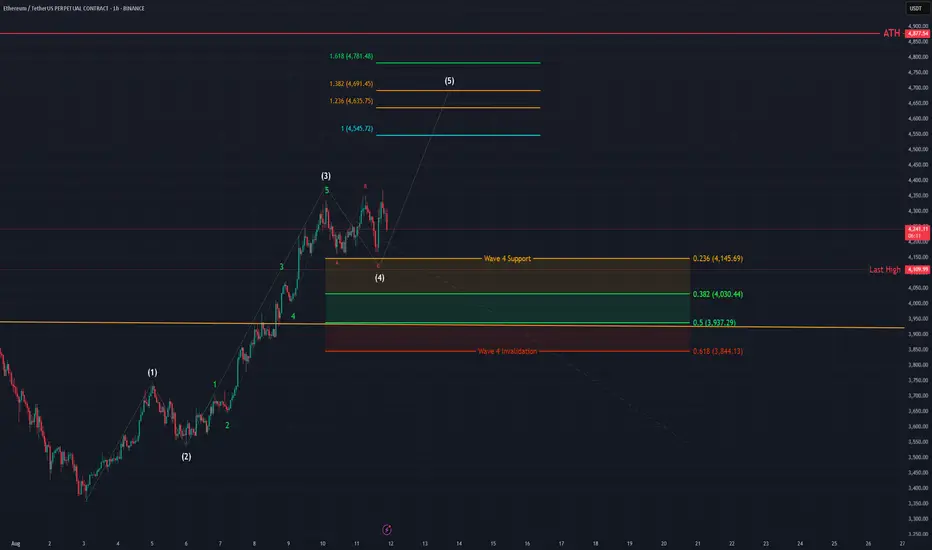
ETH - 1H Elliott Wave Analysis - 11.08.25Welcome to our updated Elliott Wave Analysis for Ethereum which has been showing a lot of strength and bullish momentum recently.
We're assuming that we finished the white Wave 3 and probably even the white Wave 4 in the red ABC which would mean that we possibly started the white Wave 5 already.
We want to communicate the white Wave 4 support area in case we get an extended correction.
The white Wave 4 support area lies between the 0.236 FIB at 4145 USD and the 0.5 FIB at 3937 USD. We also have a lot of potential support at around 4000-4100 USD which is a psychological level as well as recent highs that we have broken which can spark buying interest around that zone.
The first targets for the white Wave 5 would be the 1 to 1 FIB at 4545 USD, the 1.236 FIB at 4635 USD, the 1.382 FIB at 4691 USD and if we get an extended 5th Wave the 1.618 FIB at 4'781 USD.
Thanks for reading.
NO FINANCIAL ADVICE.
Ethereum Forms Symmetrical Triangle and Bullish PennantETH is currently consolidating in a symmetrical triangle - a narrowing range created by alternating lower highs and higher lows. This pattern is considered neutral, but when broken through it usually gives a strong impulse to movement, you also need to take into account the information from the previous analysis of ETH
A pennant is also being formed - after a strong impulse, the price contracts, creating a small narrow channel (pennant), which often continues to move in the same direction after the breakout
Current price: $3.684
Probable price of the upper breakout from $4100 to $4800, then most likely there will be a small price drop
The probability that we will go down is extremely small now, but the price may fall to the level of $3400 or $3300
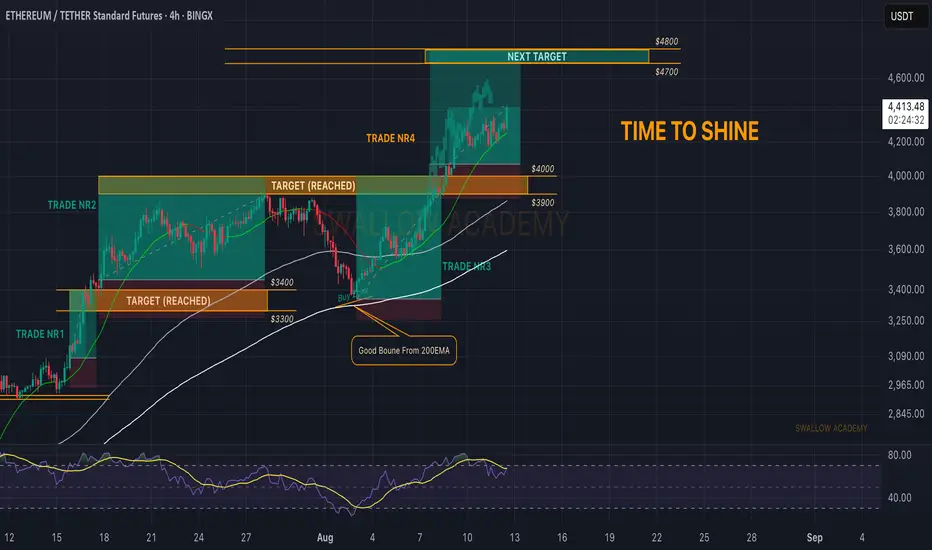
Ethereum (ETH): Time To Shine | Easiest Coin To Trade | $4800ETH has been performing more than well; since $3000, we have been hunting multiple trades and so far all of them have played out well.
Currently our 4th trade is in process, where we are aiming to see the ETH at $4800, which most probably will happen, considering the dynamics of the current money inflow we are having on ETH.
Bitcoin had its time; now it is Ethereum's turn.
Swallow Academy
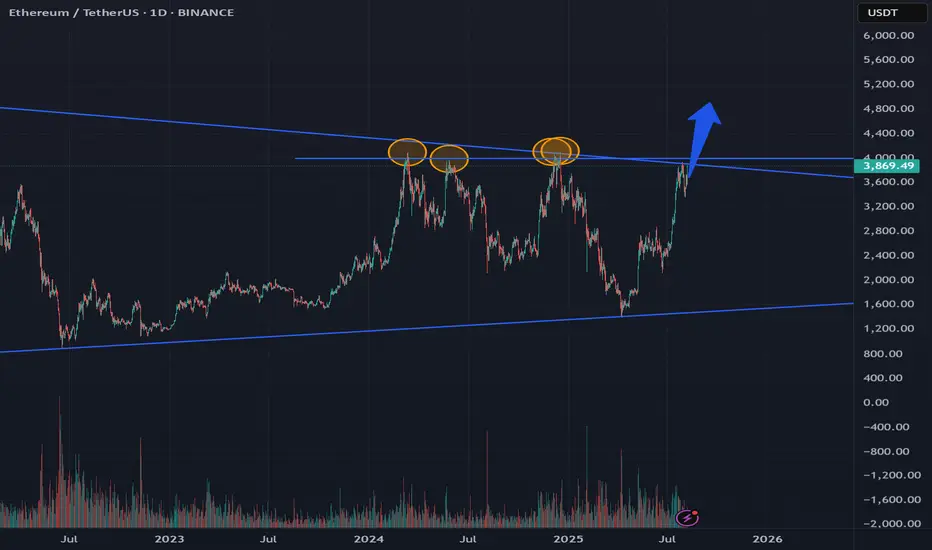
Ethereum currently on an important crossroadAs you can see, the current levels for BINANCE:ETHUSDT haven't been broken since march 24, 3 attempts so far, this time it's the 4th. IF it breaks, it'll bring in an eth related altseason (which means alts that correspond with ethereum).
Let's see and hope. BINANCE:OPUSDT trade still open
ETHUSD - Divergence Spotted, Hit projected TP1D Bearish Divergence: Price made a higher high while RSI made a lower high → momentum weakening.
Multi-timeframe confirmation: The same divergence is visible on 1H and 4H → increases reliability of a reversal.
Price at TP: Already hit the prior projection target.
Neckline watch: A close below the marked yellow neckline (~$4,541) could be your trigger to open short positions.
Next potential drop zone: If neckline breaks, next strong support is around $3,449.
This means it’s not an automatic short yet — but if price closes decisively below neckline support with increased volume, it would align with the bearish divergence and justify riding the trade down toward the $3,449 area.
ETHUSDT – TECHNICAL BUY CALL | 10 AUGUST 2025 ETHUSDT – TECHNICAL BUY CALL | 10 AUGUST 2025
The coin has been moving in an uptrend marked with a light blue color channel. Although it recently broke down from this channel, it has sustained itself and formed a double bottom pattern. We expect the coin to test the recent swing high and achieve multiple bullish targets before any change in trend direction.
Ethereum ONLY UPBINANCE:ETHUSDT.P At any moment this goes above $4000, don't say I didn't warn you, a giant bullish candle is coming, there's too much liquidity above.
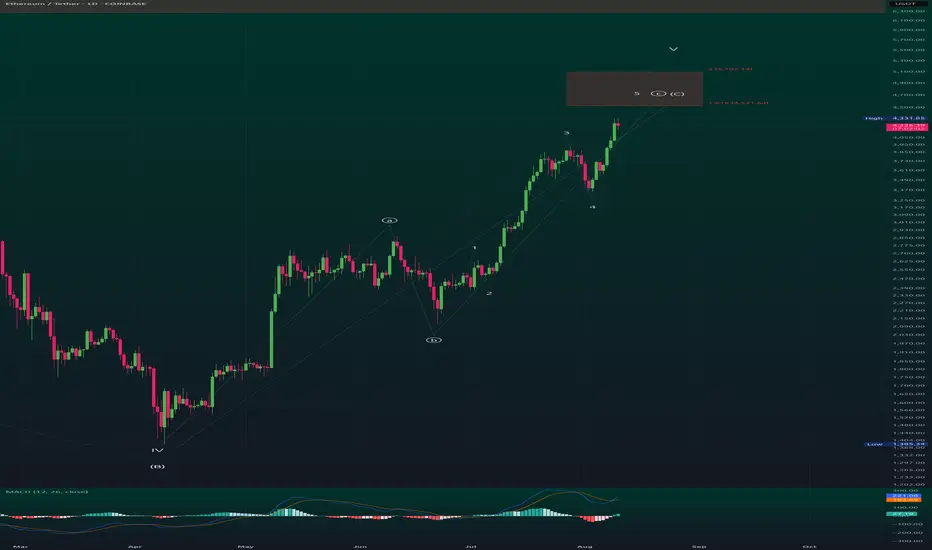
ETH/USD – Multi-Degree Terminal Advance: Daily ⑤ of CETH/USDT – Multi-Degree Terminal Advance: Daily Wave ⑤ of C Inside Weekly Wave C (Ending Diagonal)
1️⃣ Higher-Timeframe Context (Weekly)
ETH has been unfolding a large corrective A-B-C structure from the all-time high.
The current rally is Wave C of that correction.
Structural note: On the weekly, Wave 4 overlaps Wave 1 → violates standard impulse rules → the entire Wave C is taking the form of an Ending Diagonal.
Why this matters:
Ending diagonals appear in terminal positions (Wave 5 of an impulse or Wave C of a correction).
They often end with a throw-over above the upper trendline, followed by sharp and deep reversals.
2️⃣ Intermediate-Timeframe Context (Daily)
On the daily, we are in:
Wave ⑤ of daily Wave C.
That daily Wave C is also the final leg of weekly Wave C.
Implication:
Two degrees (daily & weekly) are scheduled to terminate together → high-probability major turning point.
3️⃣ Structure & Internal Wave Count
From the IV(B) low in April, ETH has advanced in five overlapping sub-waves:
Wave 1 – steady breakout leg.
Wave 2 – shallow pullback.
Wave 3 – strongest rally to date.
Wave 4 – pullback overlapping Wave 1 territory → confirms diagonal.
Wave 5 – ongoing final push into target zone.
Internals of each wave show a-b-c formations, consistent with diagonal rules.
4️⃣ Fibonacci Target Confluence
Anchor: IV(B) low → Wave 3 high → Wave 4 low
1.618 extension: $4,531 → first resistance.
2.000 extension: $5,102 → primary target.
Upper wedge projection / throw-over: $5,500–$5,650.
These levels also align with weekly fib projections for Wave C → creating a multi-timeframe resistance cluster.
5️⃣ Momentum & Divergence
MACD (Daily): Histogram making lower highs while price makes higher highs → early bearish divergence.
RSI (Daily & Weekly): Approaching overbought with flattening momentum → consistent with terminal phases.
Volume: Gradual contraction during the advance; watch for final spike on throw-over.
6️⃣ Scenarios
A) Terminal Top Scenario (Base Case)
Price completes Wave ⑤ of C inside the $4,531–$5,102 box.
Possible throw-over into $5,500–$5,650 on ETF hype.
Followed by swift rejection back inside wedge → break of Wave-4 low confirms top.
Targets after confirmation:
First: Wedge base / 0.382 retrace (~$3,800).
Next: 0.5 retrace (~$3,500).
Extended: Origin of diagonal (~$2,900).
B) ETF Extension Scenario
Price consolidates above $5,100 and pushes toward $5,500–$5,650.
Still part of Wave ⑤, just a stretched terminal before reversal.
Same confirmation rules: break of Wave-4 low validates reversal.
7️⃣ Invalidation & Risk Levels
Bearish invalidation: Break of Wave-4 low = high-probability top.
Bullish invalidation: Sustained breakout + consolidation above $5,650 would require re-evaluating the diagonal scenario.
8️⃣ Trade Plan (Non-Advice)
Aggressive fade: Short into $4,531–$5,102, add near $5,500–$5,650 if reached, stop above wedge throw-over.
Conservative: Wait for daily close back inside wedge and break of Wave-4 low, then short pullbacks.
Positioning note: Size down in diagonals — volatility spikes at turns.
9️⃣ Key Chart Annotations for Publishing
Wedge trendlines from Wave-II(B) low to Wave-IV(B) low.
Label 1–2–3–4–5 (with a-b-c internals) on daily.
Highlight $4,531, $5,102, and $5,500–$5,650 zones.
Mark Wave-4 low and wedge base with "Top Confirmed Below Here".
Add MACD/RSI divergence notes in top-right.
📌 Summary
ETH is in the final stages of a multi-degree ending diagonal:
Daily Wave ⑤ of C inside Weekly Wave C.
Both degrees likely terminate in $4,531–$5,102, with throw-over potential to $5,500–$5,650.
Once confirmed, expect a fast, deep retrace — this is a terminal pattern with macro top potential.
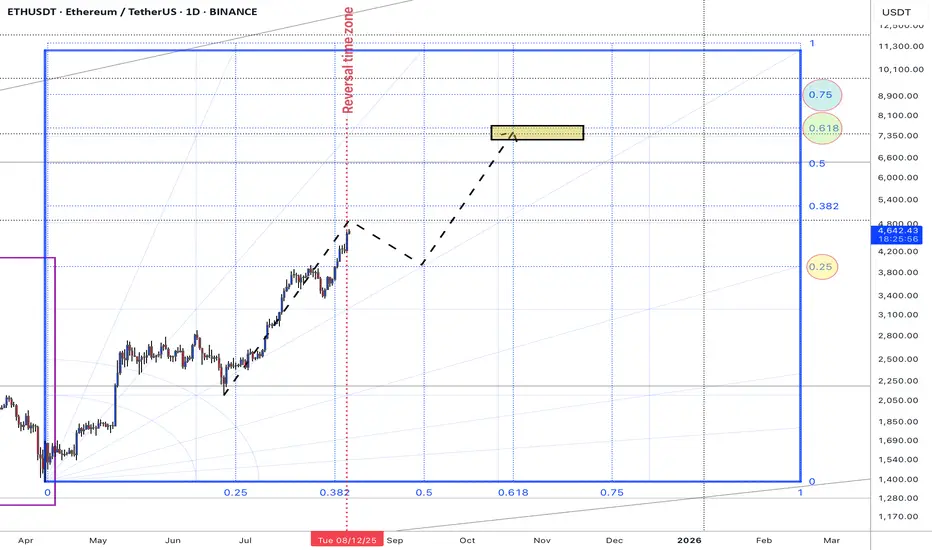
ETHUSDT #009 (Be careful, need 15-20% correction for next cycleHello dear traders.
Good days.
First of all thanks for your support and comments.
————————————————————————
On daily Gann Square ETHUSDT break out 0.5 Gann Square price zone and with good strength trend line support it expected to fill 0.618 Gann box price level at exact reversal time zone .
So be careful and do not be FOMO . expected to grow up to 4800$ and correct 15-20 % correction for retest 0.5 Gann price zone .
If support at 3940-3915 $ will grow up fro next bull cycle .
BTC Dominance is mached also at exact time with ETHUSDT .
Weekly overview of ETHUSDT Chart will updated.
Good luck and safe trades.
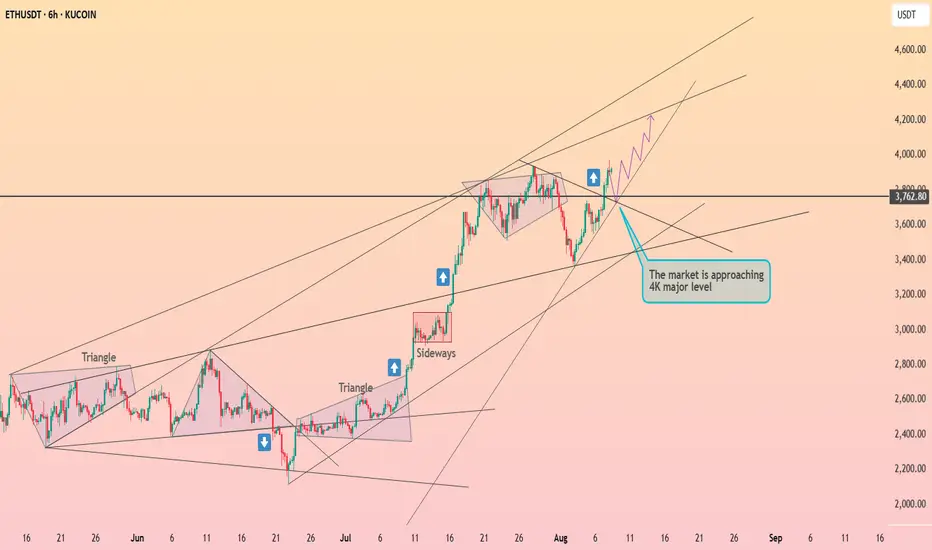
Ethereum is seeking to break through the $4k ┆ HolderStatKUCOIN:ETHUSDT recovered from a swift correction into rising trend support and is pressing back toward the 3.76–3.80k pivot. The broader pattern shows sequential triangle breakouts and a strong sideway accumulation that launched the last vertical leg. If 3.55–3.60k holds on dips, targets sit at 3.85k, 3.95k and the round‑number magnet at 4k. Only a decisive daily close beneath 3.50k would threaten the higher‑low sequence and re‑open 3.35k–3.40k. With breadth improving, the bias remains upward while price consolidates beneath resistance.
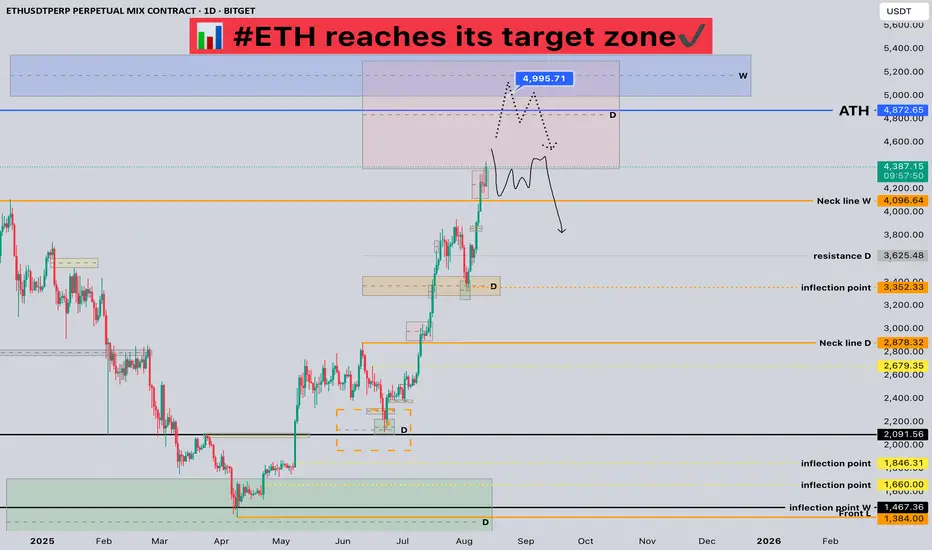
#ETH reaches its target zone📊 #ETH reaches its target zone✔️
🧠From a structural perspective, we've reached the daily bullish target zone, so we need to be wary of the risk of a pullback.
➡️Chasing the gains within the red resistance zone is not recommended, as the expectation of a daily pullback is very strong.
➡️If you want to participate in a short trade, you need to patiently wait for a bearish structure of the same cycle to emerge, or look for shorting opportunities near the overlapping resistance zone around 5000.
🤜If you like my analysis, please like 💖 and share 💬
BITGET:ETHUSDT.P
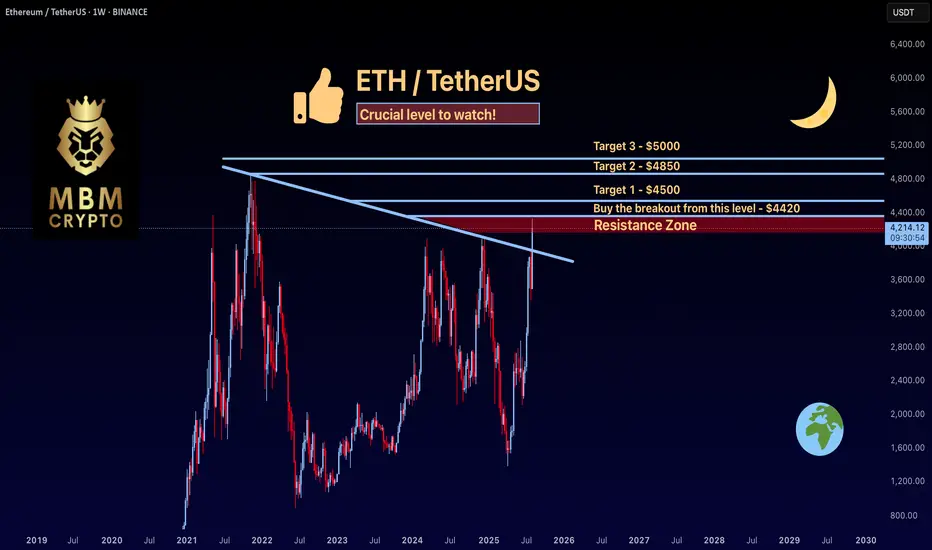
ETH: Crucial level to watch!ETH’s been on a solid run lately! If you didn’t catch the first wave, here’s a potential setup you might like.
-------------------------------------------
Trading Setup
If you’re considering trading ETH, here’s a quick setup that may help you.
The idea is: Buy when the price breaks above $4420 and take profits at the levels shown in the chart.
Targets:
1. $4500
2. $4850
3. $5000
-------------------------------------------
About our trades:
Our success rate is notably high, with 10 out of 11 posted trade setups achieving at least their first target upon a breakout price breach (The most on TW!). Our TradingView page serves as a testament to this claim, and we invite you to verify it!
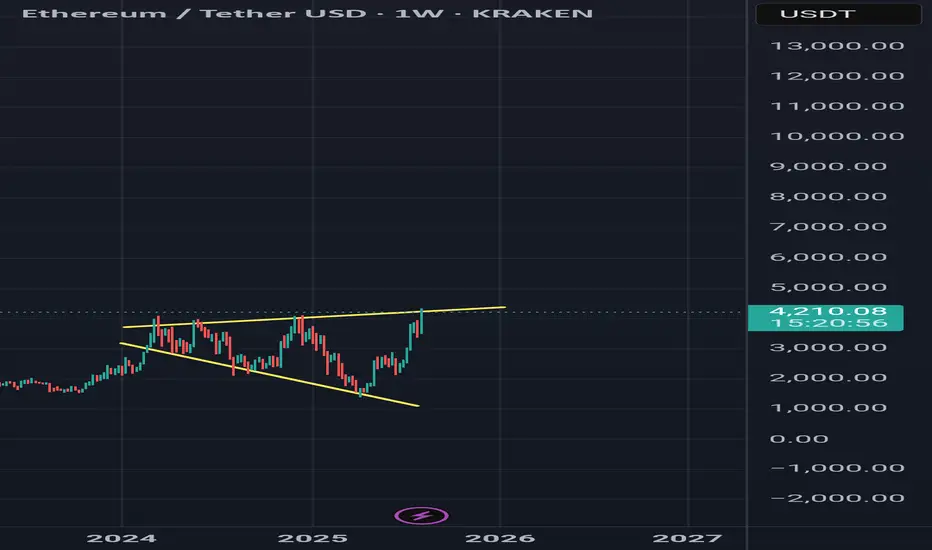
ETH/USDT Update. ETH/USDT weekly chart with those yellow trend lines forming what looks like a long-term ascending triangle / resistance ceiling just under the $4,300–$4,400.
---
1. Big Picture
The top yellow line is a multi-year resistance connecting the Nov 2021 and Mar 2022 highs.
ETH is right at that line now — this is where historically heavy selling pressure has appeared.
If ETH closes a weekly candle above $4,400 with strong volume, that’s a confirmed breakout of a 3-year structure.
---
2. Breakout Scenario
If we get a breakout:
Measured move from the base of the triangle (~$880 low to $4,400 resistance) = ~$3,520 height.
Add that to the breakout zone (~$4,400) → Target $7,900–$8,000 over months (not days).
First resistance after breakout: $4,870 (Fibonacci 2.0 extension & historical supply).
---
3. Rejection Scenario
If rejection happens here:
Possible pullback to $3,760–$3,820 (weekly demand / order block).
Deeper correction could target $3,130 if BTC also cools off.
---
4. Smart Money View
This is a high-liquidity zone — institutions & whales often engineer fake breakouts here to trap longs.
A weekly candle wick above $4,400 but close below could be a bull trap.
---
⚠️ Key takeaway:
Above $4,400 weekly close = bullish continuation → long-term $6.5k–$8k targets.
Fail to break $4,400 = short-term correction back toward $3.8k or lower.
Watch BTC at the same time — ETH almost never breaks multi-year highs alone.
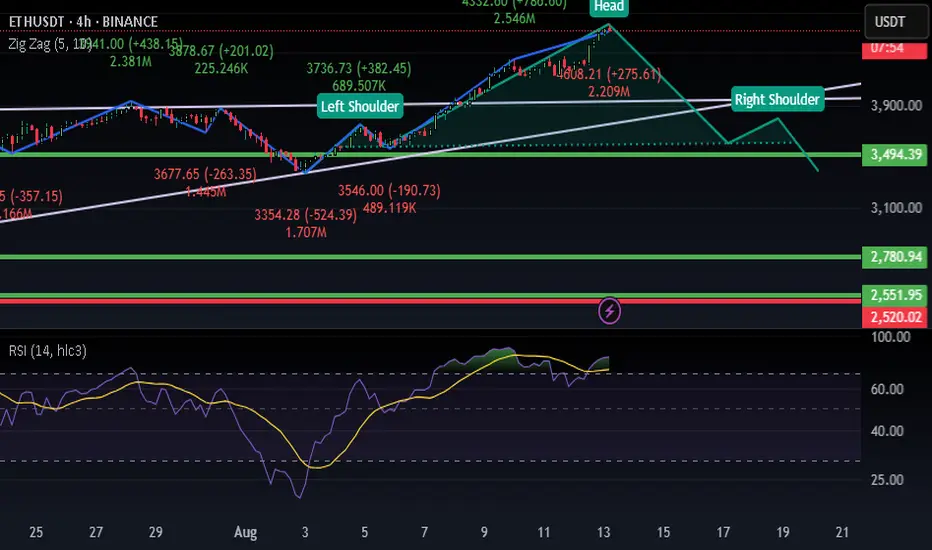
head and shoulder againin 4 time frame i see a half head and shoulder in eth if it complet maybe marget goes down what do you think????
Here I go long on Ethereum at $4,000Here I go long on Ethereum at $4,000
time to make Ethereum great again By borrowing more tethers and placing market orders triggering Ethereum supply shock
right now.
borrowing and placing market orders starting at $4,000.
tether's reserves are hitting Ethereum hard through me here now.
I think I'm triggering the major Ethereum supply shock here now.
THE MAJOR ETHEREUM SUPLLY SHOCK IS HAPPENING HERE NOW.
Cut the random guesses and hopes and just let the pro do it AT THE RIGHT TIME.
MEGA
I wanna make ethereum great again and it's going to be today and it's going to be now. And old btc prices will become new eth prices
Now Ethereum run is officially confirmed by the same director that triggered bitcoin and ripple supply shock.The Martin Scorcese of the market.
birdman sharkman
CASH MONEY HEROES
when i hit ni* hit me full of that caaaash
more money than I seen in a garbage caaan
stunna island money and the power
That's how we do it make it rain make it shower
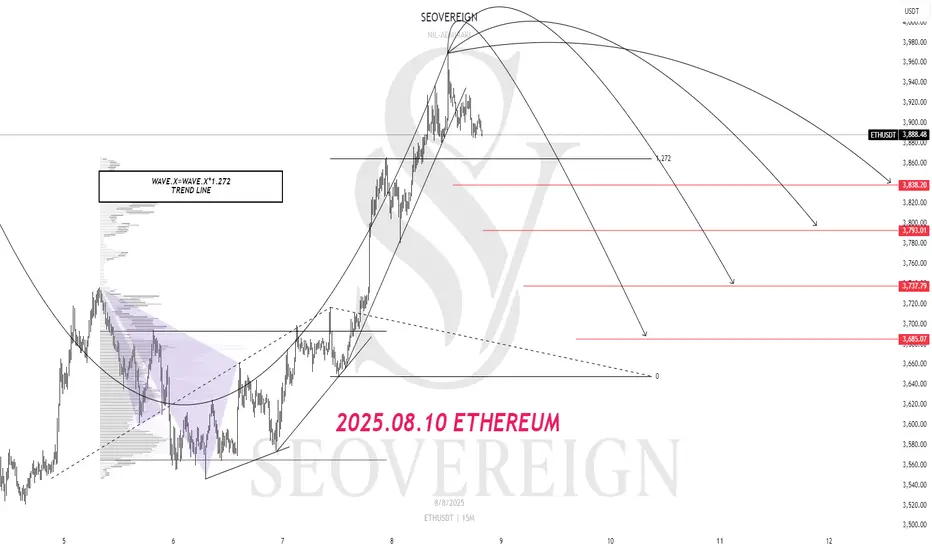
[SeoVereign] ETHEREUM BEARISH Outlook – August 10, 2025In this idea, I would like to present a bearish perspective on Ethereum.
This perspective was derived based on the Elliott Wave Theory.
Until this pattern is confirmed, I have been continuously tracking the Elliott Waves and adding reasons for the bearish scenario one by one.
As a result, I have concluded that the next major move is likely to be downward, and while searching for a specific entry point, I detected the recent trendline break.
If this wave is clearly confirmed, I believe there is a high possibility of a decline to around the average take-profit level of 3763 USDT without much difficulty, and therefore, I am considering entering a short position.
All the details have been drawn on the chart, so please refer to it.
Thank you very much for reading, and as time goes by and the chart becomes clearer, I will continue to update this idea accordingly.
Thank you.
ETHEREUM Ethereum is showing strong bullish momentum with growing investor interest and positive market dynamics, but as always, price fluctuations and profit-taking could happen near resistance zones.
but i want to see a push into 5000-5100 ascending trendline before correction. Its in a zone and will have to update the supply roof and take out the current all time high,
