ETH update 9.06.2025Hello everyone, many of you asked me to publish my vision for ETH.
Here you go!
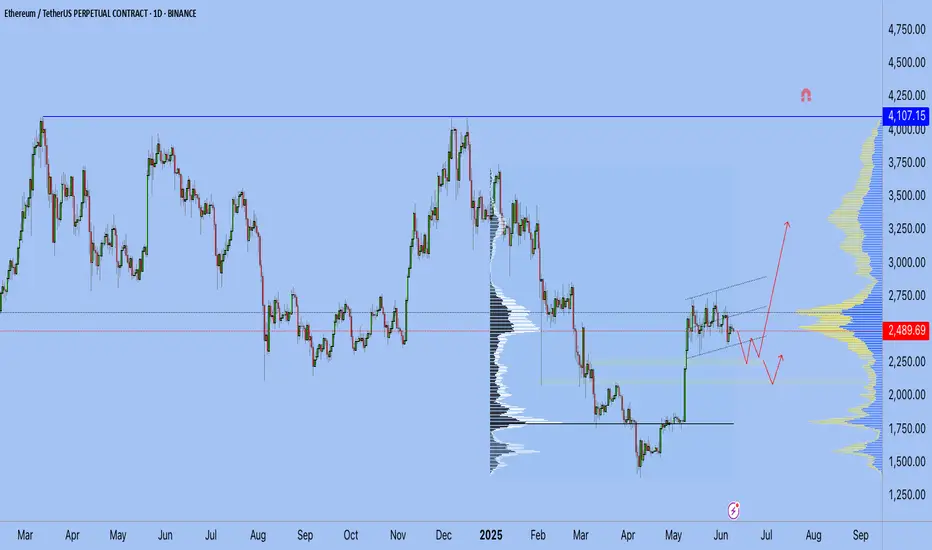
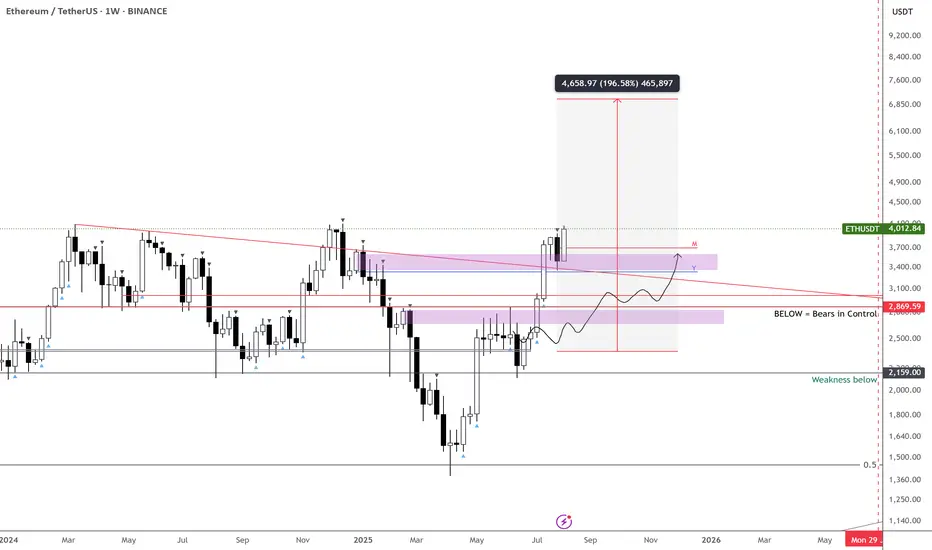
I believe that the previous impulse movement was only the first upward movement, and now we are in a sideways correction movement — call it what you will, but the fact is that the exit from this flat will be upward.
1. End of the year
2. ETH is accumulating on the Onchain
3. Liquidity overflow from BTC can be seen on the ETHBTC chart, and the overflow began at the very bottom
4. What else can large conservative players accumulate?
5. We are going after liquidity from above and should break 4100 by September
Best Regards EXCAVO
ETHUPUSDT trade ideas
ETH/USDT Short Setup – Bearish Rejection from Supply Zone!Ethereum is showing signs of weakness after getting rejected from a key 1H supply zone between $3,680 – $3,720. Price failed to break above this level and has started pulling back, suggesting potential downside momentum.
🔍 Technical Breakdown:
Supply Zone (Resistance): $3,680 – $3,720 (Highlighted in blue)
Current Price: $3,666 (Rejection candle forming below resistance)
Immediate Support (TP1): $3,552 (previous structure support)
Key Demand Zone (TP2): $3,417 – $3,342 (strong buying interest previously seen here)
❌ Rejection Evidence:
Price tapped into high-volume area and sold off
Lower highs forming after rejection
Bearish engulfing candles starting to show on 1H
📌 Trade Idea:
If price stays below $3,680 and breaks below $3,640:
Entry: $3,660 – $3,670 (current price zone)
SL: Above $3,720 (above supply zone)
TP1: $3,552
TP2: $3,417
TP3 (Max target): $3,342
🧠 Notes:
Watch for clean break of $3,552 to confirm momentum
Retest of broken support could offer a second entry
ETH remains volatile – use good risk management
🔴 Bias: Bearish Until $3,720 Is Broken

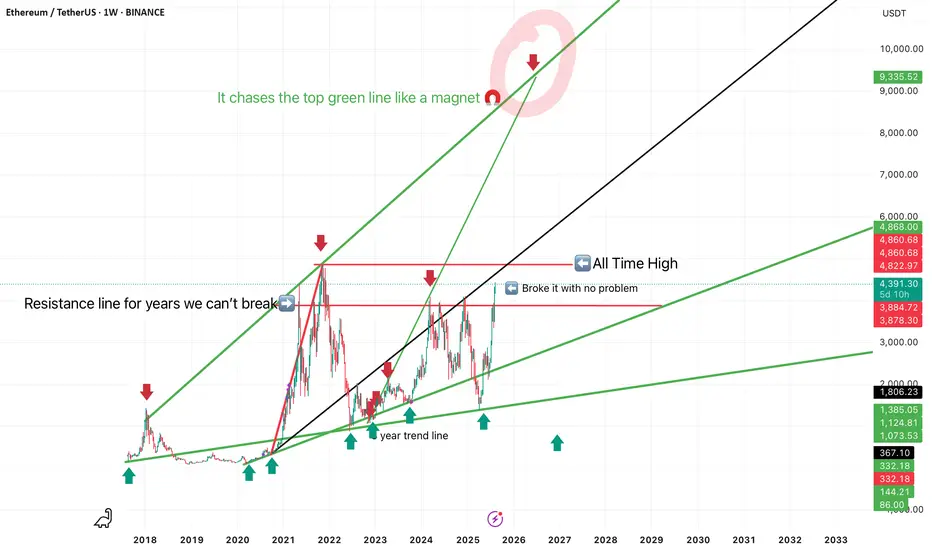
$Eth (Ethereum) road map to prices that will melt faces If history repeats itself, like it always does, then you should watch this beautifully play out, Ethereum is like a magnet to the top green line, but your resistance and support lines are tagged out. Do what you want with this and make sure you do your own research.
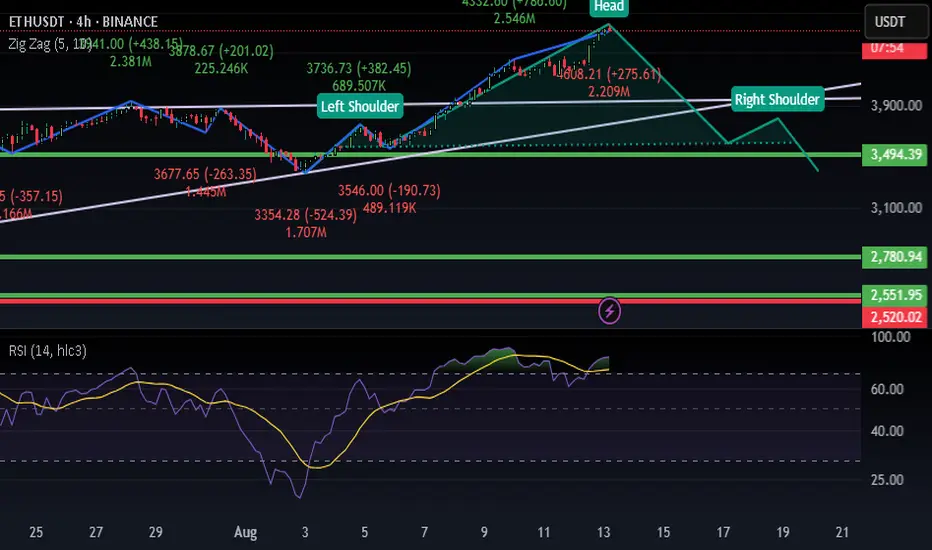
head and shoulder againin 4 time frame i see a half head and shoulder in eth if it complet maybe marget goes down what do you think????
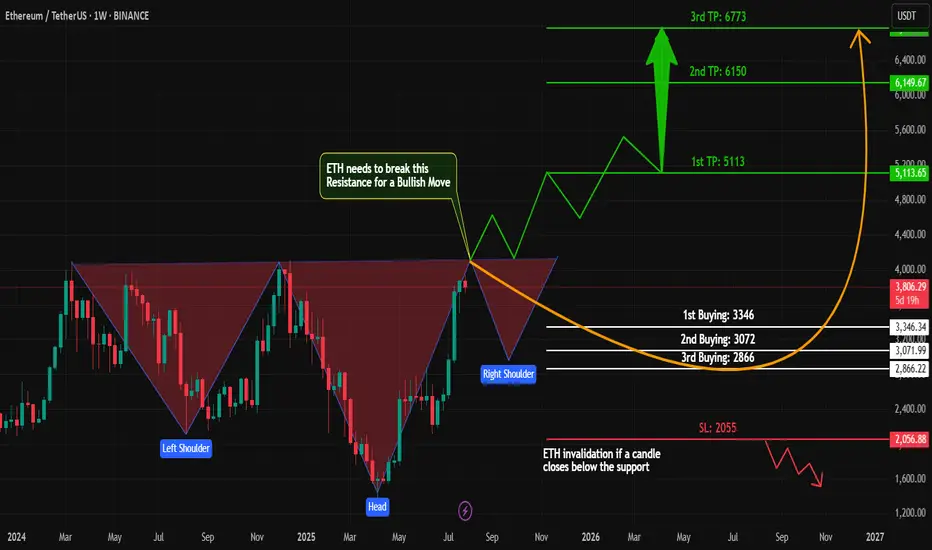
ETH Bullish – Inverse Head & Shoulders Pattern on Weekly Chart!Technical Analysis (Weekly Timeframe)
#Ethereum (ETH) is currently forming a strong bullish structure – the classic Inverse Head & Shoulders pattern – on the weekly chart.
✅ Left Shoulder ✅ Head
🟡 Now Printing the Right Shoulder...
This is a long-term spot trade setup, not for futures.
📈 Key Buy Zones:
1️⃣ First Buy: $3,346
2️⃣ Second Buy: $3,072
3️⃣ Final Support Buy: $2,866
We'll accumulate in these zones as #ETH forms its Right Shoulder.
🔓 Breakout Play:
Once #ETH breaks its All-Time High (ATH), we'll place a Buy Stop Order above the breakout level to ride the next big wave!
💬 Let me know what you think about this #ETH setup.
📌 Are you bullish on #ETH this cycle?
👍 Like, share & follow for more high-probability setups!
#ETH #Ethereum #CryptoTrading #TechnicalAnalysis #InverseHeadAndShoulders #LongTermTrade #SpotTrade #BullishCrypto #Altcoins #TradingView
Eth Short Bearish Butterfly The Bearish Butterfly setup with price levels:
📍 Entry
Around point D, which looks close to $4,186–$4,190.
🛑 Stop Loss (SL)
Safest SL: Above 1.27 XA extension (slightly beyond D) → around $4,230–$4,240.
Conservative SL: Just above 1.618 XA extension (~$4,255).
🎯 Take Profits (TP)
We use Fibonacci retracements from the AD leg for targets:
TP1: 38.2% retracement of AD → ~$3,960
TP2: 61.8% retracement of AD → ~$3,800
TP3: Full retrace to point B area (~$3,700)

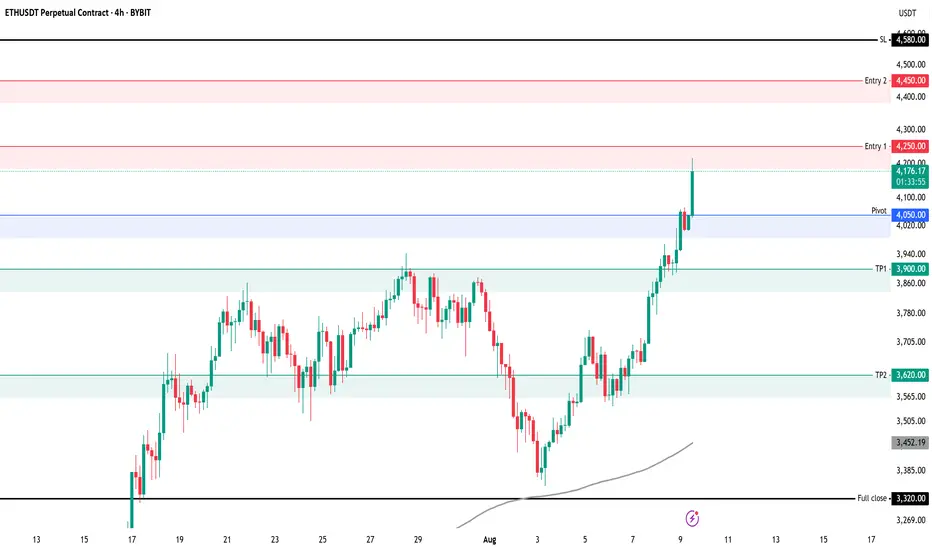
ETHUSDT ShortThese are the key areas we are looking for on ETH 4H
Risk per entry 0.25%
Entry 1: 4250
Entry 2: 4450
TP 1: 3900 or Pivot 4050
TP 2: 3620
Full TP: 3320
SL: 4580
Always manage your own risk. None of the above is financial advice.
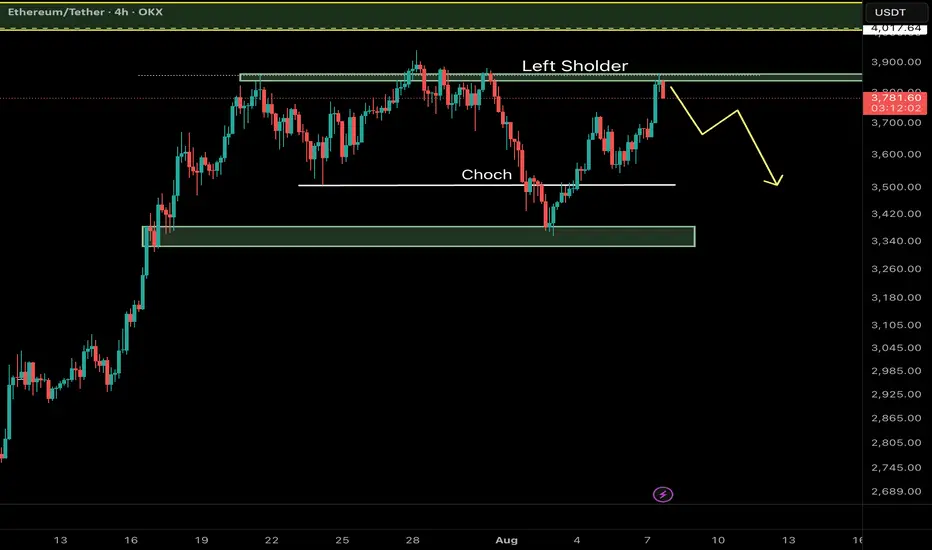
Ethereum (ETH/USDT) – Key Reversal Zone RetestAfter a major CHoCH (Change of Character) on the 4H timeframe, Ethereum has shown a strong bullish move from a high-probability demand zone and is now retesting a critical resistance area aligned with the Left Shoulder of a classic RTM pattern.
⸻
🔍 Key Technical Elements:
• CHoCH confirms the shift from a distribution phase to accumulation.
• Strong reaction from a demand zone near $3,340–$3,380.
• Price is now testing the Left Shoulder, which often acts as a reaction zone before continuation.
⸻
📌 Potential Scenarios:
🔼 Bullish Case (Primary):
If ETH breaks and closes above $3,870, a move toward the next liquidity pool around $4,010–$4,050 is likely.
🔽 Bearish Case (Alternative):
Failure to hold above the current resistance may lead to a pullback toward the $3,340–$3,380 demand zone for another accumulation attempt.
⸻
💡 Educational Note:
In RTM methodology, retests of the Left Shoulder after CHoCH are considered one of the most efficient entry zones — especially when confluence with liquidity voids or imbalance exists.
Follow for more Smart Money & RTM insights.
Haven't Posted in a Bit, Here's a Solid Chart for You All!Alright, been a while, but here's the deal: still no altseason in sight.
Meanwhile, ETHUSDT dropping some serious hints of a wild bull run on this fractal chart. It s got that 2020 vibe, though the timing s a tad off especially when you factor in Bitcoin s cycles.
Gonna be a blast watching this play out!

ETHUSDTDISTRIBUTION +ACCUMULITON= RE ACCUMULITON
Accumulation begins and reaccumulation is being completed and the Wyckoff structure is completed
Composite Academy and Analysis
Professor Ramtia Siddiqui
Aram Pizbin Professor
BINANCE:ETHUSDT

Ethereum (ETH/USDT) – Midline Break Retest and Channel Top in Si🔍 Technical Overview
Ethereum has recently broken above the midline of its descending channel, indicating a potential bullish shift within the short-term corrective structure. The price action suggests that we are currently witnessing a retest of the broken midline, which is now acting as dynamic support.
This behavior is consistent with smart money principles — where a previously broken internal structure gets tested before continuation.
⸻
🧠 NEoWave Context
Structurally, ETH appears to be developing a Contracting Corrective pattern, with the current leg likely evolving as Wave D. This wave typically exhibits strength and complexity, often stretching toward the channel top while still respecting broader consolidation boundaries.
⸻
💡 Smart Money Insights
• ✅ BOS already confirmed on LTF (1H, 4H) with higher lows
• 🔄 Price has reclaimed the internal broken structure (midline) and is retesting it
• 🔋 Bullish OB around $3,480–$3,510 acted as a launch zone for current leg
• 📍 Next resistance is the channel top near $3,740
⸻
📊 Trade Scenarios
🟩 Bullish Scenario (Preferred):
If the retest of the midline holds, ETH is likely to continue its move toward the upper boundary of the descending channel (~$3,730–$3,750). This aligns with Wave D expectations in complex corrections.
🟥 Bearish Invalidations:
A breakdown back below $3,520 and loss of the internal bullish structure would negate this short-term bullish scenario and reopen downside potential toward $3,350.
⸻
⚠️ Trader Tip:
Retests of internal structures like midlines or internal trendlines often provide low-risk continuation setups — if confirmed by bullish internal BOS.
⸻
✅ Conclusion
Ethereum remains technically corrective but with bullish momentum building within the channel. As long as the midline holds, we expect continuation toward the channel top, completing Wave D structure before potential reversal.
💬 Drop your alt counts or thoughts in the comments.

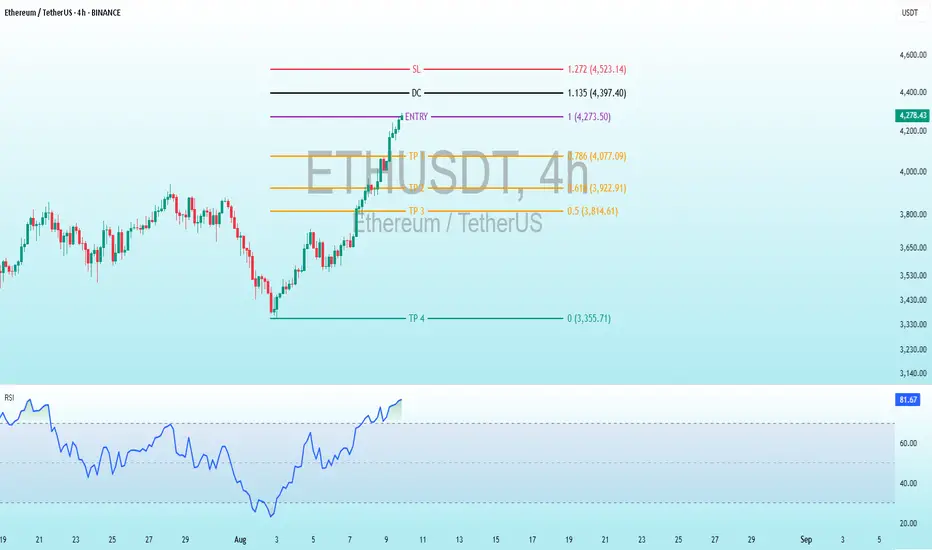
ETH Bearish DivergenceBINANCE:ETHUSDT
Trade Setup:
Target 1: 4,077.09 (0.786 Fibonnaci Golden Zone).
Target 2: 3,922.91 (0.618 Fibonnaci Golden Zone).
Target 3: 3,814.61 (0.5 Fibonnaci Golden Zone).
Target 4: 3,355.71 (0 Fibonnaci).
DCA : 4,397.40 (1.135 Fibonacci)
Stop Loss: 4,523.14 (1.272 Fibonacci).
RSI Analysis: The RSI is showing a bearish divergence, suggesting potential bearish momentum. The current RSI is around 81.56, approaching oversold territory, so caution is advised.
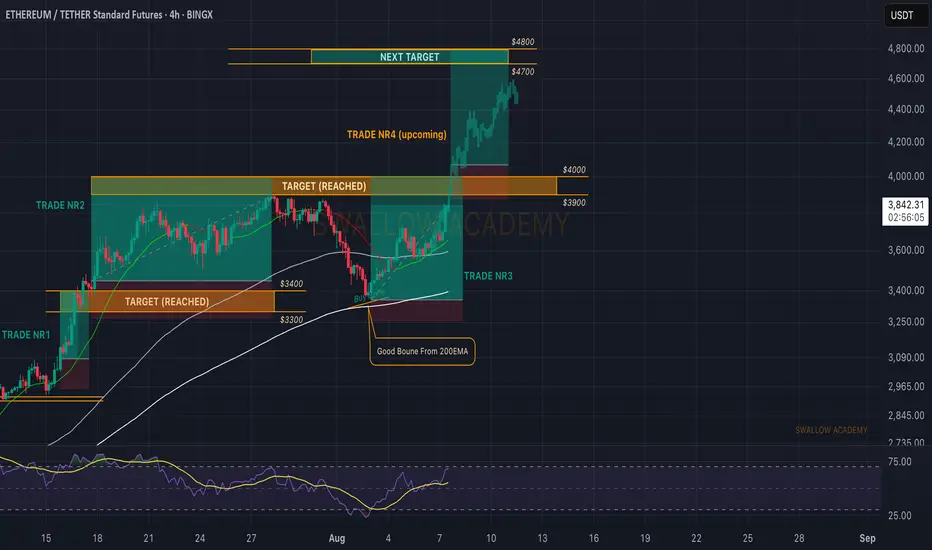
Ethereum (ETH): Seeing Struggle But Nothing Serious | Bullish AFETH still looks bullish to us, with the price staying above the local 200EMA, where last time we had a decent bounce from it.
Now, as many remember and know, we are bullish on ETH only due to 1 big reason: the liquidity of BTC has to go somewhere, and as investors have already had their fun (most of it, at least) with BTC, now they need to relocate their money and ETH is the next step.
$4000 is still our target (once again, as we already reached it once basically), and the current zone seems like a good bounce area with the 100 EMA and the middle line of the BB sitting there, in addition to lots of liquidity being distributed here (based on the order book we use)!
Swallow Academy

ETH: LIVE TRADEHello friends🙌
✅Given the good rise we had, we had a small correction that was a buying opportunity and there is another support area where we can buy the second step in case of further correction.
We have also specified targets for you, be careful and do not act emotionally and observe capital and risk management.
🔥Follow us for more signals🔥
*Trade safely with us*

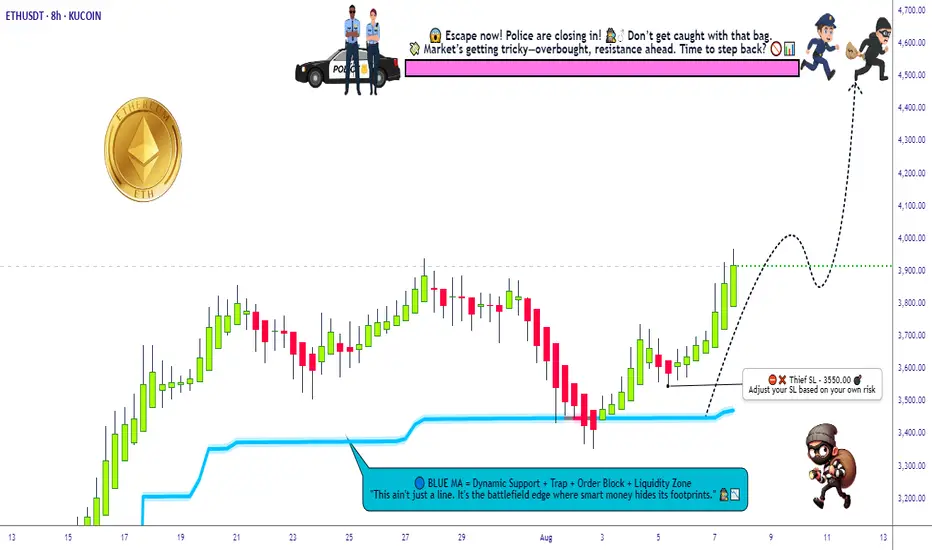
ETH/USDT Grid Plan » Bullish Loadout » Stealing the Top🚨ETH/USDT Crypto Heist Plan 🔓💰
Asset: ETH/USDT "Ethereum vs Tether"
Plan: 🟢 Bullish – Multi-Layered Entry Grid
Strategy: Thief-style limit orders (GRID / DCA stacking)
Entry: Any Dip is a Heist Opportunity 💸
Stop Loss: 🔻 3550.00
Target: 🎯 4500.00
👋 Hey Thieves & Money Makers!
Get your gear ready – it's time to loot the Ethereum Vault 💎🚀
🔥Thief Trader's ETH/USDT Master Robbery Blueprint🔥
This ain’t your average plan — we break in with layered entries, lock in on breakout volatility, and ride the bullish train to the moon 🌕.
💼 Entry Strategy:
No need to overthink. Any dip = loot zone!
Stack multiple limit orders like a pro (15M–1H level).
We're playing the grid game. The more dips, the bigger the stash! 🧱🪙
🚨 Stop Loss:
Set SL at 🔻3550 or under recent swing lows.
Adjust by risk appetite and how many entries you stack.
Thieves don’t chase – they calculate risk.
🎯 Target Zone:
We're eyeing the 4500 mark. But remember – exit before the vault shuts if momentum slows. 🏃♂️💨💰
🔁 Scalpers Alert:
Only long. Only bullish. Only profit. 🧲💥
Stack it, trail it, and let it run with a sniper's precision. 🎯🧠
📊 Market Context:
ETH bulls gaining control post-accumulation.
Strong on-chain metrics, solid macro tailwinds.
Bears trapped in the shadows – we move in daylight. 🐂🆚🐻
📰 Warning – News Bombs Ahead!
💣 Avoid fresh positions during high-impact events.
🎯 Use Trailing SLs to protect your loot.
Smart robbers never get caught unguarded.
💥BOOST This Idea if you're part of the robbery crew 🔐💰
Every boost powers our next move.
Let's rob the crypto market together – one breakout at a time! 🏴☠️📈🤑
Thief Trader™ – Locking Targets. Looting Charts.
💎🕵️♂️📊 #CryptoHeist #ThiefStyle #ETHBreakout #GridGang #BullMode
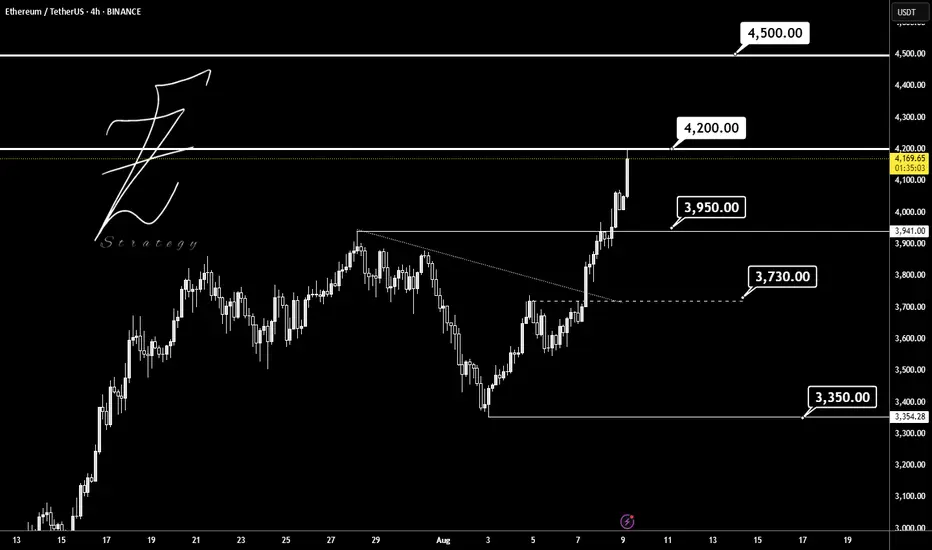
ETHUSDTBINANCE:ETHUSDT is overall trend in the 4-hour timeframe is bullish, with strong buying momentum. The price is currently at the 4200 USD resistance, and if this level breaks, the next target will be around 4500 USD.
Supports:3950 USD, 3730 USD, 3350 USD
Resistances: 4200 USD, 4500 USD
⚠️Always apply proper risk management.
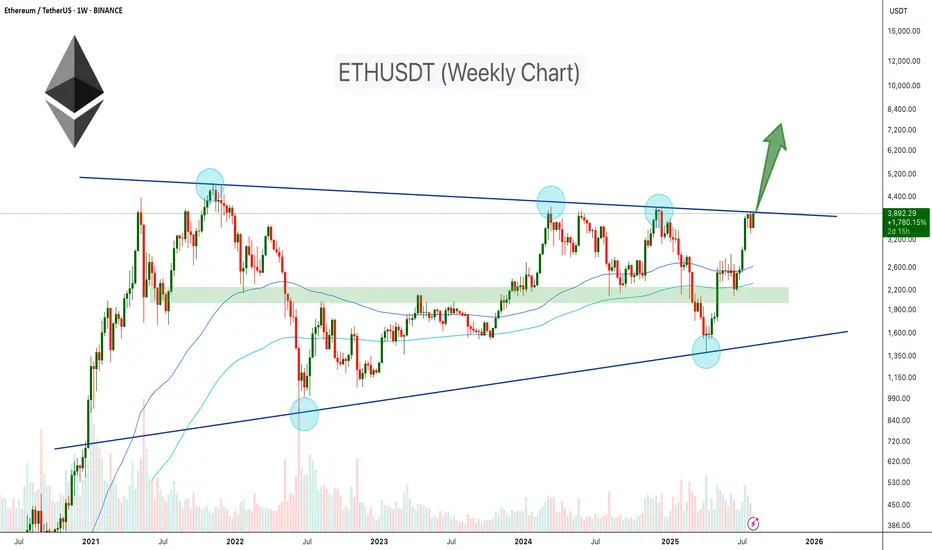
ETH Testing Critical $4K Resistance!BINANCE:ETHUSDT is trading inside an ascending triangle on the weekly chart, with price compressing between the resistance line and a rising support line. After a strong rally from the $1,500 demand area, ETH has reclaimed the 100- and 200-week EMAs and is testing the triangle’s upper trendline with increasing volume.
A weekly close above $4,000–$4,200 would confirm a triangle breakout and open upside toward $6,000–$7,500, while a rejection could send price back toward $3,200–$3,000 for further consolidation. Wait for a clear weekly close and volume confirmation.
Cheers
Hexa
BITSTAMP:ETHUSD CRYPTOCAP:ETH
Ethereum (ETH): Caught 45% of Movement in Total | $4800 Is Next3 trades we had on ETH, in combined 45% of market price movement. Now that we are at the end of the current week, we are going to look for a proper breakout from $4000, where then we will be opening yet another long with the target being at $4800.
Swallow Academy
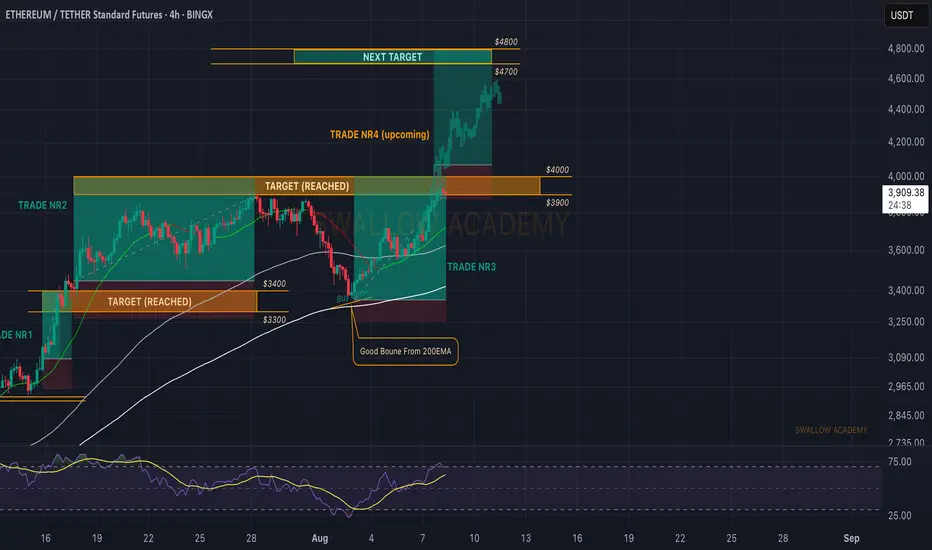
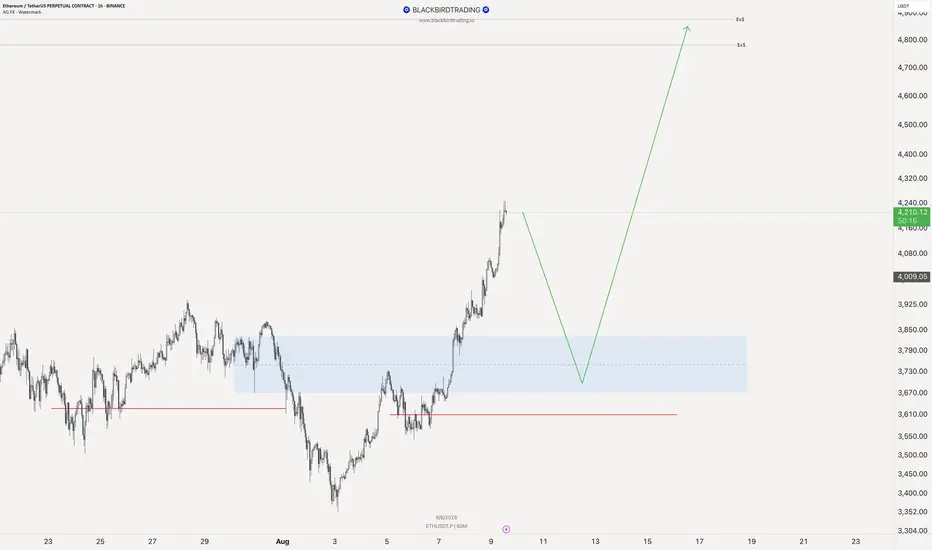
Ethereum (ETH): On Fire, Heading For Another Breakout Attempt ETH is on fire, where the price is catching the buyside momentum and probably going for that $4000K breakout attempt once again, where our trade will be closed as well (in the region of $3950-$4000).
So we wait for that zone to be reached and once we break it there, we will be looking for another entry for a long to $4800!
Swallow Academy
$ETH - New monthly Signal! Been focusing heavily on CRYPTOCAP:ETH lately — price action remains clean, easy to read, and primed for a push into new highs.
By now, most of you should already have a solid position in $Ethereum. We’ve been calling some great entry spots, and if you’re still indecisive… this might be your last real chance.
The $3,400 zone held strong, and in my opinion, that’s the low for the next couple of months. We’ve also just triggered a fresh monthly signal inside this massive multi-month consolidation. If you’re expecting lower prices, you might be waiting a long, long time.
I’ve been eyeing the possibility of $10K since last month’s breakout opened the gate. Keeping our analysis grounded, $7K is the realistic target we should see this year — maybe even within the next two months.
Until the signal expires or the target is hit… keep holding.
ETH ready for ATH?Might be but for now lets wait for Structure shift on H1 or H4 short it and than from the zone wait for bullish shift and kabooom...
The zone is not refined the pullback can be deep so always look for bullish market structure shift.
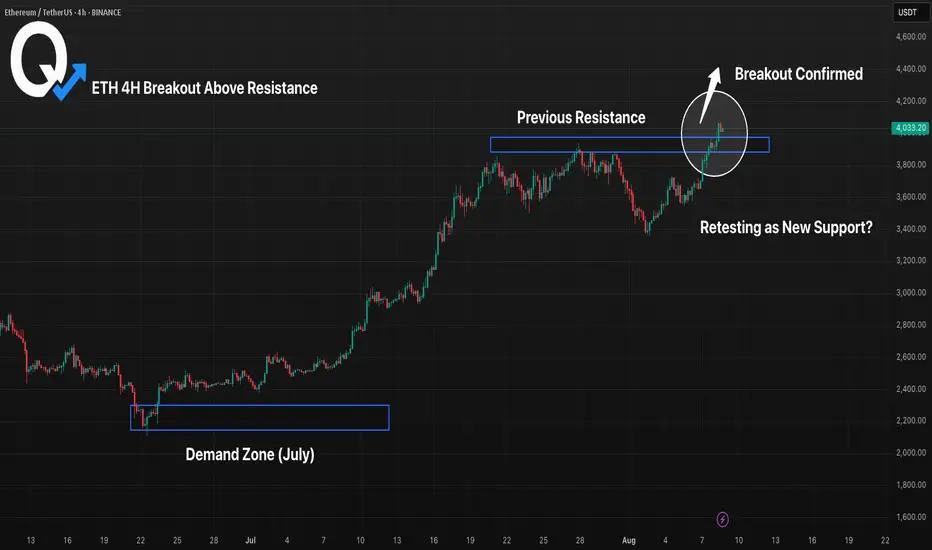
ETH 4H Breakout Above Resistance, Will Retest Hold as Support?ETH has broken out above its previous resistance around the 3,880–3,940 range, with buyers pushing price into the low 4,100s. The key focus now is whether this level can flip into support on a retest. Holding here would confirm bullish continuation toward higher targets, while a failure could send ETH back inside the prior range. Momentum remains in bulls’ favor unless this breakout is quickly invalidated.
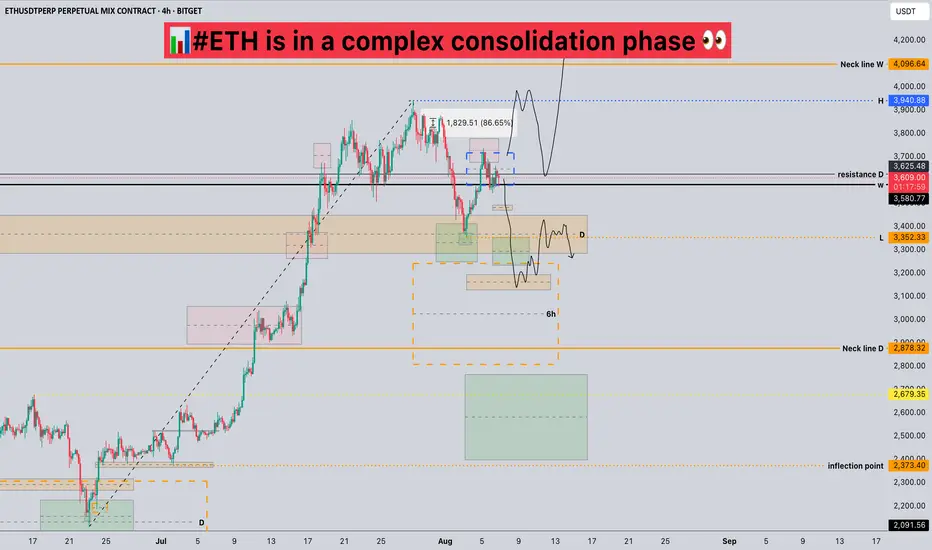
#ETH is in a complex consolidation phase📊#ETH is in a complex consolidation phase 👀
🧠From a structural perspective, the previous long uptrend has ended, so we should be wary of a deeper correction. We are currently in the middle of a complex consolidation, so there are many contradictions.
➡️Thus, if you want to participate in a long trade, you need to patiently observe whether this period of sideways consolidation can continue and a bullish structure can be established.
➡️If you want to participate in a short trade, you need to patiently wait for a break below the yellow support zone on the daily chart. This will then turn into resistance, and then look for short signals within that resistance zone.
🤜If you like my analysis, please like 💖 and share 💬
BITGET:ETHUSDT.P