Ethereum ETH at Key Resistance: Here's My Trade PlanEthereum (ETH) has maintained a fairly bullish structure overall 🟢, but price is now trading into a significant resistance level 🧱📈. I’m closely monitoring for a reaction at this zone — ideally a rejection that leads to a pullback into a key support area 🔄📉.
If ETH finds support and we get a clean bullish break in market structure from there 📊🚀, that could present a high-probability setup to the long side — contingent on price action confirming the bias. 🔍 Not financial advice ⚠️.
ETHUPUSDT trade ideas

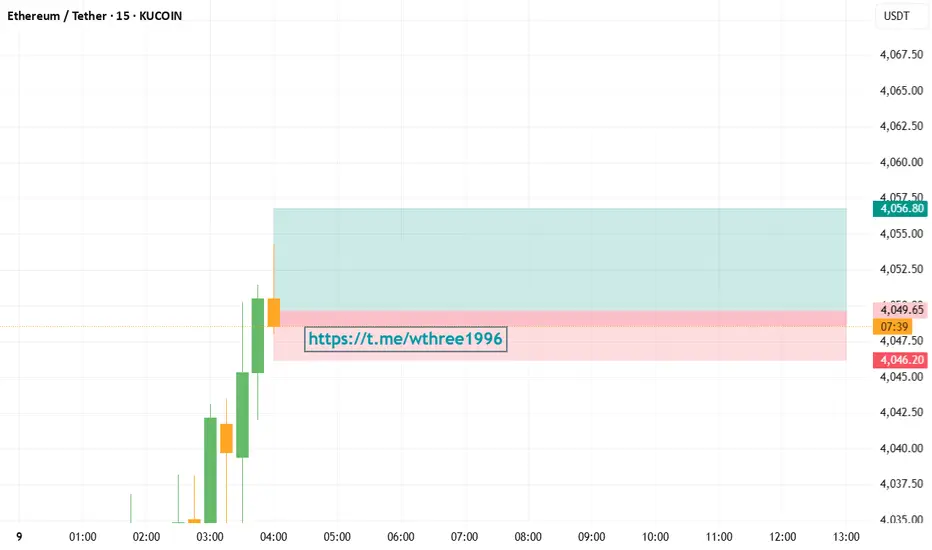
ETHUSDT LONG- Signal: LONG
- Entry: ETHUSDT 4,048.0 ~ 4,049.5
- Take Profit: 4,056.8 / Stop Loss: 4,046.2
$ETHso who all recon we deviate back here? or in this zone??
a retest of $4k will come not sure when but have marked that out
for now looking for blue line above
dominance still pissing around with the trend line
God candles pending on alts
PTSD is making me cautious but also time to put your pedal to the metal

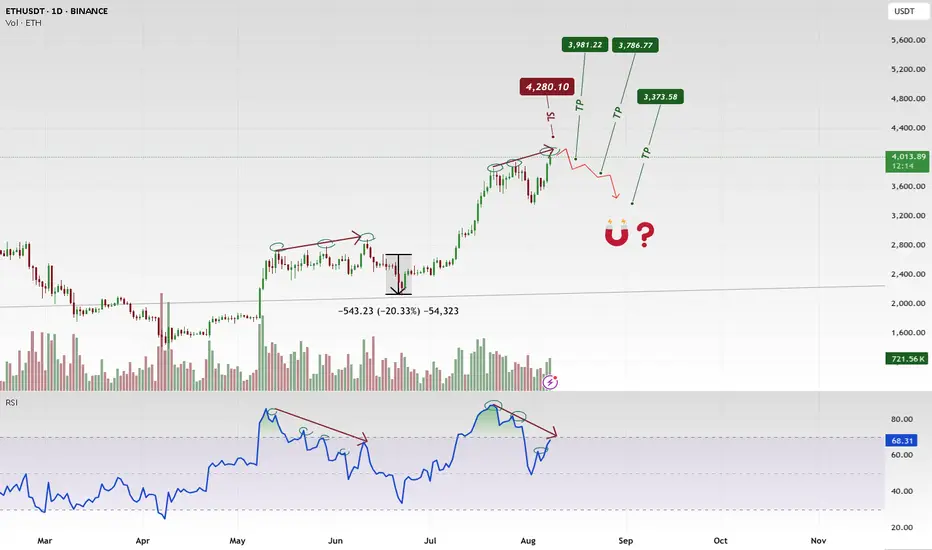
ETHUSDTBearish RSI divergence at $4,280 suggests weakening momentum. Possible correction toward $3,981 → $3,786 → $3,373. Liquidity around $3,000 could attract price before the next leg. I expect a pullback before any strong bullish continuation.
BINANCE:ETHUSDT.P
Ethereum (ETH): Seeing Struggle But Nothing Serious | Bullish AFETH still looks bullish to us, with the price staying above the local 200EMA, where last time we had a decent bounce from it.
Now, as many remember and know, we are bullish on ETH only due to 1 big reason: the liquidity of BTC has to go somewhere, and as investors have already had their fun (most of it, at least) with BTC, now they need to relocate their money and ETH is the next step.
$4000 is still our target (once again, as we already reached it once basically), and the current zone seems like a good bounce area with the 100 EMA and the middle line of the BB sitting there, in addition to lots of liquidity being distributed here (based on the order book we use)!
Swallow Academy

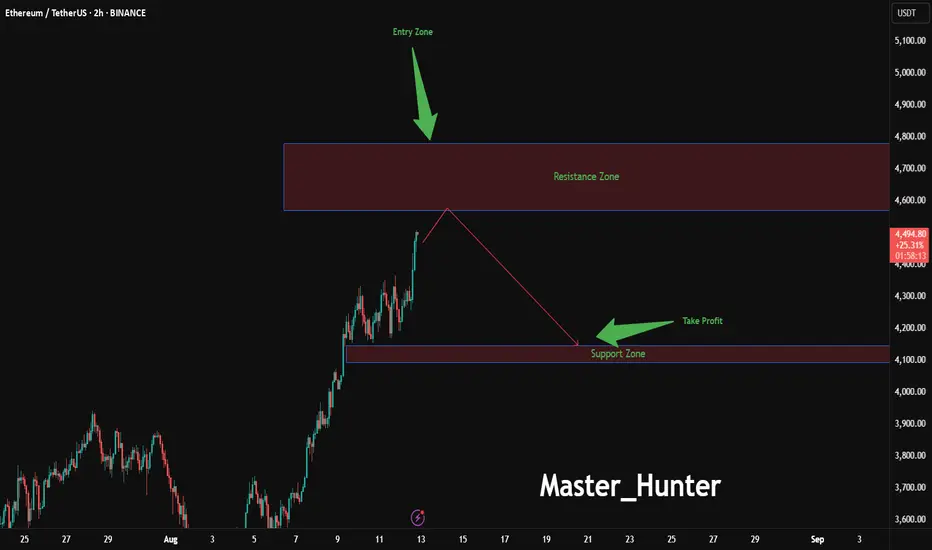
Ethereum Drop Zone Approaching?BINANCE:ETHUSDT is flashing warning signs on the 2-hour chart, with an entry zone between 4570-4780 near a critical resistance level that has capped recent rallies.
This setup suggests a potential reversal , targeting a profit zone between 4145-4093 where strong support and the 200-day EMA converge. Set a stop loss at 4780 on a close above to protect against a false breakout, keeping risk tightly controlled. A break below 4550 with increasing volume could confirm the downward move, especially if Bitcoin leads the market lower.
Keep an eye on Ethereum network upgrades and overall crypto market sentiment, as these could act as key catalysts. This trade offers a strategic opportunity for those ready to navigate the volatility—share your insights below!
#ETHUSDT #EthereumTrading #CryptoSignals #TechnicalAnalysis #TradingView #DayTrading #MarketAnalysis
#ETH #ETHUSDT #ETHEREUM #LONG #SWING #Analysis #Setup #Eddy#ETH #ETHUSDT #ETHEREUM #LONG #SWING #Analysis #Setup #Eddy
ETHUSDT.P Swing Long Analysis & Setup
Important area of the upper time frame for swing are identified and named.
This setup is based on a combination of different styles, including the volume style with the ict style.
Based on your strategy and style, get the necessary confirmations for this Swing Setup to enter the trade.
Don't forget risk and capital management.
The entry point, take profit point, and stop loss point are indicated on the chart along with their amounts.
The responsibility for the transaction is yours and I have no responsibility for not observing your risk and capital management.
🗒 Note: The price can go much higher than the second target, and there is a possibility of a 500% pump on this currency. By observing risk and capital management, obtaining the necessary approvals, and saving profits in the targets, you can keep it for the pump.
⚠️ Warning : The stop loss is dramatic and large. Place the stop loss based on your strategy and after getting entry and confirmation on the entry point behind the last shadow that will be created. (( This is just my opinion and is not meant to be 100% correct, so be careful with your capital. ))
Spot Investing : ((long 'buy' position)) :
🟢 Entry 1 : 1800
🟢 Entry 2 : 1500
First entry point calculations :
⚪️ SL : 1370 ((23.89%))
⚫️ TP1 : 4500 ((150%))
⚫️ TP2 : 5000 ((177.78%))
⚫️ TP3 : 8000 ((344.44%))
⚫️ TP4 : 10000 ((455.56%))
‼️ Futures Trading Suggested Leverages : 3-5-7
The World Let it be Remembered...
Dr. #Eddy Sunshine
4/4/2025
Be successful and profitable.
Do you remember my first Ethereum swing long signal?
My first swing long signal was provided on Ethereum, which was spot pumped by more than 100% and was profitable :

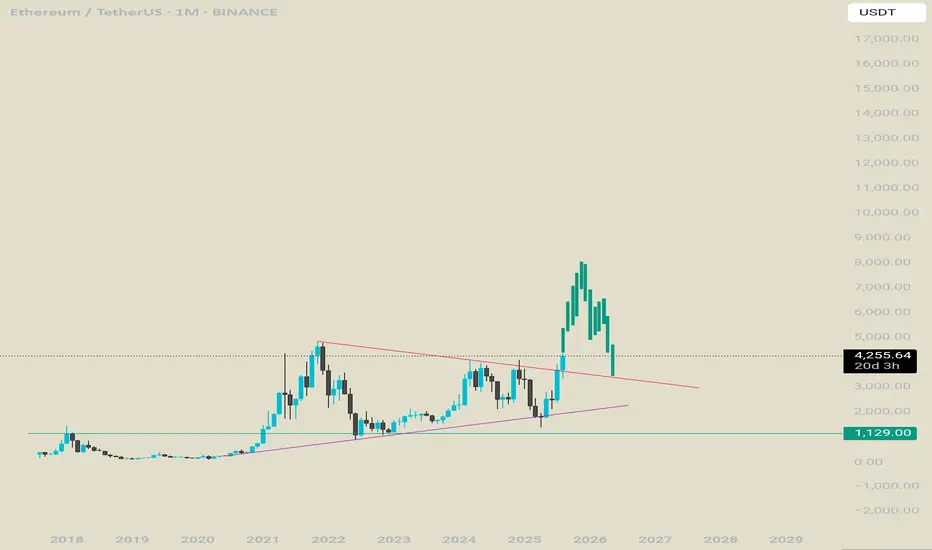
ETH 4k to 3.2kThere is a major fib here which I don't think will break.
Price has been going up consistantly to remove shorts from the market.

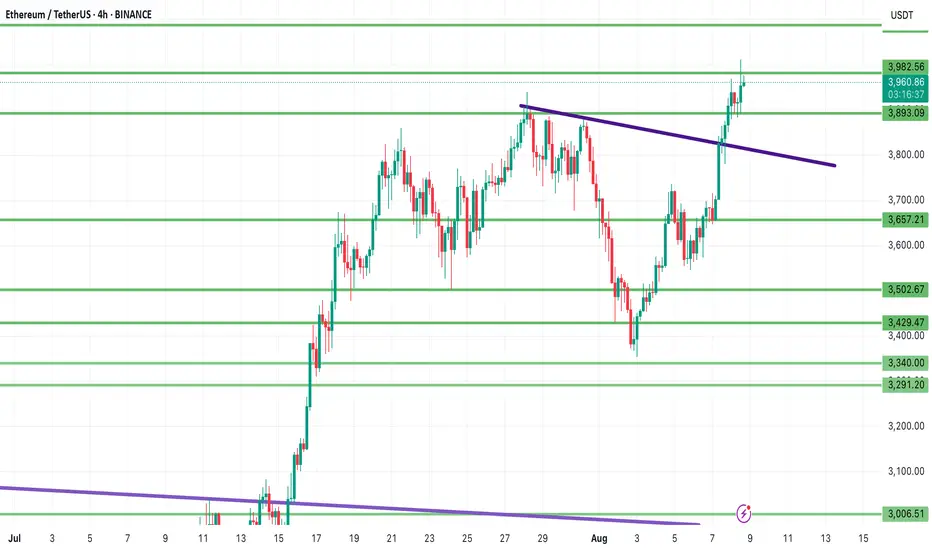
Ethereum Technical Analysis | August 8, 2025📊 Ethereum Technical Analysis | August 8, 2025
Ethereum has shown a strong bullish reaction after bouncing from the key $3,893 support zone, confirming the move with a solid bullish candle. If this support holds and further bullish signals appear, the next upside targets will be:
$4,088
$4,140
And potentially $4,291.
🔻 However, if the $3,893 support fails and price closes below it, the next important support to watch is around $3,757, which could act as a barrier against deeper declines.
📌 Summary:
Holding above $3,893 keeps the bullish scenario alive for Ethereum, while losing this level may increase selling pressure. Mark these key levels on your chart to make more precise trading decisions.
ETHER 9k ATHI think ether will continue to amaze us for the rest of the year .
This will not stop.
Monthly green candles are going to melt faces.
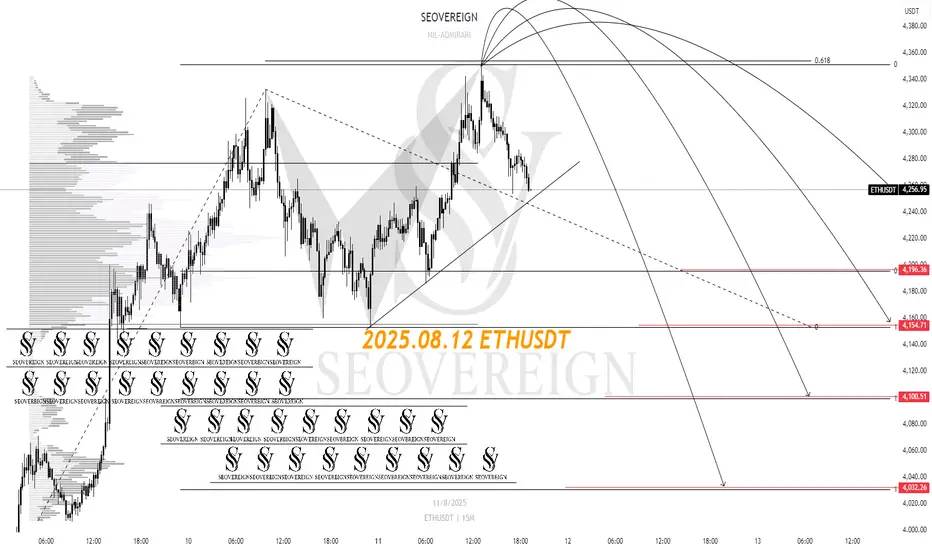
[SeoVereign] ETHEREUM Outlook – August 12, 2025I will present a short position perspective on Ethereum for August 12.
This idea is based on the premise that the direction is downward, derived from a strict counting of Bitcoin, and the specific entry point was set based on the Shark pattern.
Accordingly, the average take-profit target was set at around 4,126 USDT.
I plan to continue updating this idea as the movement unfolds.
Thank you.
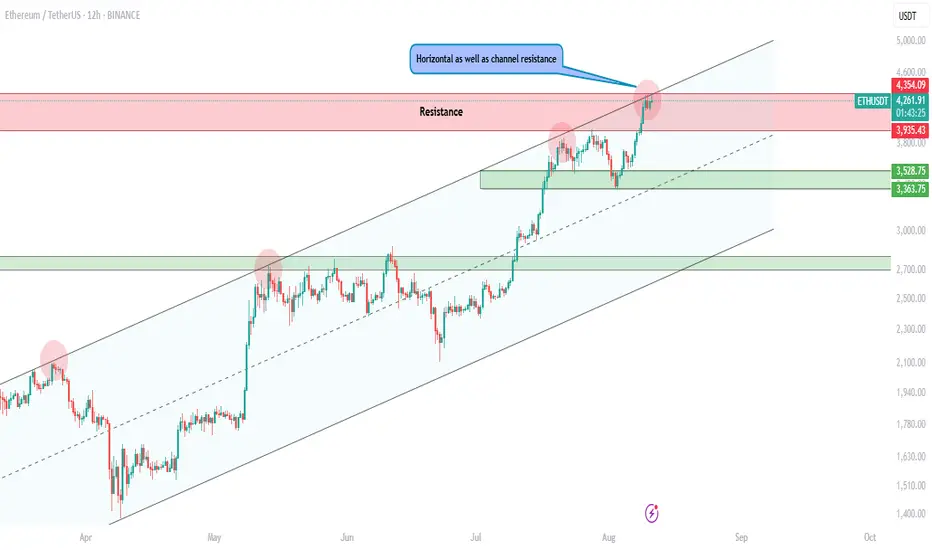
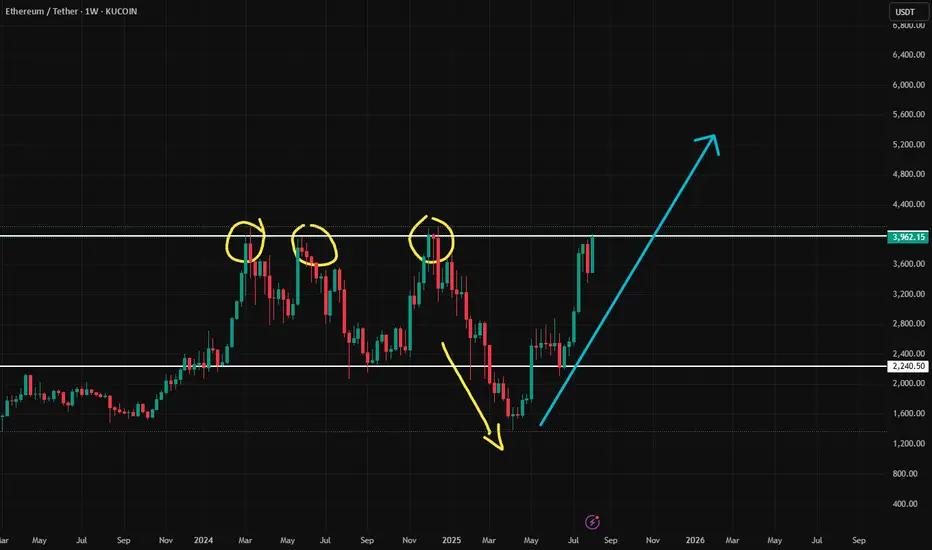
$ETH at Major ResistanceEthereum is testing a confluence zone — horizontal resistance + channel top 📏
Last few touches here led to strong rejections
A breakout could be explosive, but caution is key!
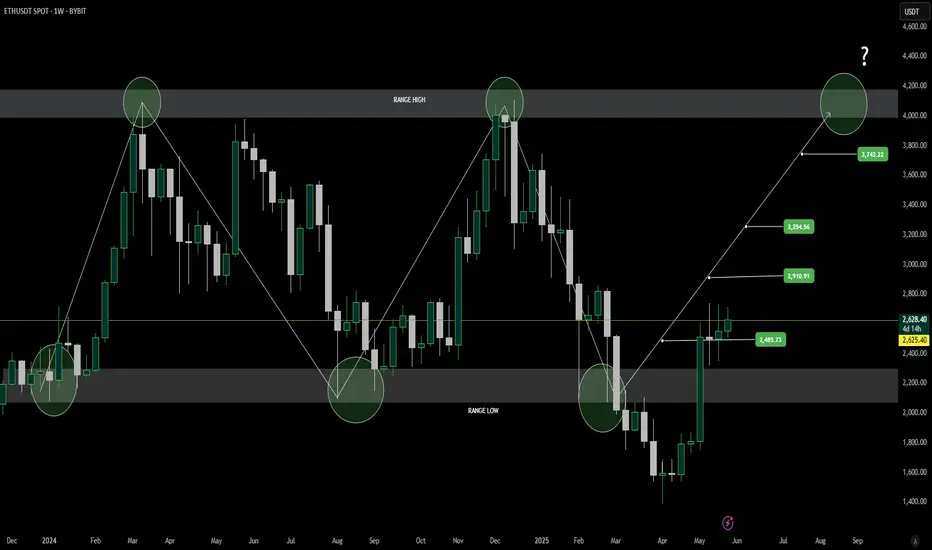
Ethereum (ETH) Weekly Outlook: Momentum Builds After Range BreakEthereum’s weekly chart continues to follow a well-defined trading range, oscillating between its historical range lows and highs. Recently, ETH closed decisively above the $2,200 level, marking a key structural break and reinforcing bullish sentiment. This move has already led to the first upside target at $2,484 being successfully hit.
Historically, Ethereum has shown a cyclical range-bound pattern — bouncing from the range low and encountering resistance at the top. With the lower boundary now acting as support and the first resistance target cleared, ETH may be entering a momentum phase with eyes on higher resistance levels.
The next major targets to watch are $2,910, $3,254, and $3,743, with $4,200 remaining the critical breakout level. A close above this zone could trigger a strong bullish continuation, potentially entering a new price discovery phase. However, failure to push past these upper resistance levels could see Ethereum revert to its range-based behavior.
The recent price structure, combined with strengthening weekly closes, provides confidence for bulls — but confirmation at each stage remains vital. Traders should monitor volume surges, price reactions at resistance, and macroeconomic catalysts that could affect sentiment.
As always, disciplined risk management is essential as Ethereum navigates these key technical zones. With a breakout above $2,200 confirmed and the first target reached, the market may be gearing up for its next move — and it's one worth watching closely.
ETHUSDTPreferably suitable for scalping and accurate as long as you watch carefully the price action with the drawn areas.
With your likes and comments, you give me enough energy to provide the best analysis on an ongoing basis.
And if you needed any analysis that was not on the page, you can ask me with a comment or a personal message.
Enjoy Trading ;)

Ethereum Weekly and Daily Charts CountsIn this post, I have laid out my Elliott Wave Count for #ethusdt for mid to long-term. This video explains why I have a bullish view for this asset overall.
The analysis is to be updated with trade ideas once the short term trajectory develops.

ETH - 1H Elliott Wave Analysis - 08.08.25Welcome to our Elliott Wave Analysis for Ethereum! :D
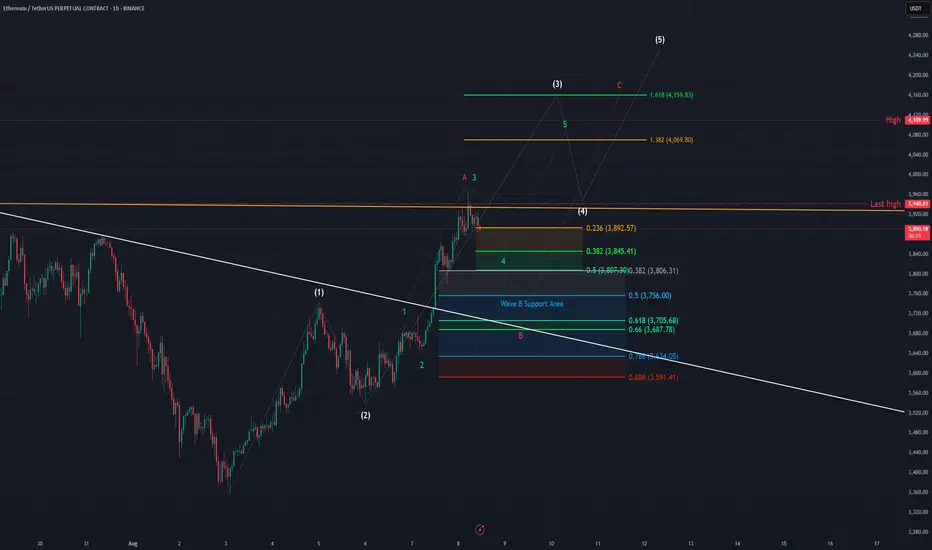
We assume that we bottomed on the 3rd of August and started an impulsive move up from there displayed as the white 5 wave move up. We assume that the white Wave 1 and 2 are finished and we are working on the 3rd Wave. We added a smaller degree count for this white Wave 3 displayed in green of which we finished Wave 1,2 and probably 3 too and could have started the green Wave 4. The support area for the green Wave 4 is between the 0.236 FIB at 3892 USD and the 0.5 FIB at 3870 USD. Technically we touched the 0.236 FIB already which means the green Wave 4 could be in.
We added the 1.382 FIB target at 4069 USD and the 1.618 FIB target at 4159 USD for the white Wave 3 where the green Wave 5 should take us to in this impulsive count.
In case we break the green Wave 4 support area and invalide the green 5 wave move up the alternative is a diagonal which means the white Wave 3 would be an ABC displayed in red instead which would allow us for a deeper retracement. For the red B Wave we added a support area between the 0.382 FIB a 3806 USD and the 0.886 FIB at 3591. There is also the white trendline which goes directly through the golden picket which could function as further support. The golden pocket is also slightly below the white Wave 1 high which could spark some buying interest if we get a deeper retracement.
We hope you enjoyed the analysis and you're now well prepared for coming price action!
Thanks for reading.
NO FINANCIAL ADVICE.
Ethereum : Watch the breakout closely
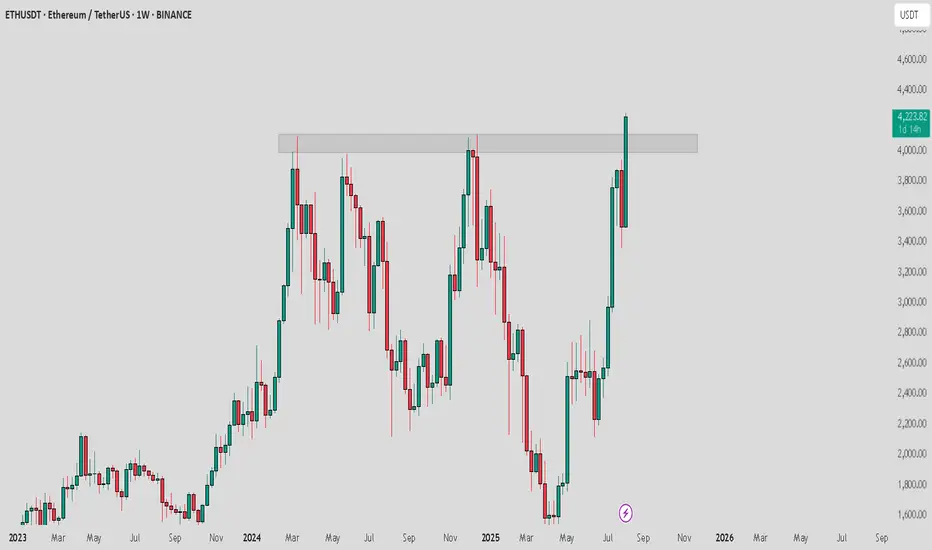
ETH / USDT is currently at a critical juncture, testing a major multi-year resistance zone between $4100 and $4200. This level has historically been a significant ceiling for the price.
The current weekly candle is attempting a breakout above this resistance.
The Key Takeaway:
If this weekly candle closes definitively above the $4200 resistance, it would confirm a major breakout. This could propel ETH towards new all-time highs, with a potential price target of $5000 and beyond. This is the "fly" scenario.
Conversely, a rejection from this level and a close back below the resistance would indicate a false breakout, and we could see the price consolidate or correct in the short term.
All eyes are on the weekly close to confirm the next major move.
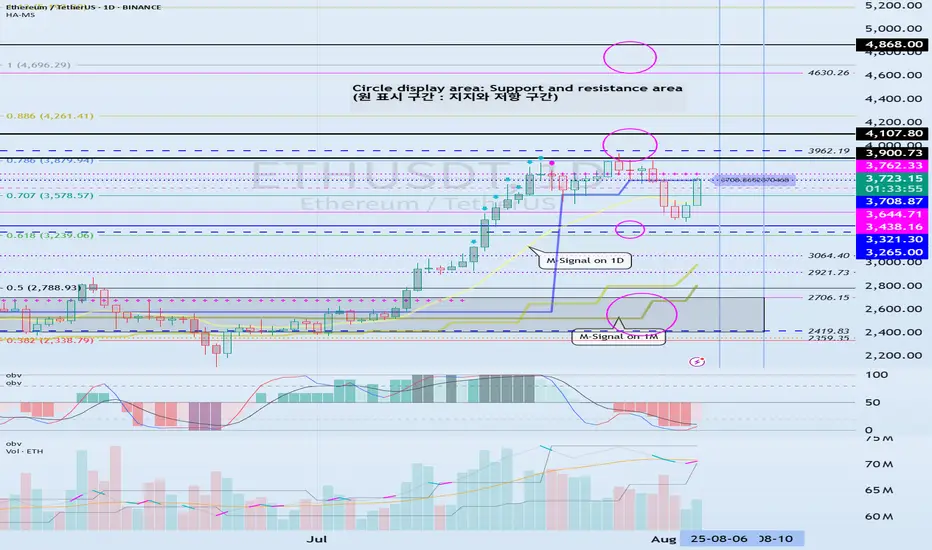
Important Trend Determination Area: 3708.87-3762.33
Hello, traders!
Follow us to get the latest information quickly.
Have a great day!
-------------------------------------
(ETHUSDT 1D Chart)
The price began to rise after breaking above the important 2419.83-2706.15 area.
This can be interpreted as the beginning of a step-up trend, with an upward breakout of the HA-High ~ DOM(60) range.
The HA-High ~ DOM(60) range corresponds to the 2581.59-2681.60 range.
This suggests that the price is currently testing whether a second step-up trend will continue or whether it will simply end as the first step-up trend.
The HA-High ~ DOM(60) range is currently 3708.87-3762.33.
Therefore, if the price rises above 3708.87-3762.33 and maintains this level through the upcoming volatility period, a second step-up trend is expected.
The conditions for this are as follows:
- The K value of the StochRSI indicator must rise from the oversold zone and show an upward trend with K > D. - The OBV indicator must rise above the High Line and maintain an upward trend.
- The TC (Trend Check) indicator must continue its upward trend. (If possible, it's best to stay above 0.)
The next volatility period for ETH is expected to last from around August 6th to 10th.
However, it's worth keeping an eye on the movements during the BTC volatility period.
-
Thank you for reading to the end.
I wish you successful trading.
--------------------------------------------------
- This is an explanation of the big picture.
(3-year bull market, 1-year bear market pattern)
I will explain in more detail when the bear market begins.
------------------------------------------------------
$ETH - Rising WedgeCRYPTOCAP:ETH | 4h
Price remains within the ascending wedge on the 4h chart, showing a triple tap on the trendline.
On lower timeframes, watching 3880 as local support for a possible bounce.
Upside levels to monitor are 4120–4215 for potential rejection, though an ideal pullback would see the lower trendline tested at 3770–3680.

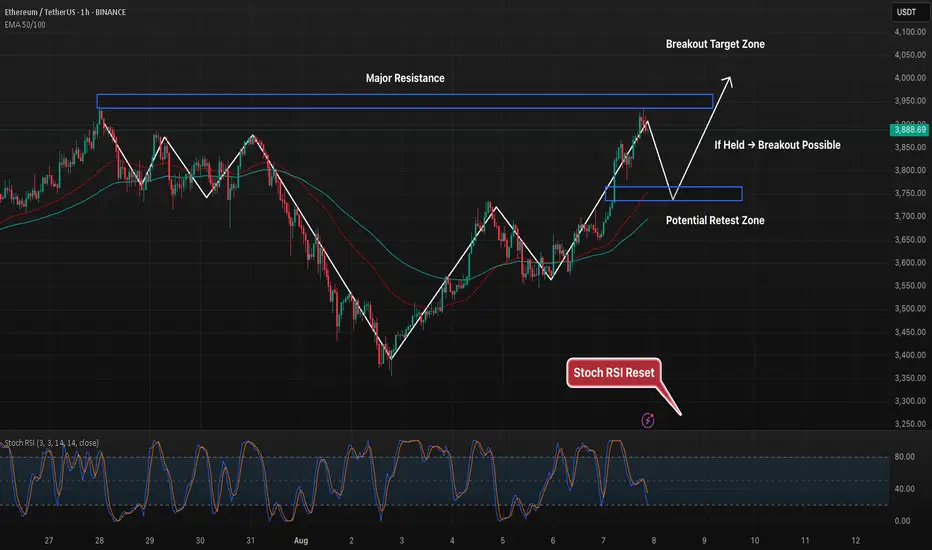
ETH 1H – Retest in Play, But Can Bulls Push Past 3.95K?Ethereum has tapped into the 3.95K resistance zone after a strong upward run, with Stoch RSI now cooling off from overbought levels. Price action suggests a potential pullback toward the 3.77K–3.78K support zone, which aligns with prior breakout structure and moving average support.
If buyers defend this retest, momentum could carry price through the 3.95K barrier and open the door for continuation toward 4K+. Failure to hold the lower zone, however, may trigger a deeper correction into the mid-3.6K range.
Key watchpoints:
– Retest of prior breakout level at 3.77K
– Stoch RSI oversold potential bounce setup
– Clear resistance overhead at 3.95K to break for further upside
ETHEREUM USDT THE BREAK of KEY SUPPLY ROOF on daily will be watched and i hope that a retest to a broken supply roof holds firmly and i expect buyers to keep the buy energy into 4999-5000k based on the current structure.
#ethusdt #ethereum

ETH Breakout Strategy
🚀 ETH Breakout Strategy 🔥
♦️ As mentioned before, the long position on ETH/USDT had to be placed before the 0.03277 breakout on ETH/BTC.
✅ Simultaneously, ETH.D broke above 12.16%, adding strong confluence to the bullish setup.
⭕️ The final confirmation came when ETH/USDT broke above 3724.00 – a high-probability entry for trend-followers.
💎 Missed it? Don’t worry.
🔜 The next long setups will be:
1. Break of 3900.00
2. Followed by the break of 4000.00 – which is probably to break impulsively and sharply.
♦️ Until ETH drops below 3300.00, I remain bullish-biased and will look only for long setups.
Even if I miss potential short-term short opportunities, it's not an issue.
❗️Why?
Because my strategy is based on aligning with the higher timeframe trend – and for me, that’s the 1D cycle, which is currently bullish.
🔥 In trading, patience with direction beats chasing every move.
🚀 If you value clean structure-based analysis, hit the rocket, drop a comment, and don’t forget to follow for more crypto insights!
