ETHEREUM ETHUSDTThe main factors driving Ethereum (ETH) price changes over the last month include:
Institutional Demand and ETF Inflows: The launch and growing adoption of Ethereum spot ETFs by firms like BlackRock, Fidelity, and Grayscale have driven significant new capital into ETH. These ETFs have attracted institutional investors, creating strong buy pressure and wider market participation, contributing to a roughly 54% rally in Ethereum over the past month.
Corporate Treasury Accumulation: Several corporate crypto treasury funds have been aggressively increasing their Ethereum holdings, with some managing billions in ETH. This corporate buying adds substantial demand and upward price pressure.
Stablecoin Growth on Ethereum: Investor optimism about stablecoins, many of which are issued on the Ethereum blockchain (e.g., Tether, USDC), has contributed to speculation and bullish sentiment. Regulatory progress like the GENIUS Act also boosts confidence in stablecoin use and proliferation, indirectly supporting ETH.
Supply Dynamics: Exchange balances of ETH have hit near decade lows, creating a supply squeeze. Combined with the Ethereum network's issuance limits and deflationary pressure from network upgrades, this scarcity supports price gains.
General Market Sentiment and Macro Environment: While overall cautious bullishness drives price up, macroeconomic factors like Federal Reserve policy, interest rate adjustments, and global liquidity also impact ETH volatility. For example, tightening financial conditions and the strength of the U.S. dollar can create temporary downward pressure.
In summary, the price changes in Ethereum over the last month are predominantly driven by increasing institutional and corporate demand fueled by ETF offerings and treasury accumulation, positive momentum from stablecoin growth on Ethereum, tight supply dynamics, and supportive technical market signals. Macro headwinds and regulatory environment continue to modulate this trajectory.
#ethusdt #ethereum
ETHUPUSDT trade ideas

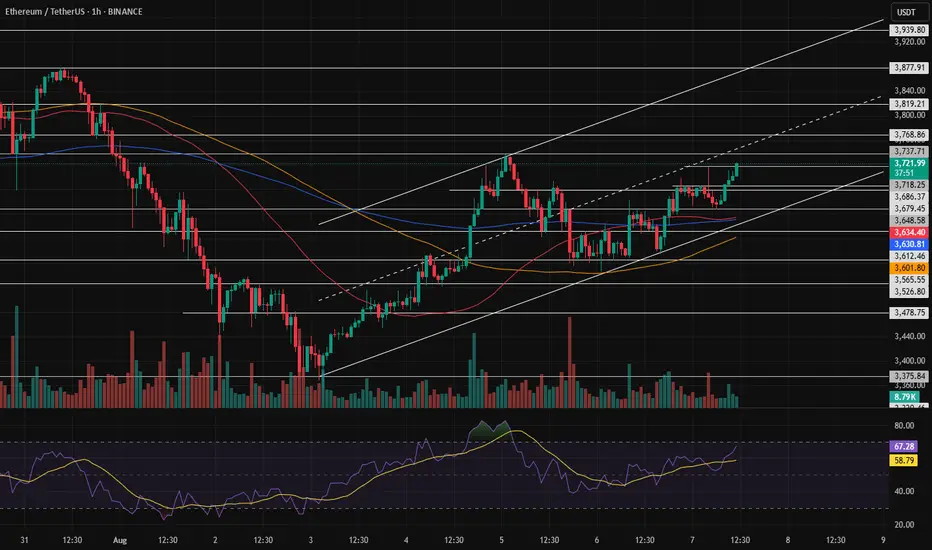
ETH 1H – Trendline + Demand Zone Converge, Will Bulls Step In?Ethereum is approaching a high-confluence zone on the 1H chart — where rising trendline support intersects with a prior demand zone that triggered the last major rally.
This area around $3,500–$3,430 represents a key test of short-term momentum and trend structure.
🔹 Technical Confluence
Strong ascending trendline from mid-July has held through 3 clean touches — and is now under pressure again.
The blue demand zone was the launchpad for ETH’s move toward $3,800, showing clear price memory.
Price is now approaching both zones while momentum is fully reset on the Stoch RSI.
🔹 Momentum & Setup
The Stoch RSI is hovering in oversold territory — just as ETH returns to structure.
A higher low in this zone would confirm buyer interest and setup a potential breakout toward $3,900+.
🔹 Scenario to Watch
A clean bounce + reclaim of local structure would confirm a bullish continuation setup.
Failure to hold this level could trigger a trendline break and deeper retracement — invalidating short-term bullish structure.
Will ETH defend this zone and continue the trend — or is a breakdown brewing?
Let me know your thoughts in the comments 👇

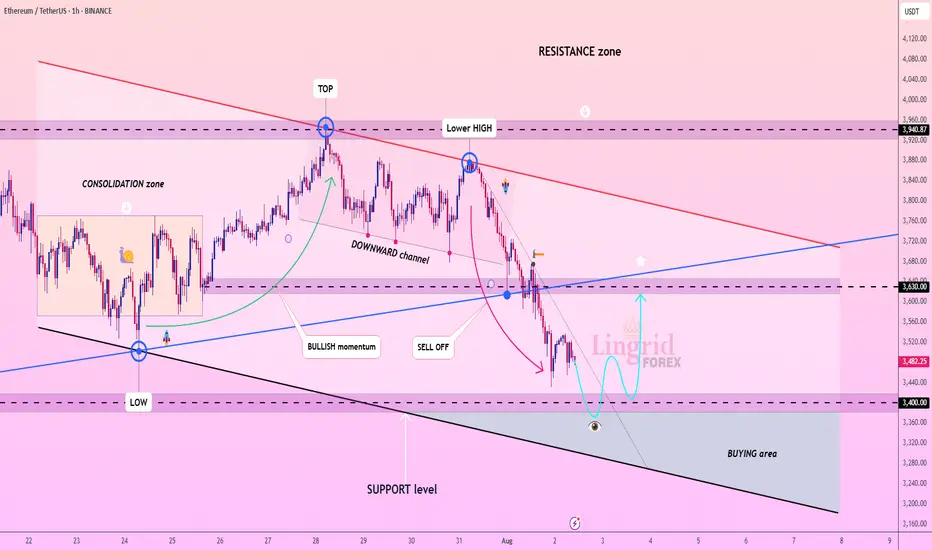
Lingrid | ETHUSDT Short-Term Move: Buying Opportunity at SupportThe price perfectly fulfilled my last idea . BINANCE:ETHUSDT is attempting a bounce after dipping into the lower boundary of its channel near the $3,400 support level. Price action has followed a descending structure with lower highs inside a broad downward channel. As long as the $3,400 zone holds, a rebound toward the mid-range resistance at $3,630 remains viable. Current positioning inside the "BUYING area" suggests momentum may flip bullish if a reversal structure forms.
📉 Key Levels
Buy trigger: Break above $3,630
Buy zone: $3,250 – $3,400
Target: $3,630 – $3,720
Invalidation: Break below $3,250
💡 Risks
Momentum still favors sellers from the recent sell-off
Failure to reclaim mid-range resistance could cap upside
Broader trend remains within a bearish channel structure
If this idea resonates with you or you have your own opinion, traders, hit the comments. I’m excited to read your thoughts!
Long trade
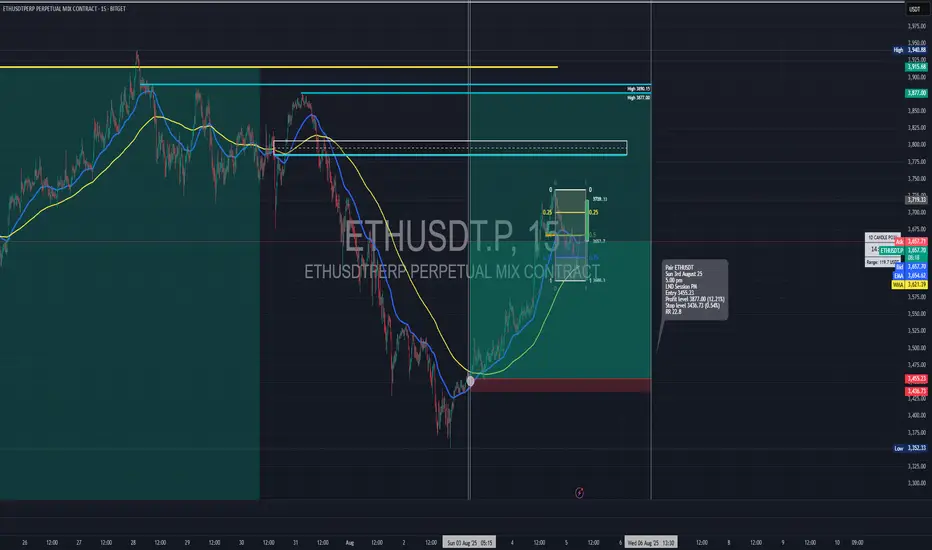
15min TF overview
🟩 Trade Type: Buyside Trade
Pair: ETHUSDT
Date: Sunday, 3rd August 2025
Time: 5:15 PM
Session: London–New York Overlap (LND Session PM)
Timeframe: 15 minutes
🔽 Entry Parameters
Entry Level: 3,455.23
Stop Loss: 3,436.73 (-0.54%)
Take Profit: 3,877.00 (+12.21%)
Risk-to-Reward (RR): 22:8
📉 Market Structure & Technicals
Trend Context:
Price reversed from a steep bearish trend and showed signs of a bullish momentum shift.
EMA/WMA Levels:
EMA (blue) and WMA (yellow) show a bullish crossover at the point of entry
Both MAs began to slope upward, confirming the trend shift.
Liquidity Observations:
Clean sweep of prior lows below 3,500 preceding entry.
Price traded back into a premium zone after reacting from a deep discount.
🧠 Narrative / Rationale
Set up Narrative:
ETH completed a strong downtrend and printed a bullish market structure shift (MSS) on the 15-minute TF. Entry was taken after price reclaimed the (POI) and confirmed a higher low.
Current Status: Trade in progress, profit levels partially hit.
TP aligns with the previous supply zone or relatively equal highs around 3,784.
Additional liquidity above 3,877–3,915 for extended targets if trade continues.
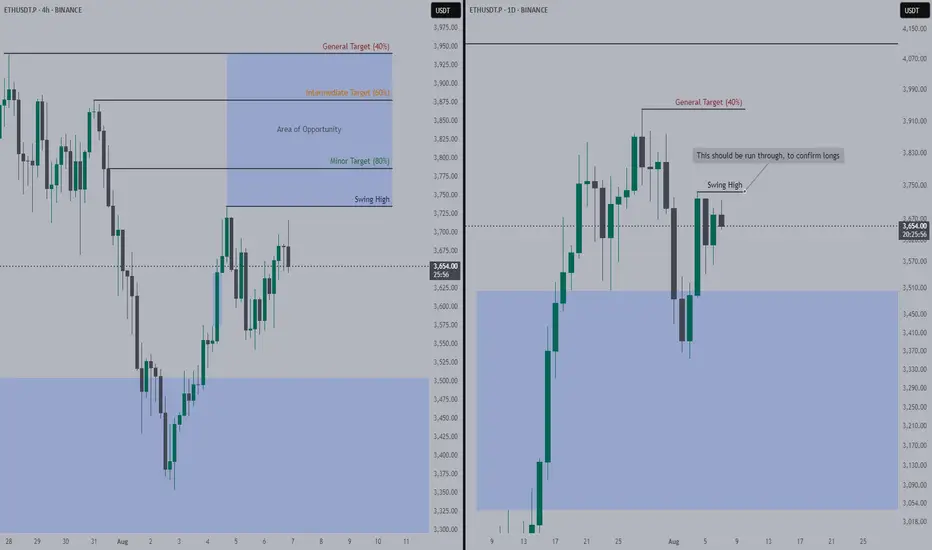
Ethereum Needs to RUN Swing High (Latest)To confirm longs and look for entries, we need price to run through Swing High.
If price closes above Swing High in 4H price action, I will be looking for longs within Area of Opportunity (AoO).
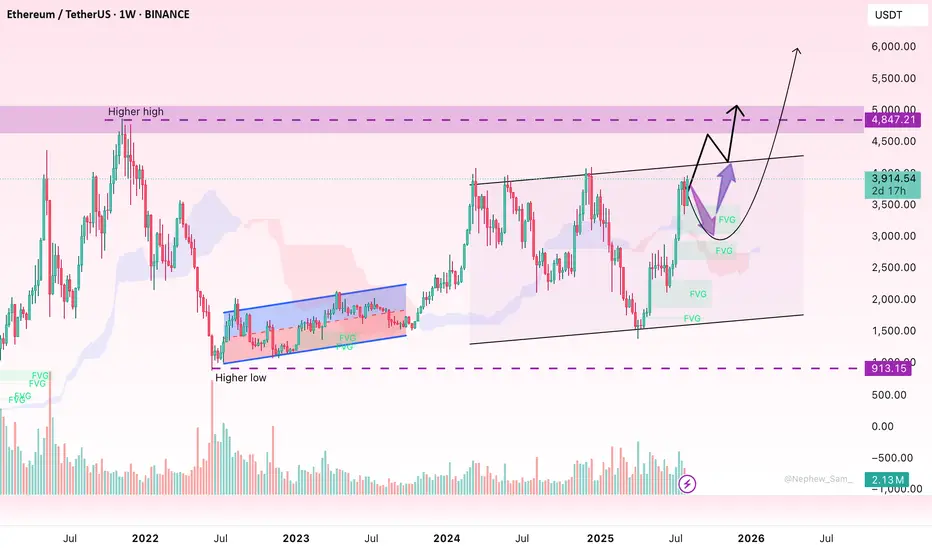
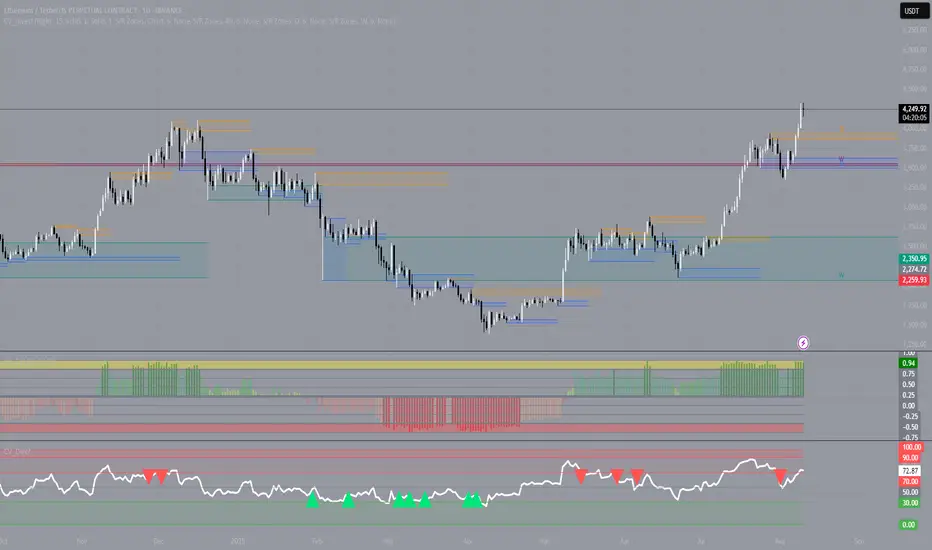
ETH/USDT – Smart Money Is In. Is a New Bull Cycle Starting?What is the market telling us? Without a doubt, Ethereum is entering a new weekly-level bullish cycle, a move that could reshape the altcoin landscape in the coming months.
🔍 Trend Confirmed – Breakout from Ichimoku Cloud & Key Resistance
ETH has just broken out of a multi-month accumulation phase around the $2,000–$2,400 range. On the weekly timeframe, price has clearly broken above the Ichimoku Cloud and pierced through the major resistance zone that had previously capped upside moves.
This is not a technical bounce — it’s a confirmed trend shift into a mid-to-long-term uptrend.
💡 Key Insight: Steady Volume Growth = Smart Money
Unlike FOMO-driven rallies, this breakout is accompanied by steady, non-explosive volume, indicating smart money accumulation rather than speculative chasing.
🧱 Fair Value Gaps (FVGs) – Zones You Can’t Ignore
On the weekly chart, ETH has printed multiple Fair Value Gaps — price zones where strong buying pressure left the market no time to fill the gaps.
Key FVG zones to watch:
🔹 $2,400 – $2,700
🔹 $2,900 – $3,200
🔹 $3,400 – $3,700
These are not just support zones — they are “whale footprints”. Price often reacts to these levels and they offer ideal re-accumulation zones before the next leg up.
📈 Clear Trend Structure – Higher Highs, Higher Lows
ETH is currently trading around $3,910, a price level that hasn’t held steady since early 2022. But now, things are different:
✅ Trend shift confirmed – Higher Highs & Higher Lows
✅ Volume supports the move
✅ Market sentiment is clearly improving
If ETH holds above $3,700, the next target could be $4,800 – $5,000. In a more bullish scenario, we may even see a return to all-time highs, especially if Bitcoin continues to lead the market.
🧠 Trading Strategy: No FOMO – Wait for a Better Entry
❌ I’m not buying into $3,900+.
✅ I’ll wait for ETH to pull back into the $3,400–$3,600 range — a confluence zone including:
Strong FVG
Previous support
Ichimoku Cloud
Bullish structure
If clear confirmation shows up here (e.g., increasing volume, pinbar, bullish engulfing), I’ll open a medium-term long position targeting the $5,000 zone.
At that level, the risk:reward is extremely attractive.
💬 Final Take: This Is Not Just a Technical Bounce
Looking at the full picture — structure, volume, smart money flow, and sentiment — this is not a typical technical rebound. It's the early phase of a new bullish cycle, led by Ethereum.
And as I always say:
"Altcoins don’t rally because of FOMO — they rally because Ethereum leads the charge."
👉 What price zone are you watching ETH at?
Do you have a strategy for this wave?
Drop your thoughts in the comments — I’d love to hear your view!
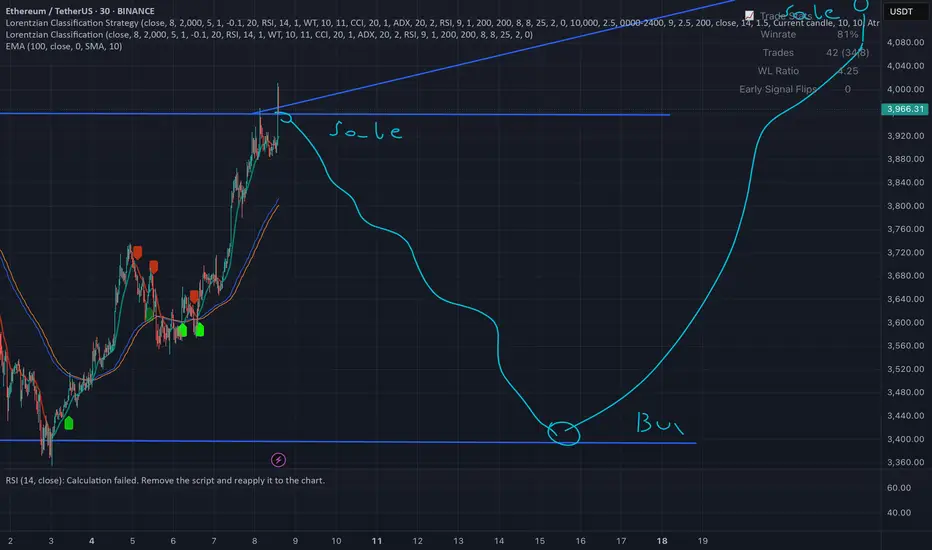
ETH updateIF you remember this:
Current chart show prospective, not targets (sure they are), but step-by-step)
Good luck
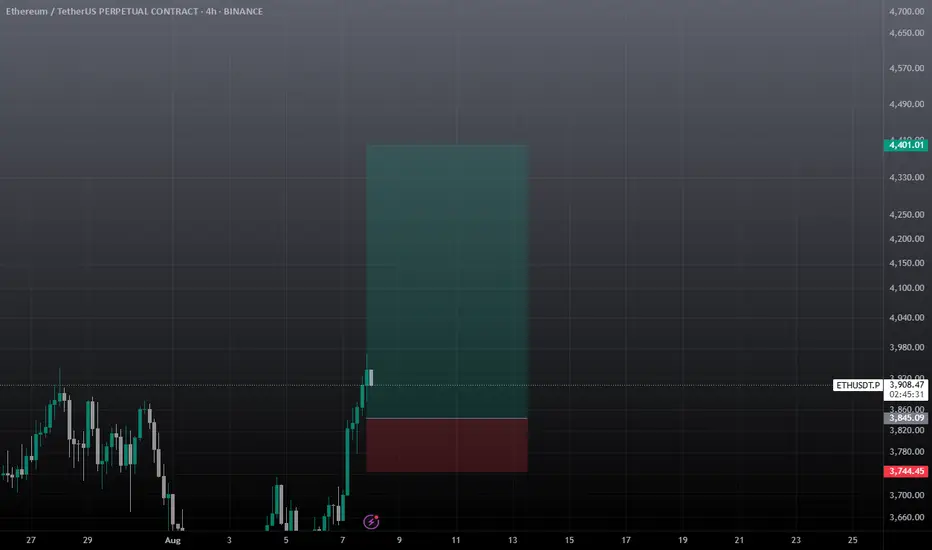
Can Ethereum Give Us Profit Before the Next Run to 4400?It feels safe to bid for BINANCE:ETHUSDT at 4100 right now and ride it up to 4400.
I will place my SL at 3.8k
Ignore this trade update if you don't know about position sizing and order scaling.
Let's see if this will cook.
What are your thoughts about this analysis? Let me know in the comments section.
If you like the analysis, like it and follow me for more trade updates.
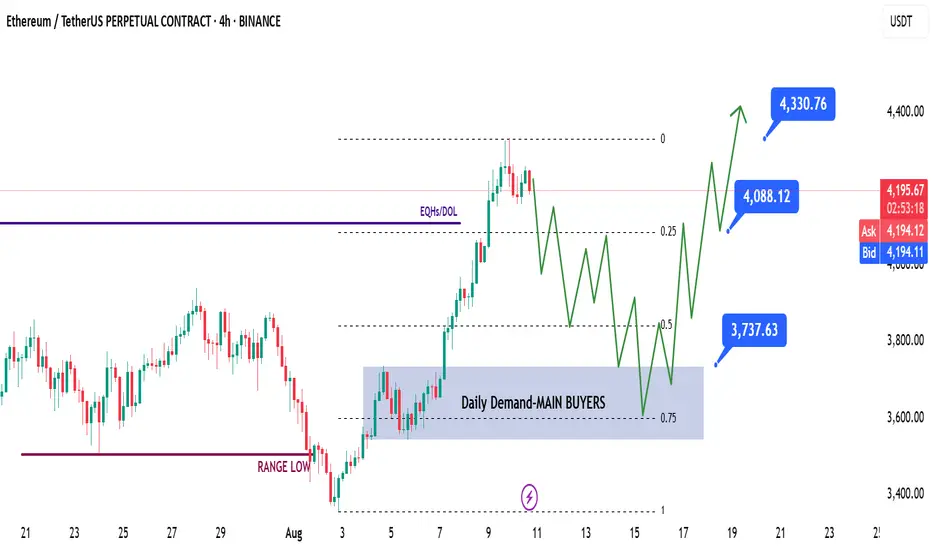
ETH | Swing Long IdeaETH | Swing Long Idea
📊 Market Sentiment
Overall sentiment remains bullish, supported by expectations of a 0.25% rate cut in the upcoming FOMC meeting. A weakening USD and increased risk appetite across global markets are creating favorable conditions for further upside in crypto assets.
📈 Technical Analysis
Price has run the HTF liquidity level at $4100.
While the breakout above $4100 was aggressive, it appears price may require additional liquidity before pushing higher.
This idea focuses on a possible ETH retracement and continuation pattern over the coming days to weeks.
📌 Game Plan
If a deep retracement occurs, I’ll be watching the 0.5 Fibonacci discount zone and the 0.75 retracement level for optimal entries.
Key focus: daily demand zone at $3750 — ideally aligned with the 0.75 retracement.
I won’t wait for an exact touch of the 0.75 level; instead, I’ll watch for strength and a clear break of structure to trigger entries.
🎯 Setup Trigger
Look for a 12H–4H break of structure shift after the daily demand zone at $3750 is hit.
📋 Trade Management
Stoploss: 12H–4H swing low that caused the break of structure
Targets:
TP1: $4088
TP2: $4330
TP3: $5000 (possible swing point)
Will trail stops aggressively to secure profits as price moves in my favor.
💬 Like & follow if you found this breakdown helpful — more setups coming soon!
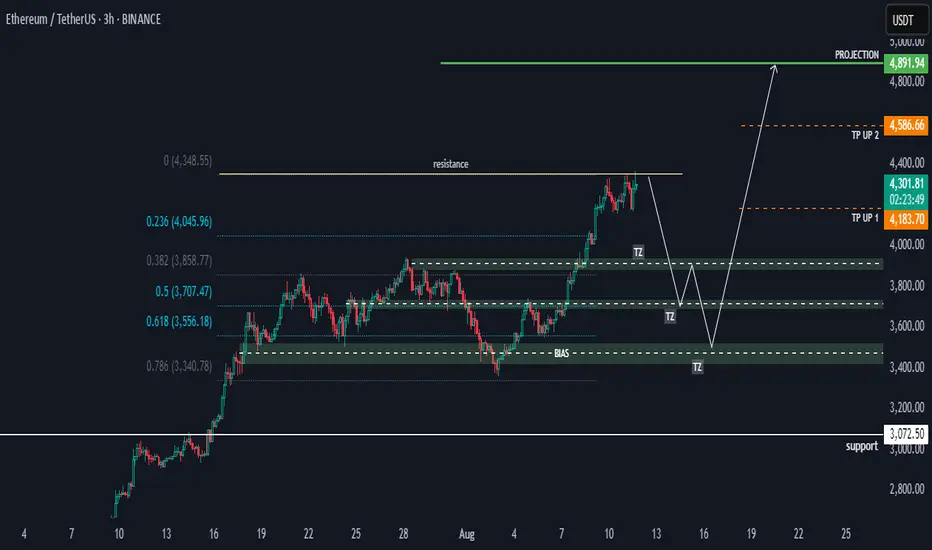
Ethereum (ETHUSDT) Momentum AnalysisHi there, let's take a look at ETHUSDT.
📱 Technical Overview:
- *Current Price: Approximately 4285, approaching a significant resistance zone.
- *Resistance Level: Near 4348, which has historically acted as a resistance level where price struggles to break through.
- *Support Zones: Identified around key Fibonacci retracement levels as follows:
- 0.236 at 4046
- 0.382 at 3859
- 0.5 at 3707
- 0.618 at 3556
- 0.786 at 3340
🎙️ Outlook:
- The price is consolidating near resistance right now, suggesting a potential bullish breakout or a rejection leading to a pullback due to the pin-bar price rejection.
- Fibonacci retracement levels indicate critical support zones, where price may find stability in those areas if a drop in prices occurs.
- Prior to starting an upward trend again, I anticipate a potential decline towards the support at about 3800.
- The projected targets (TP1 and TP2) suggest a bullish scenario where, following a retracement, Ethereum could rally towards 4890.
🧩 # Potential Scenarios:
1. *Bullish Breakout: If ETH manages to clear the resistance at 4348 with strong volume, then a rally towards higher targets could occur.
2. *Pullback and Rebound: If the resistance holds, then we can anticipate a drop to support levels near 3857 or 3556. A strong bounce from these levels could set the stage for future upward moves.
3. *Failure to Hold Support: A break below support zones could lead to deeper corrections; thus, it will need monitoring.
Happy Trading
Khiwe.
Not trading advice.
ETH | Ethereum Game Plan - Swing Long IdeaETH | Ethereum Game Plan - Swing Long Idea
📊 Market Sentiment
Market sentiment remains bullish, supported by expectations of a 0.25% rate cut at the upcoming FOMC meeting. The weakening USD and rising risk appetite across global markets are favoring crypto assets in particular.
📈 Technical Analysis
Price swept the range low (Weekly Fair Value Gap), resulting in a deviation.
It then aggressively reclaimed higher levels and closed above key resistance.
A 12H demand zone was formed during this move.
We’re now seeing a retracement towards that 12H demand zone.
📌 Game Plan
I’m looking for price to hit the 12H demand zone at $3,530 and show a strong reaction.
This level is also below the 0.5 Fibonacci retracement, placing it in the discount area — an ideal entry zone for me.
🎯 Setup Trigger
After price taps the demand zone, I want to see a 1H–4H bullish break of structure to confirm the reversal before entering.
📋 Trade Management
Stoploss: Below 1H–4H swing low
Targets:
• TP1: $3,872
• TP2: $4,090
I’ll trail my stop to lock in profits aggressively as price moves in my favor.
💬 Like, follow, and comment if this breakdown supports your trading!
More setups and market insights coming soon — stay connected!

Altcoins and Altseason:How to Understand and Use Them in Trading
The cryptocurrency market has long moved beyond Bitcoin’s monopoly. Today, it consists of thousands of digital assets, each with its own technology, goals, and economic model. Among traders, two terms are frequently used — “altcoin” and “altseason,” and understanding them is essential for anyone aiming to earn consistently in crypto.
An altcoin is any cryptocurrency other than Bitcoin. The first alternative coins appeared in 2011, when developers sought to improve BTC by offering faster transactions, new algorithms, or additional features. Today, some of the most well-known altcoins include:
Ethereum (ETH) — the leader in smart contracts and decentralized applications.
Ripple (XRP) — focused on fast international transfers.
Cardano (ADA) — known for its scientific approach and energy efficiency.
Solana (SOL) — prioritizes ultra-fast transaction speeds.
Polygon (MATIC) — tackles blockchain scalability issues.
Altseason refers to a period when altcoins become the main growth drivers of the market, outperforming Bitcoin in both speed and volume of price gains. During this time, investors often take profits from BTC and move capital into other projects. As Bitcoin’s dominance declines, space opens up for alternative coins to rally. In such phases, traders shift their attention to promising technologies and big news stories, with many altcoin charts showing growth that far exceeds that of Bitcoin.
For a trader, altseason is not just a flashy market phase — it’s a period of maximum opportunity. With the right analysis, it can deliver returns that are hard to achieve during normal market conditions. However, the potential for high profit also comes with high risk. The altcoin market is known for sharp volatility, and choosing the wrong asset can result in losses just as significant as potential gains.
That’s why it’s crucial not only to understand what altcoins and altseason are but also to recognize them in time. This requires a combination of fundamental and technical analysis, tracking Bitcoin dominance trends, and using reliable trading tools that can spot shifts in market cycles. With a thoughtful approach, altseason can become the window of opportunity that opens the door to new results in trading.
The 3738.28 zone is the golden pointAfter confirmation in this price zone, we can say that the path to 3800 becomes much easier and more likely, making the move toward 4000 more feasible. However, it's still too early to make decisions about that, so for now, we're only analyzing up to 3800.
ETH – Possible Pullback After Sharp Rally | Watching Buy ZoneAfter a strong breakout toward the 4014 USDT area on ETH/USDT, we might be seeing signs of a local top forming. Based on technical analysis, I’m watching for a potential pullback to the support zone around 3447 USDT, which is where I’ve placed a Buy limit order.
Key levels:
Sell zone: 4000–4100 USDT (already reached) SELL NOW
Buy zone: around 3447 USDT (waiting for possible dip)
Strategy: Buy the dip and prepare to sell on the next upward move
🔁 Repeating the cycle: Buy low – Sell high
⚠️ This is not financial advice – just my personal market view.
Let me know in the comments if you’re watching similar levels or using the same kind of strategy.
Trade active
Trade was activated
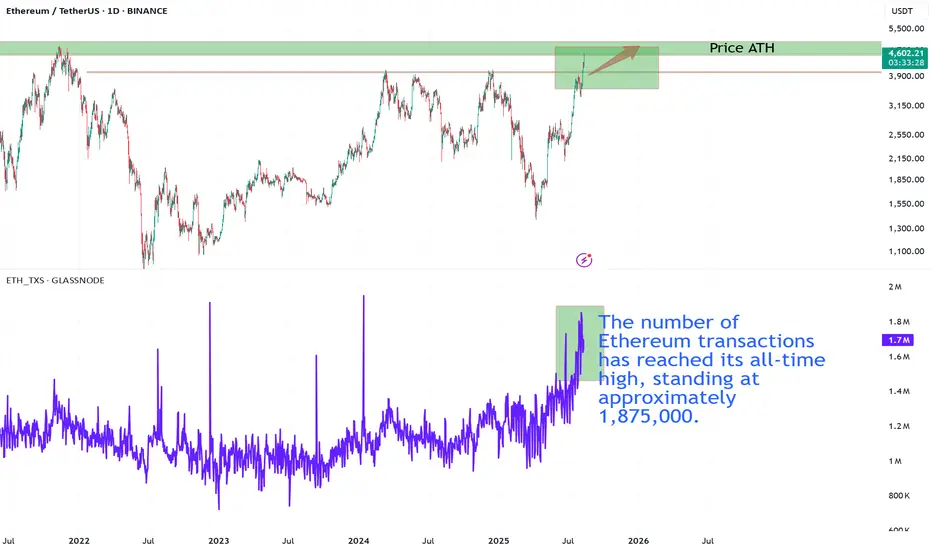
Ethereum Approaching Price ATH While Transaction Count Hits RecoEthereum’s network activity has surged to unprecedented levels, with daily transactions reaching an all-time high of approximately 1.875 million. This parabolic rise in on-chain activity reflects heightened user engagement and growing demand for block space.
On the price chart, ETH is now testing the critical resistance zone just below its historical all-time high (~$4,750). This is a confluence point — price is approaching a major supply area, while network fundamentals show peak activity.
Key points to watch:
A breakout above $4,750 with sustained transaction momentum could ignite a price discovery phase.
If sellers defend the ATH zone, short-term consolidation or a pullback toward $3,950 support is likely.
On-chain highs combined with price stagnation could indicate network overextension, warranting caution.
In summary, Ethereum is sitting at a junction where record network usage meets historical price resistance — the next few sessions could determine whether we see a decisive breakout or a rejection.
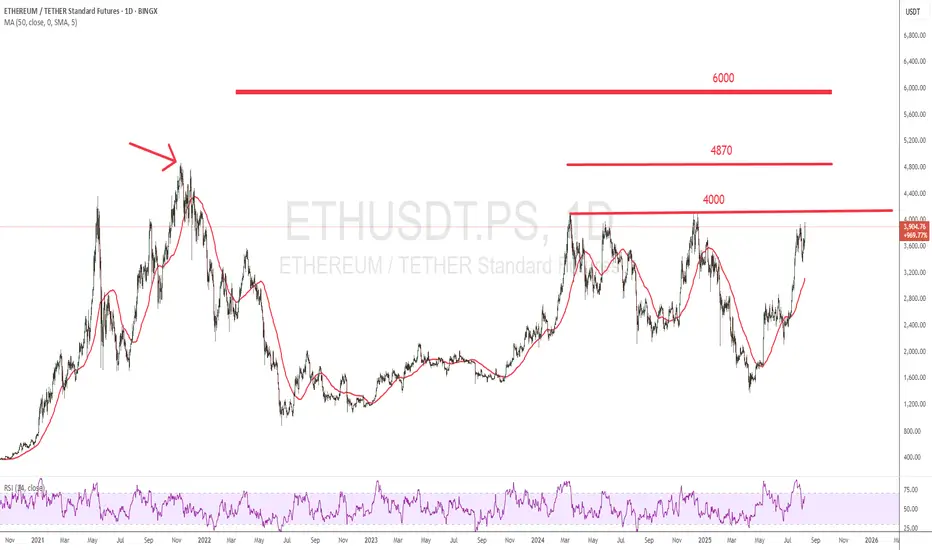
ETHEREUM THE DAILY KEY DESCENDING TRENDLINE HAS BEEN BROKEN,ethusdt is seeing buying momentum and if they keep this pace ,the trend could hit all time retest and a possible breakout.
#ethereum #ethusdt #cryto

ETHUSDT- Signal: LONG
- Entry: ETHUSDT 4,012.8 ~ 4,014.2
- Take Profit: 4,019.6 / Stop Loss: 4,010.1

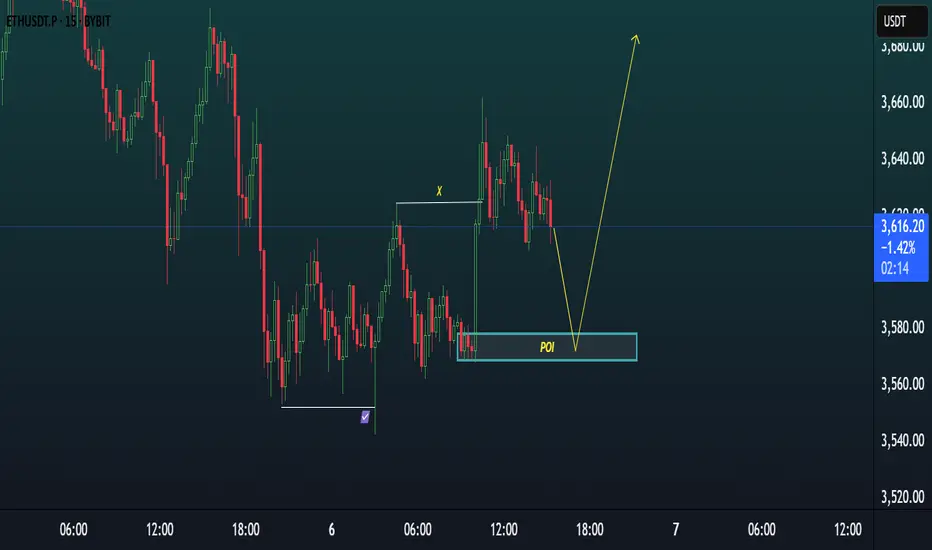
ETH/USDT 15m SETUP.ETH/USDT 15m Setup 🚀
Price is approaching a clean POI (Order Block + Imbalance zone).
Expect a short-term dip into the zone followed by a bullish reaction.
📌 Trade Idea:
Wait for price to tap the POI
Look for bullish confirmation
Target upside continuation after liquidity grab & structure shift
High probability long setup incoming!
Ethereum Long Trigger Just Got Valid — Don’t Miss This SetupHey, it’s Skeptic from Skeptic Lab.
In this breakdown, we’re looking at a fresh long opportunity on Ethereum after a clean 45% move from our last trigger.
I’ll walk you through the daily and 4H timeframes, explain why the correction looks weak, and where the next breakout trigger is setting up.
Plus, I’ll show you how ETHBTC can help confirm the move and improve your risk/reward.
If this gave you clarity or value, give it a boost — and I’ll catch you in the next one.
Disclaimer: This is not financial advice. Always do your own research before making any trading decisions.

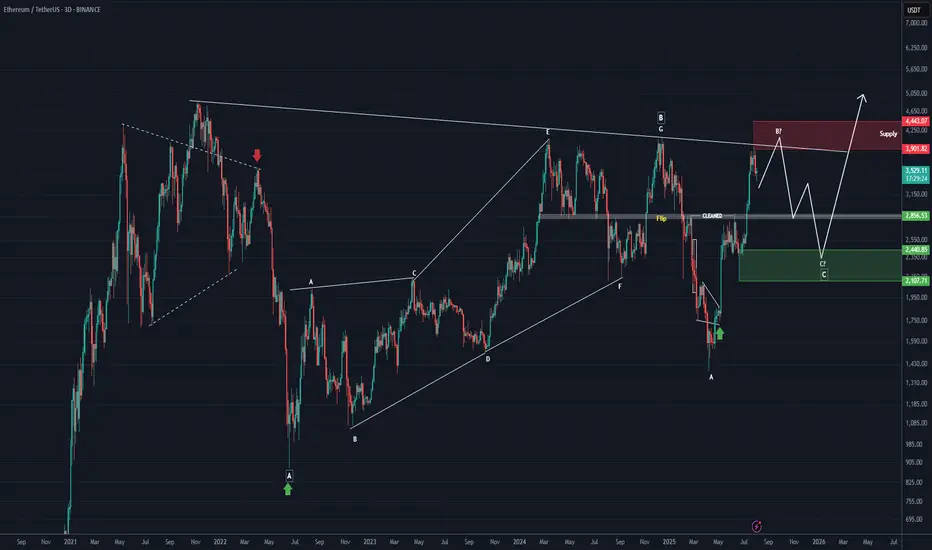
ETH Looks Bearish (3D)Ethereum approached the weekly trendline and experienced a correction. It seems likely that we may see one more push upward to create a false bullish sentiment on this coin. There is even a possibility of a fake breakout above the descending trendline. However, before any major move, a significant correction toward the green zone appears likely | after which the main bullish move is expected to occur.
On higher timeframes, this is currently our outlook on Ethereum.
A daily candle closing above or below the invalidation levels would negate the current buy or sell bias.
For risk management, please don't forget stop loss and capital management
Comment if you have any questions
Thank You
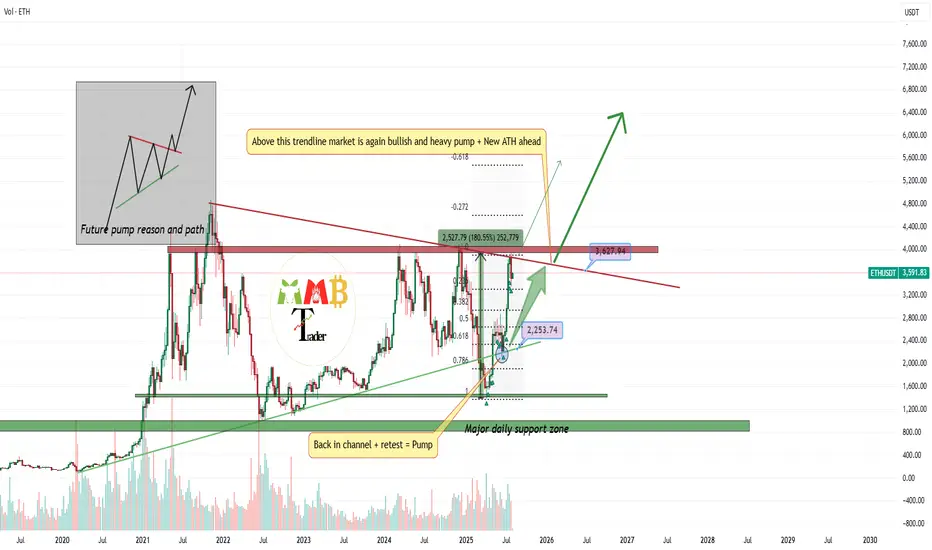
The bull market here will continue if the price break 4K$ As we can see on chart two major resistances which are reason of killing BINANCE:ETHUSDT each time are the red trendline and also the 4K$ resistance zone and soon i believe ETH now has the power to break this resistances and start new high volume pump the targets like 5000$ and new ATH.
DISCLAIMER: ((trade based on your own decision))
<<press like👍 if you enjoy💚
eth swing buy / long setup eth well bounced from weekly fvg, now it's heading towards 4.1k double top liquidity. wait for the entry and must use SL, If candle closes below sl on 1hr tf then close on entry, otherwise wick doesn't matter. Maybe eth take 3750 liquidity first then fly high.
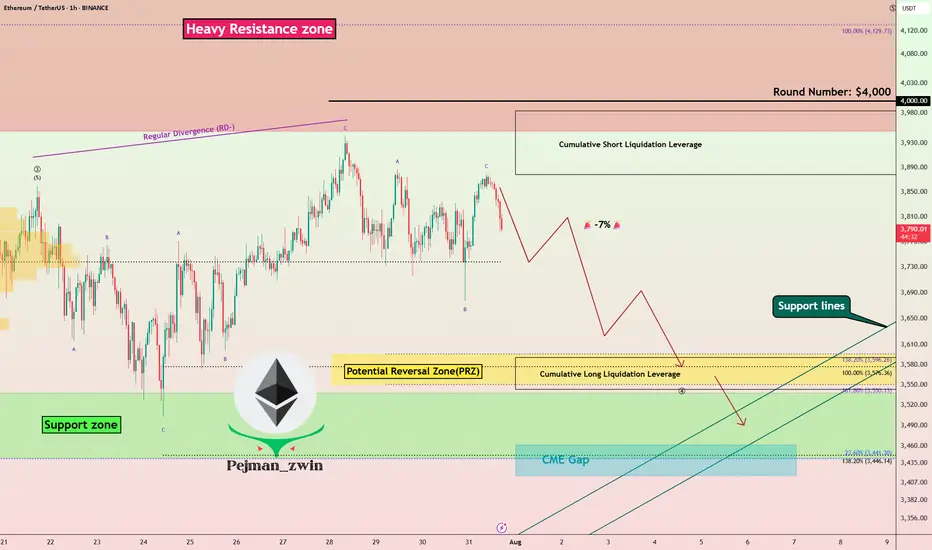
ETH at Critical Resistance + Liquidation Zone | Time to Short?Today I want to analyze Ethereum ( BINANCE:ETHUSDT ) on the 1-hour time frame . Is there a short position opportunity?
Please stay with me.
Ethereum is currently trading near a Heavy Resistance zone($4,390-$3,950) , Cumulative Short Liquidation Leverage($3,983-$3,878) and the $4,000 ( round number ). $4,000 could be a psychological number to sell .
In terms of Elliott Wave theory , Ethereum appears to have completed the main wave 3 at $3,860 and is currently completing the main wave 4 . The main wave 4 could have a Double Three Correction(WXY) or Expanding Flat(ABC/3-3-5) , with the Expanding Flat structure being more likely .
One of the reasons why shorting Ethereum could be better than shorting Bitcoin right now is that ETHBTC ( BINANCE:ETHBTC ) is currently trading above the ascending channel and is likely to correct to Fibonacci levels .
Also, we can see the Regular Divergence(RD-) between Consecutive Peaks.
I expect Ethereum to drop to at least the Potential Reversal Zone(PRZ) and attack the Support lines ( Second target ) .
Cumulative Long Liquidation Leverage: $3,591-$3,543
CME Gap: $3,461-$3,417
Note: Stop Loss: $4,023
Please respect each other's ideas and express them politely if you agree or disagree.
Ethereum Analyze (ETHUSDT), 1-hour time frame.
Be sure to follow the updated ideas.
Do not forget to put a Stop loss for your positions (For every position you want to open).
Please follow your strategy and updates; this is just my Idea, and I will gladly see your ideas in this post.
Please do not forget the ✅' like '✅ button 🙏😊 & Share it with your friends; thanks, and Trade safe.