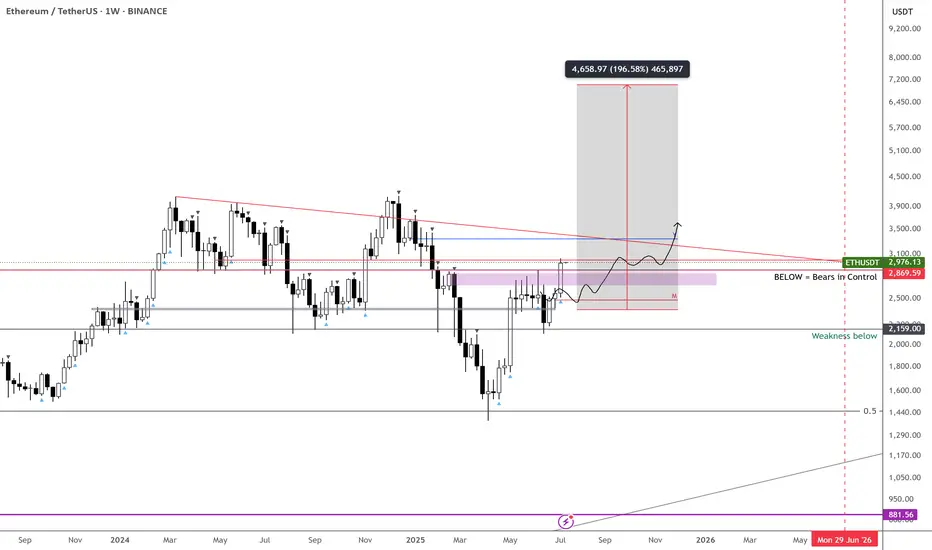
ETH – $7k Target in Sight
7k incoming on CRYPTOCAP:ETH —timing is up in the air, but the chart looks stellar.
A decisive break above $3,500 should kick off aggressive expansion.
Meanwhile, ETHBTC has been rallying hard off its lows; I’m eyeing a 50% gain against BTC over the next 2–3 months.
Holding through this strength makes sense—it’s been a long time since we’ve seen these setups.
ETHUPUSDT trade ideas
ETH/USDT 12h chart1. Punction of the downward trend
• The black inheritance trend line has been broken up - this is a strong signal of Bycza.
• Breaking was confirmed by a strong candle movement and high growth dynamics.
⸻
2. Key levels of support and resistance
• Support:
• 3930 USDT - previous resistance, now the defensive zone with possible correction.
• 3709 USDT - deeper support.
• 3488 USDT - critical support, below which the upward trend would be negated.
• resistance:
• 4048 USDT - current local resistance (the candle touched and lightly reflected).
• 4304 USDT - another strong resistance.
• 4484 USDT - long -term resistance and potential goal when continuing to grow.
⸻
3. RSI
• RSI is around 70 - close to the purchase zone.
• suggests the possibility of a short correction or consolidation before the upward trend continues.
⸻
4. Scenarios
Bycza (continuation of growth)
• Maintenance above 3930 USDT.
• Breaking over 4048 USDT opens the road to around 4300–4480 USDT.
Bear (correction)
• Rejection to USDTT 4048 and a decrease below 3930 USDT may bring a rate to around 3709 USDT.

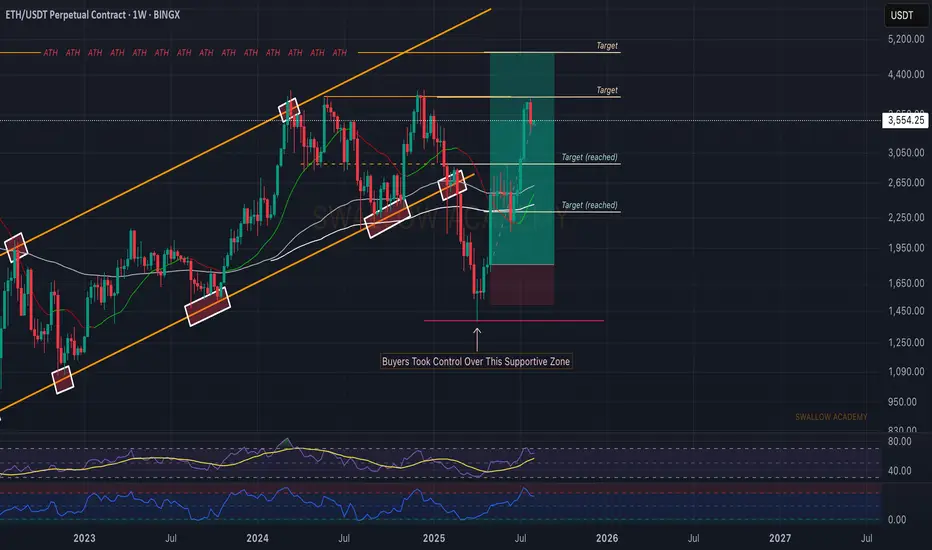
Ethereum (ETH): Looking For Break of $4000 | We Are BullishETH is still bullish in our opinion;recently we had a really good upside movement that got stopped right before reaching the $4000 zone.
Now we had a smaller pullback, which is normal as we had a really strong upside movement so we see it as a natural pullback, which will give us another bounce opportunity (accumulation zone).
Since our entry we have had a good movement, and we are keeping the position open until we reach the ATH zone!
Swallow Academy
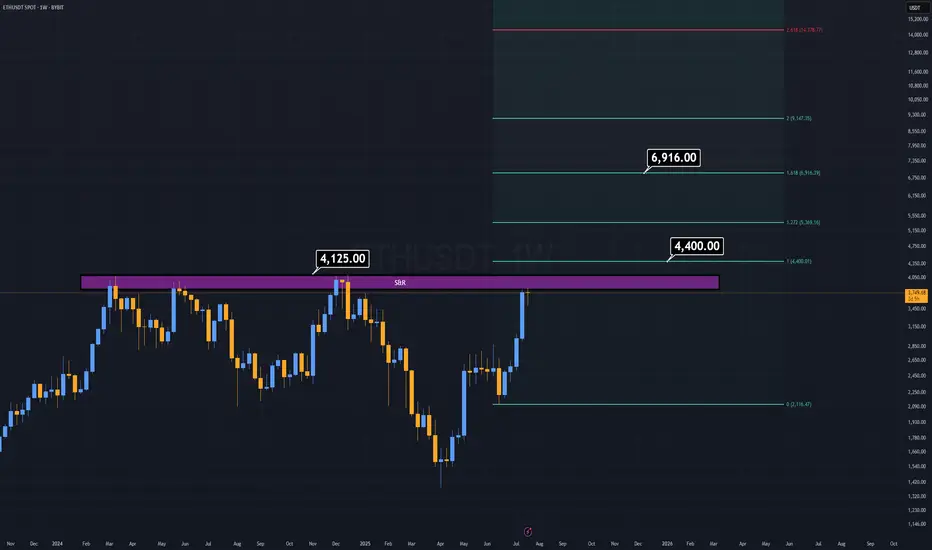
ETH Analysis (1W)Here I am, presenting the asset I personally dislike the most — ETH.
But the chart doesn’t care about feelings. ETH looks ultra bullish, but only if it breaks above the $4,125 level.
Why this level?
The $3,800–$4,100 range has historically acted as a major distribution zone — a place where market participants have consistently taken profit for years.
If this resistance is finally broken, we could see ETH rally toward $6,900 as a minimum target.
This level is based on the breakout projection of the long-standing macro structure.
Honestly, the target looks even better than the asset itself :)
Good Luck.
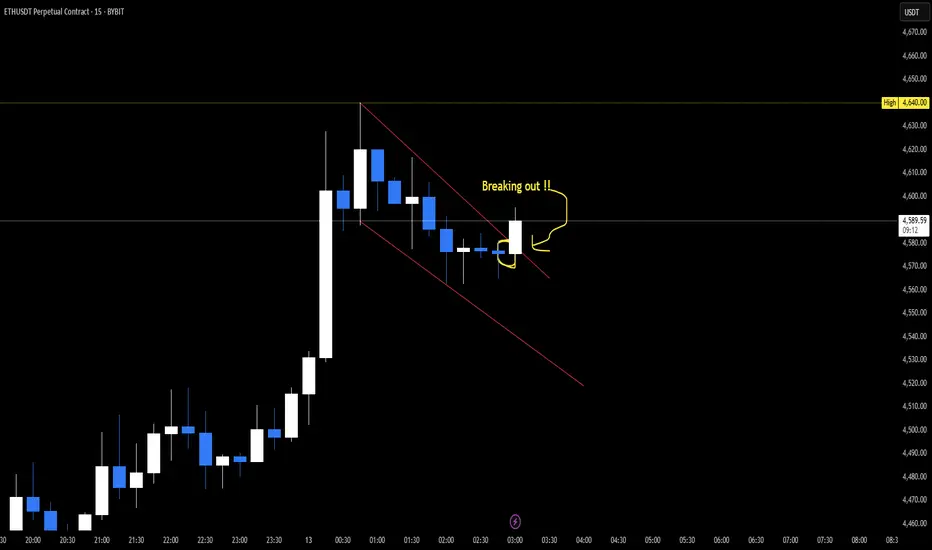
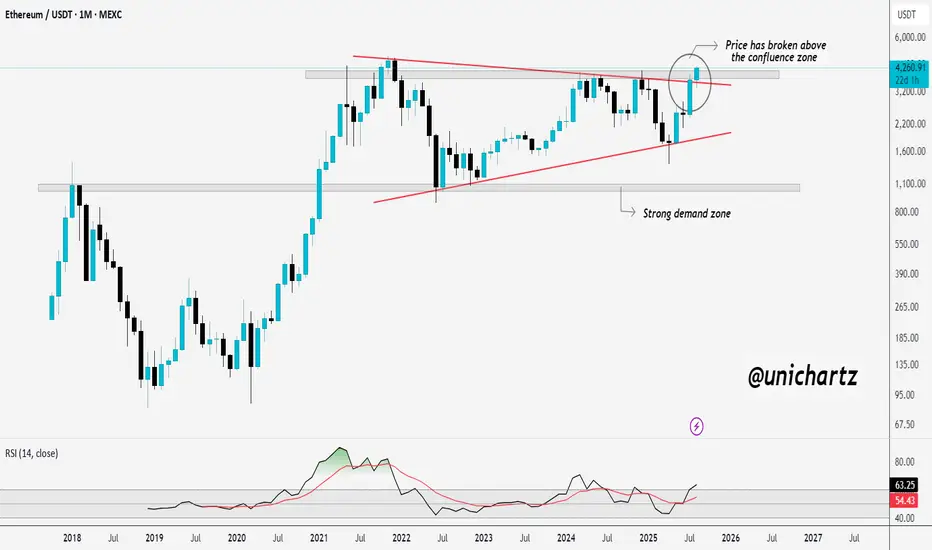
$ETH Breaks Confluence Barrier — Next Stop ATH? CRYPTOCAP:ETH has broken above a major confluence zone, where long-term resistance and trendline pressure have been holding price back. This breakout signals renewed bullish momentum and opens the door for a potential push toward the previous all-time highs.
The strong demand zone below continues to act as a solid foundation, and RSI momentum suggests buyers are still in control. As long as ETH holds above this breakout level, the bullish outlook remains intact.
Failure of the head and shoulders pattern to activateThe failure of the head and shoulders pattern to activate suggests that the bullish trend may likely continue.
Ethereum (ETH): Keep Milking The ETH | Bounced From 200EMAEthereum has been one of the easiest coins to predict for upcoming moves, and we did it again. The 200 EMA rejected the price, which led to another smaller buy-side movement on the coin, giving us an opportunity for a long position here.
Well, nothing has changed; the game plan remains the same—we are aiming for $4000 again and then $4800.
Swallow Academy

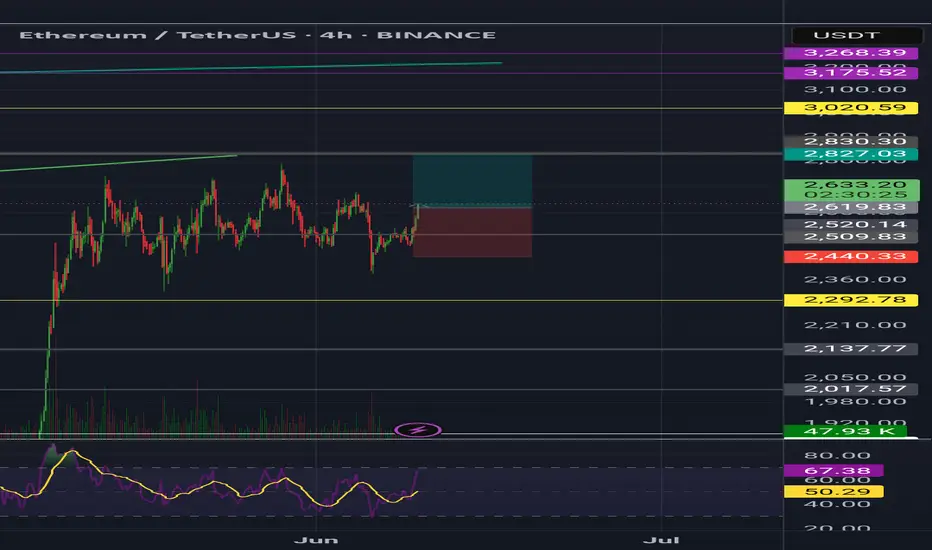
ETH | Ethereum - Weekly Recap & Gameplan - 03/08/25📈 Market Context:
Traders are currently anticipating a potential 0.25% rate cut at the September FOMC meeting, which continues to support the broader bullish outlook.
While the market pulled back following weaker-than-expected Non-Farm Payroll data, overall sentiment remains optimistic.
Greed has cooled off into a more neutral stance. Historically, August often brings some consolidation or pullbacks — but the structural bias for crypto market remains bullish.
🧾 Weekly Recap:
ETH started the retracement movement after building a bullish trend over the past couple of weeks.
It’s mainly being affected by Bitcoin's bearishness, so we’re closely following BTC’s price action.
ETH has tapped into the Weekly Fair Value Gap, which is a key level for me.
We may see a bounce from here.
📌 Technical Outlook & Game Plan:
I expect to see another low on ETH before we go up — as I’m also anticipating one more leg down on Bitcoin.
So I’ll wait for a final bearish expansion and a trap for late sellers before positioning for longs.
After that, I want to see price closing above the purple line at $3500.
🎯 Setup Trigger:
A candle close above the $3500 level will be my signal to look for long setups.
📋 Trade Management:
Stoploss: Below the swing low that breaks above $3500
Take Profit: Targeting $3870, but will trail and lock in aggressively in case of deeper downside expansion.
💬 Like, follow, and comment if this breakdown supports your trading! More setups and market insights coming soon — stay connected!

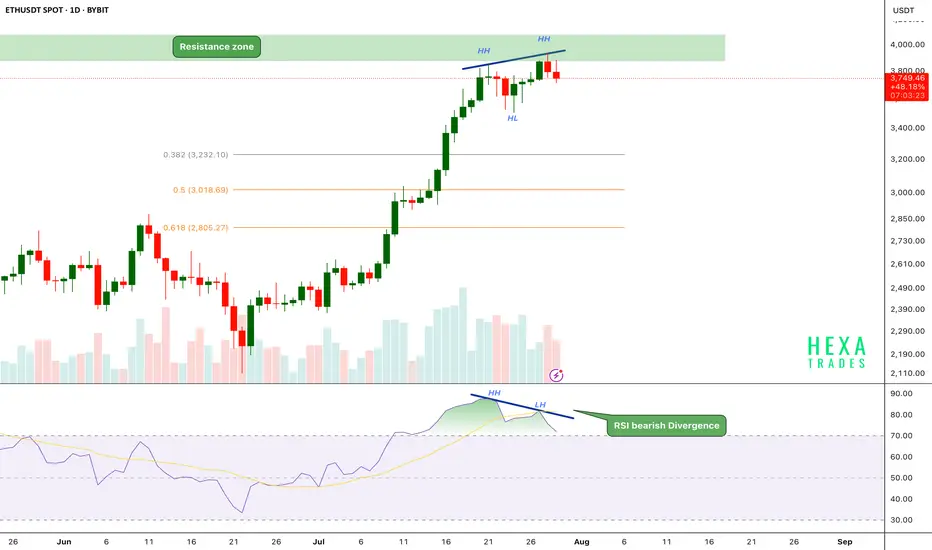
ETH Bearish Divergence!CRYPTOCAP:ETH has been in a strong uptrend, printing consistent higher highs (HH) and higher lows (HL). However, on the daily chart, the price has now reached a critical resistance zone near the $3,800–$4,000 range.
Key Points:
🔸 Bearish RSI Divergence
While price action has formed a new higher high, the RSI has printed a lower high, signaling bearish divergence.
This indicates that upward momentum is weakening even as price attempts to push higher — a common early warning of a possible short-term reversal.
🔸 Fibonacci Retracement Levels
The fib 0.382 at $3240 and 0.5 and 0.618 retracement levels are sitting around $3,000 and $2,800, respectively, potential targets if a correction follows.
🔸 Volume Profile
Volume is gradually declining as price approaches resistance, suggesting buyer exhaustion.
If the price breaks above the $4,000 psychological resistance, we could see a strong bullish move.
ETH is facing strong resistance after a powerful rally, with RSI bearish divergence and weakening momentum hinting at a possible short-term pullback. We should be cautious entering fresh longs here without confirmation.
Support: $3,200, $3,000, and $2,800
Cheers
Hexa
BINANCE:ETHUSDT BITSTAMP:ETHUSD
ETHUSDT: Elliot Analysis You can see the Ethereum chart in the long term, which indicates the end of the fourth wave and the beginning of the fifth wave, so with capital management, you can have a good investment.

ETH Approaching Major Resistance – Expecting Pullback Hello guys!
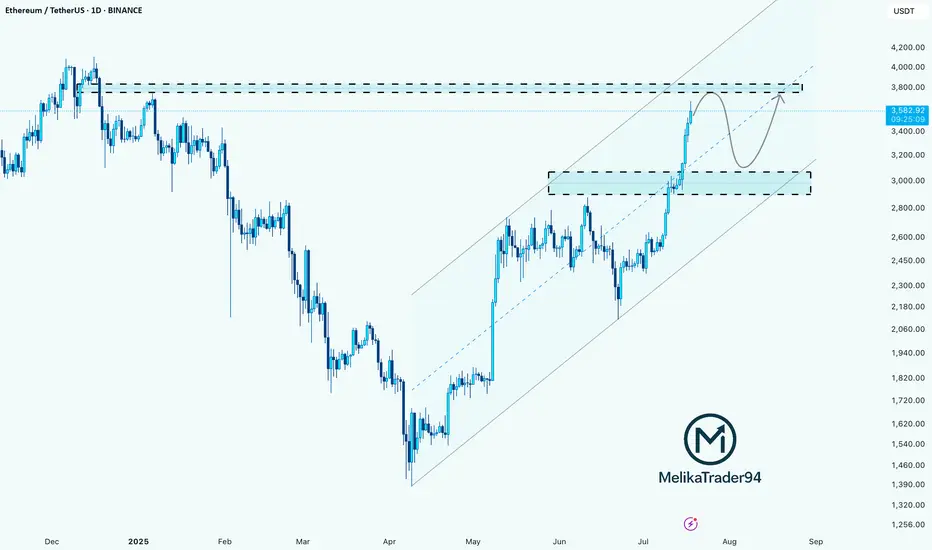
Ethereum has been rallying strongly within a well-respected ascending channel, pushing past key levels and now approaching a major resistance zone around $3,900–$4,000.
According to the chart structure, it looks like price could soon react from this resistance, leading to a pullback into the $3,000–$3,200 demand zone, which aligns with the midline of the channel.
This would be a healthy correction before potentially continuing the bullish trend and attempting a clean breakout toward new highs.
ETH is still bullish, but it may need to retest support before continuation.
Watch for a bounce from the $3,000–$3,200 zone for a high-probability long opportunity.
#ETH Update #6 – Aug 02, 2025#ETH Update #6 – Aug 02, 2025
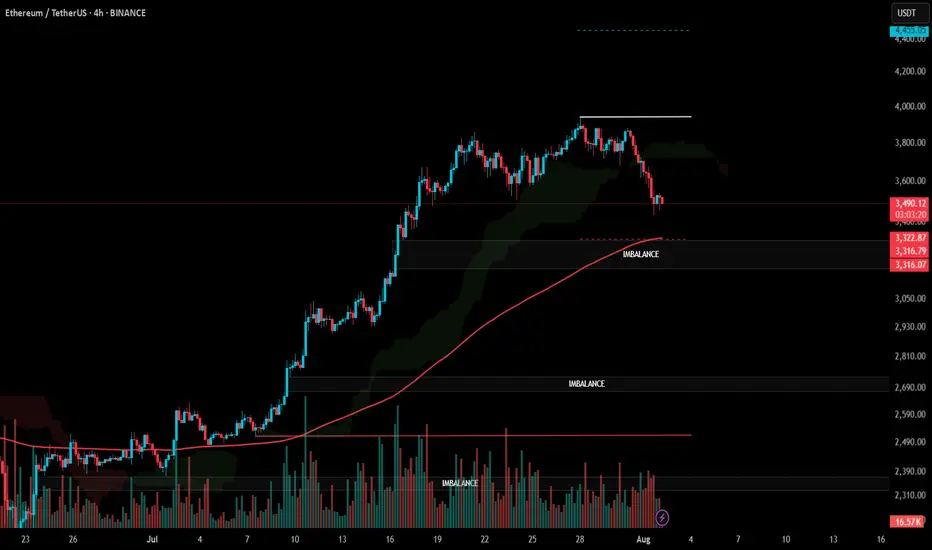
Although Ethereum may seem like it has dropped significantly, it still hasn’t completed the correction of its last impulsive move. If we are to say a proper correction is happening, Ethereum must pull back to the $3,300 zone. If it continues upward without reaching this level, the risk of a deeper retracement increases. That’s why it would be much healthier for Ethereum to extend this pullback and complete the correction around $3,300.
If this correction is completed, the next target will be around $4,450. There is also an imbalance zone around $3,300, and since the price is already close, it might aim to fill that as well — possibly even reaching down to the $3,200 level. Contrary to much of the current market sentiment, Ethereum is heading toward a correction in a very healthy manner, and I believe completing this move would be the best scenario.
Ethereum Market Flush, Retrace & Support ZoneEthereum is now on its third consecutive red day and bearish action is fully confirmed. The market is preparing for a strong drop.
As I've been mentioning, this move looked up from a broader perspective is part of a small correction for the last major advance. Ethereum moved up from $2,500 to almost $4,000. Now we get a retrace that ends in a higher low followed by additional growth.
The retrace is now confirmed as Ether needs to test EMA55 and EMA89 as support. If these levels hold, you can count on a reversal right away. If these levels are compromised strongly, then prices can linger lower before a recovery shows up. It should be fast and strong. It should all happen within a few days, the crash and bottom, and the reversal a long-term process; sustained long-term growth, the market will be removing some of the weak hands.
We are going to be experiencing a bull run, are you sure you want to stay?
Protect your positions at all cost. We've seen nothing yet. $8,000 or more by the end of the bull run phase.
Namaste.

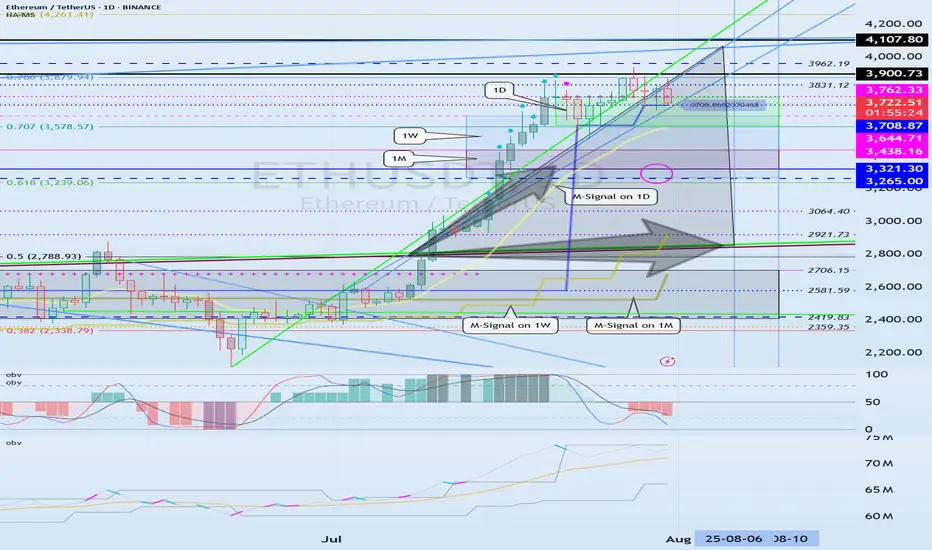
The key point to watch is whether it can rise to 3900.73-4107.80
Hello, traders. Nice to meet you.
If you "Follow," you'll always get the latest information quickly.
Have a great day.
-------------------------------------
(ETHUSDT 1D Chart)
The upward trend continues, with the M-Signal on the 1D chart > M-Signal on the 1W chart > M-Signal on the 1M chart.
Therefore, if the price holds above 3265.0-3321.30, a medium- to long-term uptrend is likely.
Currently, the HA-High ~ DOM(60) range is formed across the 3265.0-3762.33 range on the 1M, 1W, and 1D charts.
Therefore, the key question is whether support is found within the 3265.0-3762.33 range.
-
While the price is trending upward along the short-term trendline, if it falls below the short-term trendline and encounters resistance by falling below the M-Signal indicator on the 1D chart, a decline to the 3265.0-3321.30 range is likely.
ETH's volatility period is expected to last from August 6th to 10th.
The key point to watch is whether it can rise above the 3900.73-4107.80 range after this volatility period.
-
Since the StochRSI indicator has entered an oversold zone, the downside is likely to be limited.
Since the OBV indicator of the Low Line ~ High Line channel remains OBV > OBVEMA, a significant decline is unlikely.
However, since the TC (Trend Check) indicator is below zero, selling pressure is dominant.
Therefore, a decline below 3708.87 could lead to further declines. However, as previously mentioned, the decline is likely to be limited, so a significant decline is not expected.
Once the M-Signal indicator on the 1D chart is encountered, the trend is expected to re-establish itself.
-
Thank you for reading to the end.
I wish you successful trading.
--------------------------------------------------
- This is an explanation of the big picture.
(3-year bull market, 1-year bear market pattern)
I will explain in more detail when the bear market begins.
------------------------------------------------------
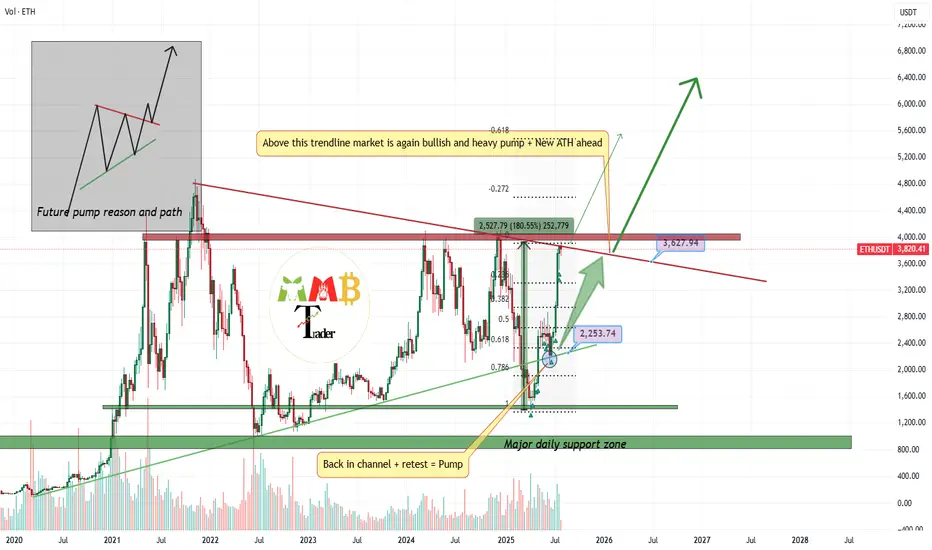
4000$ is last resistance left Ready for breakout and pump?market is still bullish and i am looking for breakout here to the upside for sure But we should consider this factor that major resistance now is touching and we may have first short-term fall.
so for now we may have correction and dump to the targets like 3300$ which is first support of 0.23 Fibonacci level.
and after this healthy correction or without it we can expect more pump and breakout of 4K$ and heavy pump to the targets like 7K$.
DISCLAIMER: ((trade based on your own decision))
<<press like👍 if you enjoy💚
ETHUSDT.PIf you look at the chart, you will notice an uptrend that has somewhat lost its strength and we may not be able to hit higher highs like the next strength in the next move.
Support: 3.660 - 3.590 - 3.160
Resistance: 3.900 - 4.260
Entry: 3.700
SL: 3.500
TP: 4.240
Please control risk management.⚠️

ETHUSDT - Multi-year Symmetrical Triangle ETH has formed a massive symmetrical triangle since the 2021 top (~$4,800).
This triangle has been tightening since 2022 with:
- Lower highs from $4,800 → ~$4,000
- Higher lows from ~$850 → $1,370 → $1,850+
We now close to the apex, meaning a major breakout or breakdown is imminent in the coming weeks/months.
Price Action
ETH is pressing against the upper resistance of the triangle (~$3,850–3,950).
A monthly close above $4,000 would be the first breakout in over 2 years.
Volume
Volume has decreased over time, typical for a symmetrical triangle.
We are looking for volume increase on breakout to confirm it’s on the right track.
Momentum (Laguerre RSI: 0.67)
Momentum is rising, supportive of a bullish breakout.
RSI is not yet overbought, so there’s room for continuation.
Scenarios
Bullish Breakout Scenario:
Trigger: Monthly close above $4,000–4,200
Target: ~$7,000–7,500
Timeline: Could play out over 3–6 months
Bearish Breakdown Scenario
Trigger: Monthly close below $2,500
Target Zone: $1,850 → $1,300 (last major supports)
Would invalidate the higher low structure
I am bullish but it is hard to not to be cautious given its crypto and this is a pretty tough resistance.
Do your own research and make responsible decisions all.
Peace out.

ETHUSD Long to 3700 BITSTAMP:ETHUSD Long trade, with my back testing of this strategy, ETHUSD need to touch 3700
This is good trade, don't overload your risk like greedy, be disciplined trader, this is good trade.
Use proper risk management
Looks like good trade.
Lets monitor.
Use proper risk management.
Disclaimer: only idea, not advice

ETH Targets $12,500 With Potential Ascending Triangle BreakoutThis post updates my earlier post and revises the previous prediction upwards.
Pattern
As we can see on the 3-Month ETH/USD log chart, ETH price compresses within an Ascending Triangle formed by trendlines set at the candle bodies (not wicks). The upper trendline is almost perfectly horizontal and sits at $3600. ETH is currently attempting breakout, but would need a 3-Month close (end of Q3) above the upper trendline at $3600 to confirm the new uptrend.
Target Price
As someone new to Technical Analysis, my original chart used the linear layout, which I have come to learn is less well suited for charting patterns on long timeframes. The updated chart here shows a much more reliable pattern, but also suggests a much higher, yet still conservative, price target of $12,500. I am unsure of the timeline for which ETH could achieve this price, but I assume it would occur this cycle, which is consistent with other bullish ETH predictions, such as Tom Lee's recent call for $10k - 15k.
Method
Ascending Triangles are bullish continuation patterns. The breakout price target is obtained by measuring the percentage distance from the widest part of the triangle and projecting that same percentage above the upper trendline.
Please feel free to offer your criticisms and observations. This is not financial advice.

ETH Daily: Lower High, Lower Low. That Was My Signal
This is ETH on the Daily
Price action today looks very similar to December 2024.
Back then, ETH attempted twice to flip the 0.236 Fib level at $3378.45 — first on Dec 6, then on Dec 12. Both failed. Price found support at the 0.5 (midpoint between the 0.236 and 0.382), bounced, got rejected again at the 0.236, then went lower.
Now, we’re seeing a near-identical pattern:
– First attempt to reclaim the 0.236 Fib on July 21
– Second attempt on July 27
– Both failed
– Price found support again at the 0.5 middle level
– Bounced back to the 0.236
– Got rejected again
What will happen this time?
For me, the answer already came: we’ve now seen a lower low followed by a lower high — a temporary break of bullish structure. That’s my cue to scale out of my long and reduce exposure so I’m not caught off guard overnight.
Now that I’ve done that, I can observe the chart objectively without emotional bias or panic-selling.
Technically, ETH is in a short-term downtrend.
Fundamentally, however, I believe we’re in the early stages of a larger uptrend, driven by strong bullish news around crypto (happy to list them if you're curious).
But until those bullish narratives start kicking in and price moves up again, I have to be extremely careful not to get wiped out — so I’ll stay closely aligned with price action.
Like I said: short-term downtrend, long-term opportunity.
Always take profits and manage risk.
Interaction is welcome.

eth sell midterm "🌟 Welcome to Golden Candle! 🌟
We're a team of 📈 passionate traders 📉 who love sharing our 🔍 technical analysis insights 🔎 with the TradingView community. 🌎
Our goal is to provide 💡 valuable perspectives 💡 on market trends and patterns, but 🚫 please note that our analyses are not intended as buy or sell recommendations. 🚫
Instead, they reflect our own 💭 personal attitudes and thoughts. 💭
Follow along and 📚 learn 📚 from our analyses! 📊💡"
