Crypto Exploded, I Missed it, What should I Buy Now?!The market suddenly exploded… green candles after green candles. Yesterday, you were hesitating to look at the chart, today everyone on social media is posting their profits. So what now? Did you miss out? It’s not too late. The main question now is: What should I buy to catch up?
If you read this analysis till the end, not only will you learn some practical TradingView tools, but you’ll also gain insight into how to act like a professional trader after big pumps not like a reactive follower.
Hello✌
Spend 3 minutes ⏰ reading this educational material.
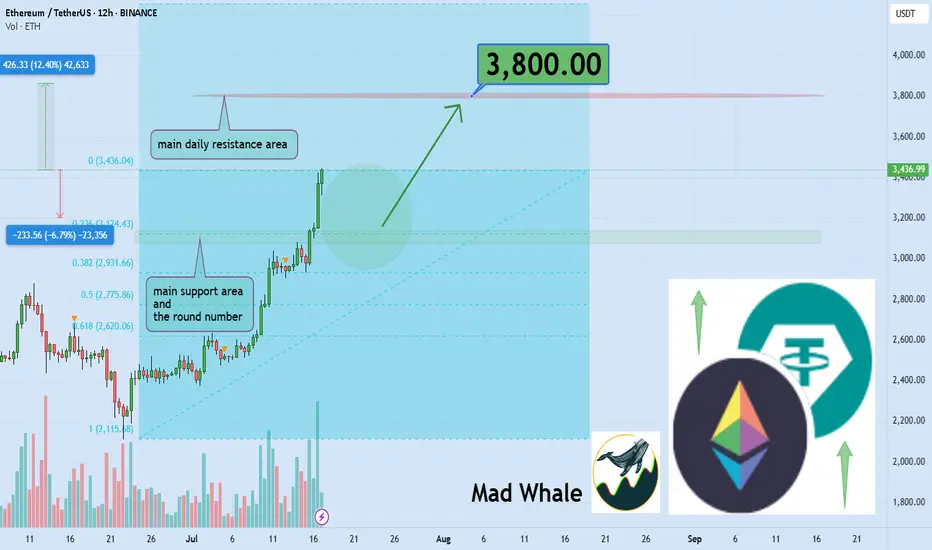
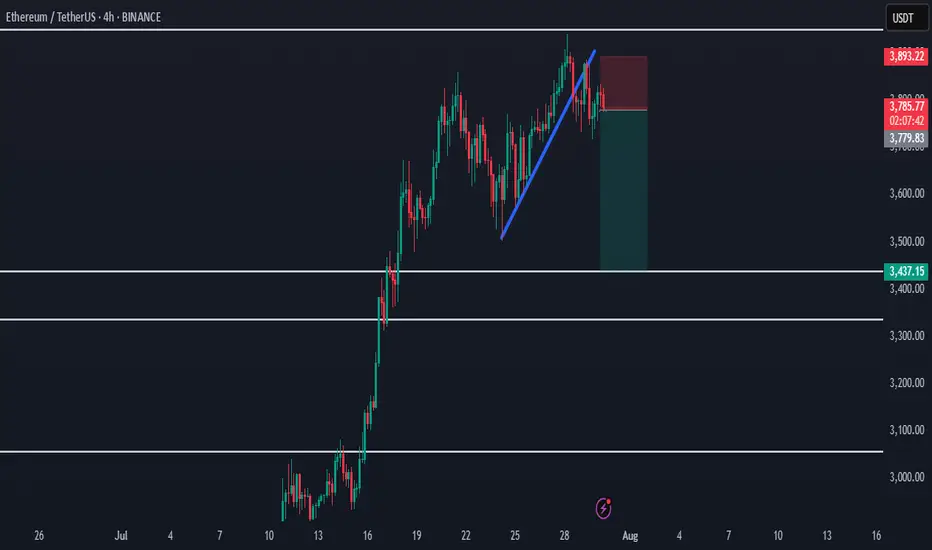
🎯 Analytical Insight on Ethereum:
BINANCE:ETHUSDT is currently holding near the daily support and the key psychological level at $3,000, which also matches the 0.23 Fibonacci retracement. A potential upside of at least 12% is expected, targeting $3,800 close to a major daily resistance zone. Keep an eye on these levels for possible trade setups 📊⚡.
Now , let's dive into the educational section,
🧠 FOMO: The Enemy That Devours Your Profits
If you feel like you missed the boat now, don’t panic. Everyone has felt that, even top traders. It’s called "FOMO." Jumping into the market without analysis and just on emotions can burn you badly. Instead of regretting, sit calmly, analyze, and wait for the right setup. The market always offers new chances you just need to know how to hunt them.
🔍 What to Buy Now? Logic Over Emotion
There are three types of coins still offering opportunity:
Coins that haven’t broken their previous highs yet
Like a compressed spring, they can jump higher with a small push.
Altcoins lagging behind Bitcoin
When BTC pumps, alts usually follow afterward.
Coins with strong upcoming fundamental news
Networks with upcoming updates or special events that generate excitement.
Don’t forget on-chain analysis. See where money is flowing.
🌟 Look for New Stars and Strong, Established Coins
After a pump, there are two ways to hunt:
🔹 New Stars
Altcoins that are just coming out of their correction phase and haven’t had their main pump yet.
🔸 Strong and Established Coins
Assets that have shown resilience, have strong fundamentals, and tend to pump again after corrections.
Balance your portfolio with both to lower risk and maximize profit potential.
🧰 TradingView Tools to Hunt Opportunities After a Pump
To avoid missing out in the second phase of the market explosion, you must use TradingView’s analytical tools correctly. Here are three key tools you should know right now:
Volume Profile
Helps you understand where most trading volume occurred. Smart money usually buys and sells heavily at these points.
RSI (Relative Strength Index)
Tells you when the market is overbought. When it drops back to the 40 to 50 range after a peak, that could be a good re-entry point.
Fibonacci Retracement
A tool to find attractive correction zones after a pump. Especially useful if you combine multiple timeframes.
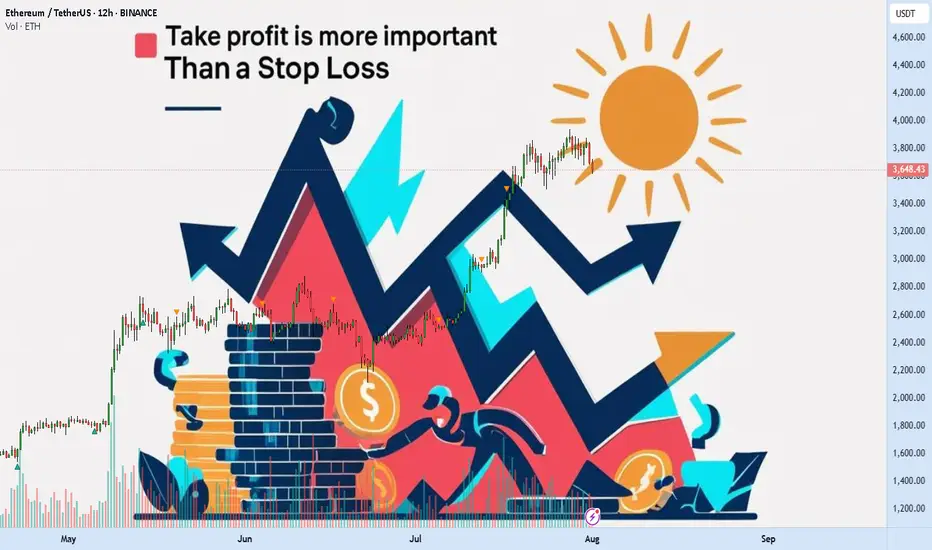
⚖️ Stop Loss Is Necessary, But Take Profit Is More Important
Always place a stop loss in the market. But many forget to set a take profit in bullish markets.
Having a take profit level ensures you lock in gains when the market hits your target and avoid greed.
Key point: Even if you expect huge pumps, take some profit on time to avoid losing it all during corrections.
🪙 The Next Pump Is Just Around the Corner
Instead of jumping into a pump mid-way, focus on spotting setups just forming. Watch for consolidation candles, rising volume, and reactions to classic zones. That’s where you can enter professionally, even before everyone knows what’s coming.
🛠 Game Plan for the Trader Who Fell Behind
Pick three coins that haven’t pumped yet
Test the tools mentioned on them
Set alerts for logical entry signals
Enter with risk management, not emotion
Most importantly analyze, don’t just follow
📌 Summary and Final Advice
If you missed the market pump, don’t worry; crypto markets always offer opportunities you just need to be prepared. A combination of analysis, professional tools, and smart choices between new and established assets can help you not only catch the next pump but ride it ahead of everyone else.
✨ Need a little love!
We pour love into every post your support keeps us inspired! 💛 Don’t be shy, we’d love to hear from you on comments. Big thanks , Mad Whale 🐋
📜Please make sure to do your own research before investing, and review the disclaimer provided at the end of each post.
ETHUPUSDT trade ideas
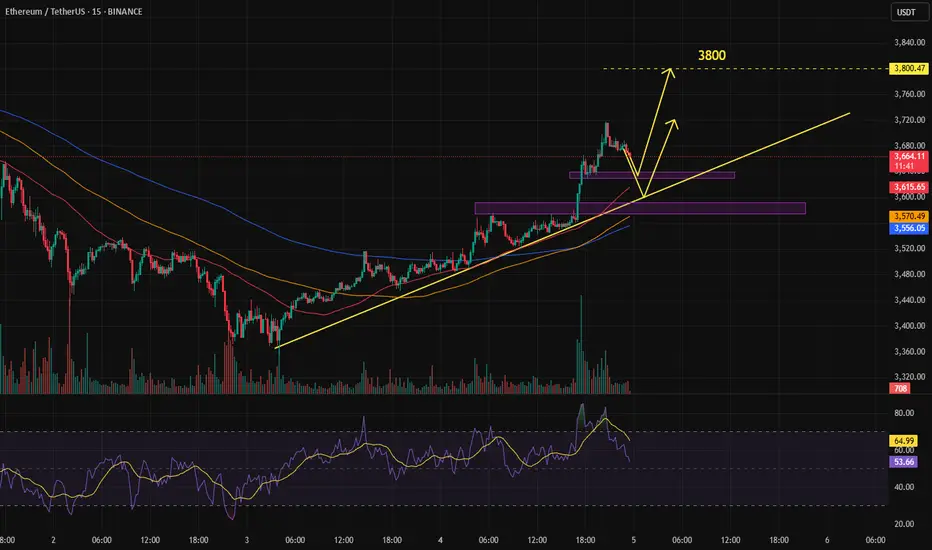
15-minute analysisThe price went up to 3717 and got rejected. It’s currently sitting around the 3666 level with low volume, and for now, the market seems calm.
It’s clear that a significant level has formed here, which looks reliable.
We also have another key level around 3580.
Based on my analysis, I expect the price to react to one of these two levels and then potentially start a move toward the 38,000 mark.
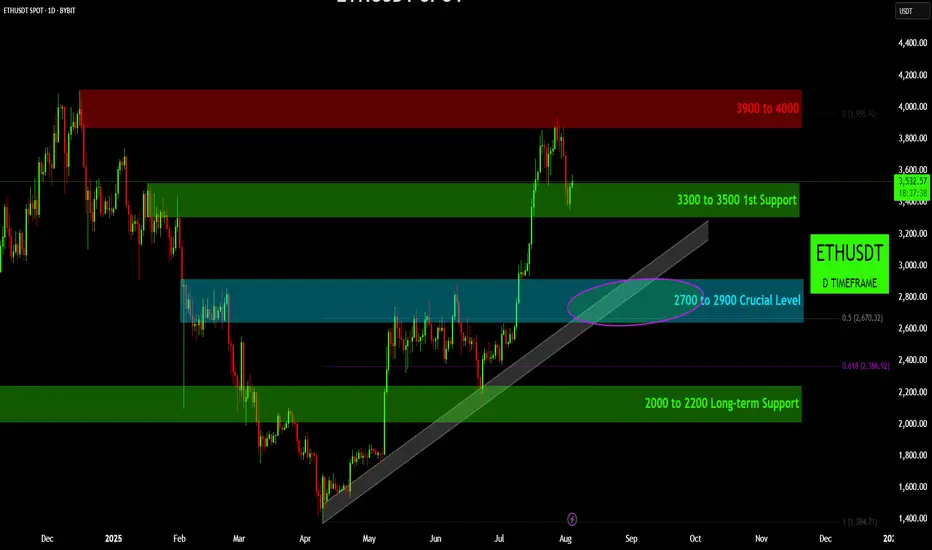
Can Ethereum Hold This Crucial Level and Continue its Ascent?Can Ethereum Hold This Crucial Level and Continue its Ascent?
ETHUSDT presents a clear bullish structure on the daily timeframe, having recently broken out of a multi-month consolidation pattern. The market has encountered a significant resistance zone but has since pulled back to test a key support level. The price action is currently defined by a series of well-established support and resistance zones, along with a crucial rising trendline, which together will determine the asset's next major move.
1. The Bullish Impetus & Key Resistance:
All-Time High Resistance ($3900 to $4000): This upper red zone represents a significant supply area where sellers have historically entered the market, preventing a new all-time high. The recent rally encountered resistance in this zone, leading to the current pullback.
The Rally from the Consolidation: Following a period of consolidation, Ethereum staged a powerful rally, breaking through several resistance levels on its way to re-testing the all-time high zone.
2. The Immediate Support Zone:
First Support ($3300 to $3500): The current price is engaging with this green zone. This level has been a key area of previous support and resistance, and its ability to hold as support will be a critical test for the bulls. A successful defense of this zone would be a strong signal for a continuation of the upward momentum.
3. The Crucial Level & Trendline Confluence:
Crucial Level ($2700 to $2900): Below the immediate support lies a more significant support confluence zone, marked by the blue box and a rising trendline. This "Crucial Level" is a major demand zone that has previously served as a pivot point in the market. The confluence with the rising trendline, which has been providing support since late March, makes this a highly significant area.
0.5 Fibonacci Retracement: This area also aligns with the 0.5 Fibonacci retracement level of the recent major move, reinforcing its technical importance. A break below this zone would suggest a significant shift in market sentiment.
4. The Ultimate Support:
Long-term Support ($2000 to $2200): This lower green zone represents a robust long-term support level. If the "Crucial Level" were to fail, this area would be the next major target for a deeper correction. The 0.618 Fibonacci level is also situated within this zone, further highlighting its significance as a potential bounce area.
Conclusion:
ETHUSDT is currently re-testing its first major support zone after a rally toward all-time highs. The ability of the bulls to defend the "$3300 to $3500" level will be crucial for a potential re-test of the "$3900 to $4000" resistance. A failure to hold this support would likely lead to a retracement toward the even more critical "$2700 to $2900" level. The integrity of the rising trendline and the "Crucial Level" will be the ultimate determinant of whether the long-term bullish trend remains intact.
Disclaimer:
The information provided in this chart is for educational and informational purposes only and should not be considered as investment advice. Trading and investing involve substantial risk and are not suitable for every investor. You should carefully consider your financial situation and consult with a financial advisor before making any investment decisions. The creator of this chart does not guarantee any specific outcome or profit and is not responsible for any losses incurred as a result of using this information. Past performance is not indicative of future results. Use this information at your own risk. This chart has been created for my own improvement in Trading and Investment Analysis. Please do your own analysis before any investments.
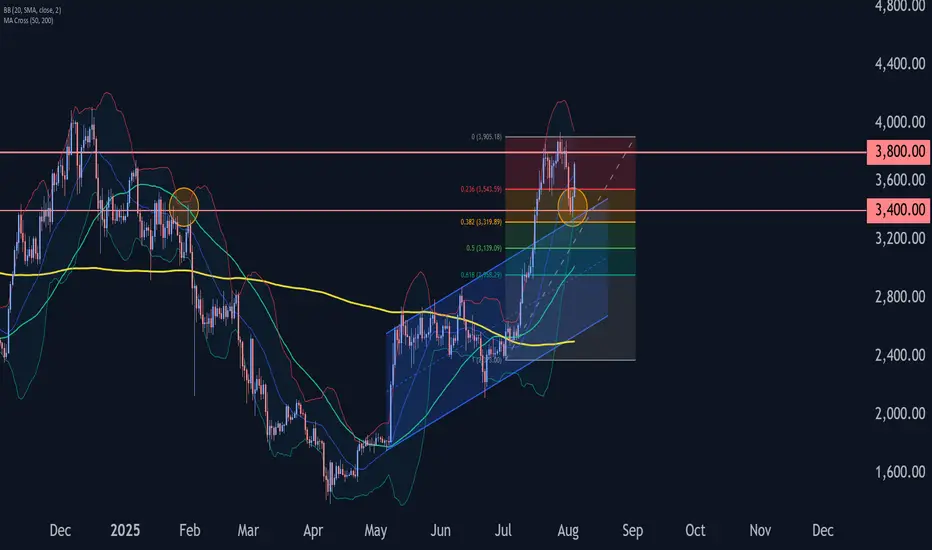
Ethereum Wave Analysis – 4 August 2025- Ethereum reversed from the key support level 3400.00
- Likely to rise to resistance level 3800.00
The Ethereum cryptocurrency recently reversed from the support zone between the key support level of 3400.00 (formerly a resistance level from January) and the upper trendline of the recently broken up channel from May.
This support zone was further strengthened by the 38.2% Fibonacci correction of the previous sharp upward impulse from July.
Given the clear daily uptrend, Ethereum cryptocurrency can be expected to rise to the next resistance level 3800.00.
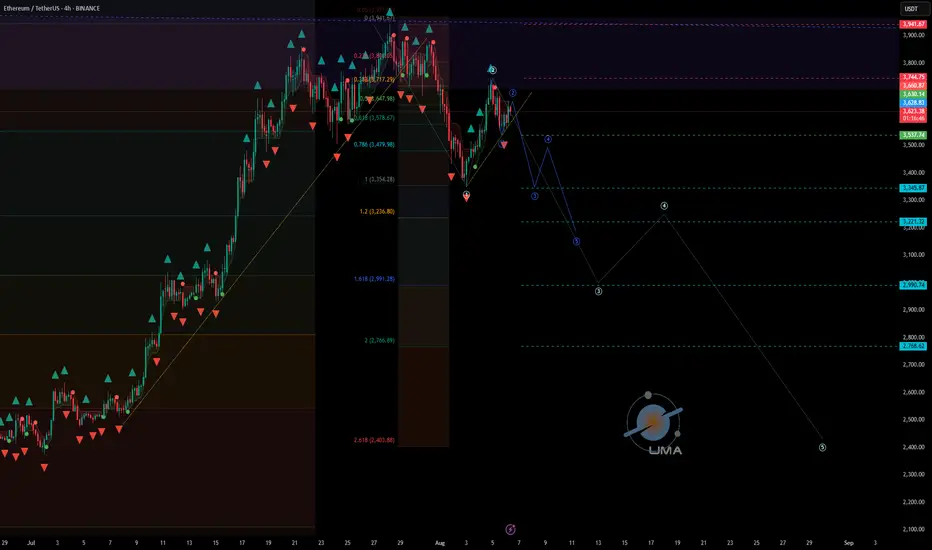
ETHUSDT - UniverseMetta - Analysis#ETHUSDT - UniverseMetta - Analysis
Potential reversal & correction setup in progress
📆 W1 – Weekly Timeframe
🔹 Price is testing a major monthly resistance zone, from which price has previously rejected toward the lower edge of a large triangle structure
🔹 According to the 3-wave structure, ETH has reached 161% of Wave 1 and closed above the 200% Fibo level
🔹 If the price fails to make a new high this week, a top fractal may form — a possible signal for a medium-term correction
📉 D1 – Daily Timeframe
🔹 A double top pattern is forming, along with a potential retest of the trendline
🔹 If confirmed, this could trigger a 3-wave correction structure downward
🔹 A downward fractal is already printed — adding confluence to the bearish scenario
🎯 Correction targets:
• $3,242
• $2,546
⏳ H4 – 4H Timeframe
🔹 Current price action suggests a correction from the recent impulse
🔹 A 3rd wave may initiate upon trendline breakout
🔹 Entry confirmation may come from breakout + retest, or via confirmed double top structure
🔹 Stop should be placed above the high of Wave 1 (H4)
🎯 Trade Setup:
Entry: 0.64930
TP: 0.65404 - 0.65700 - 0.66164 - 0.66676
Stop: 0.64482
‼️ Risk should not exceed 1–3% of your portfolio
This signal/idea is not financial advice
📌 Key Fundamental Triggers to Watch:
🔹 Federal Reserve expectations – a dovish shift could support ETH short-term, but failure to materialize may drive a pullback
🔹 ETH ETF news – updates on applications, approvals, and volume flows can significantly impact sentiment
🔹 Correlation with NASDAQ/S&P500 – weakness in equities could drag crypto lower
🔹 On-chain activity – declining gas usage or demand may indicate lower network utility and bearish pressure
🔹 Weekly overbought condition – many technical indicators (RSI, MACD) point to overextension
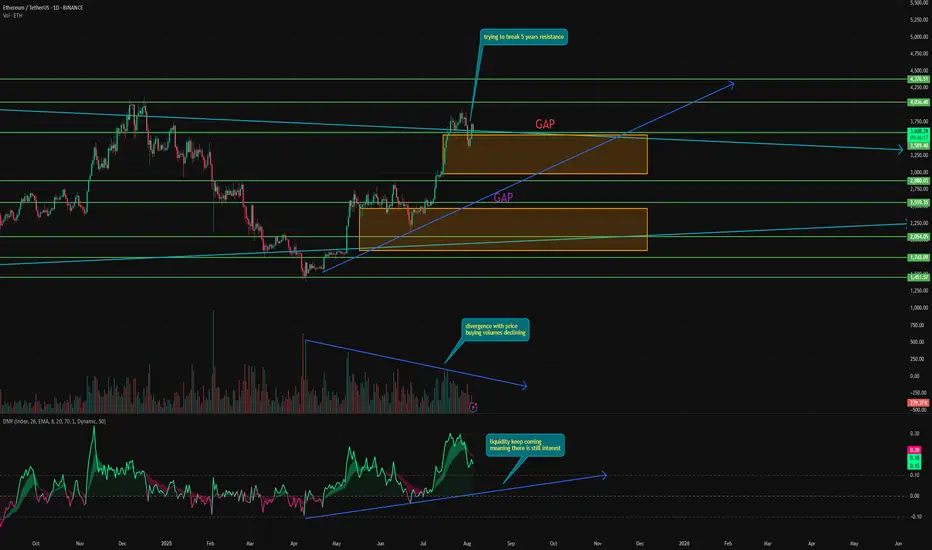
Time to take some profits in ETH⚡️ Hello everyone! Over the past week, the market has been actively correcting, which, ironically for ETH, coincided with reaching the $3,650 level, where its 5-year resistance line is located.
This is obviously a powerful level, which the price already broke through in December last year, but after spending less than a week above it, it went into correction.
If the price can really consolidate above this level, it will open the way for tremendous growth. Even $5,000 will seem like a joke.
⚙️ But is there a real chance of this happening? Let's take a look:
During its growth, ETH moved extremely sharply and powerfully, forming two gaps from below at $3,560–2,987 and $2,483–1,848. As we know, in 99% of cases, gaps close sooner or later. So there is a high probability of a downward movement. In addition, one of the gaps has already partially closed.
Volume - purchase volumes continue to diverge from the price, indicating waning interest in ETH. This often leads to a trend reversal.
Money Flow - Interestingly, liquidity continues to flow into the asset, unlike Bitcoin. And now it is at a fairly high level. In addition, there is harmony with the price.
📌 Conclusion:
Right now, ETH looks strong enough to finally break through resistance and open the way to new heights. However, this will also depend on the overall state of the market.
No matter how strong ETH is, if Bitcoin goes into correction, ETH will go with it.
But if we remove all emotions and thoughts and look at it technically, ETH has reached five-year resistance. And good traders buy on support and sell on resistance.
Have a nice day, everyone!
Aug 4, 2025 -- ETHUSDT.PMarket can expand after this retracement. If it doesn't give any indication to move higher we can expect deeper retracement or reversal. If it expands now, it has a strong resistance around 4000 level. If that breaks, way up. If not, we at least get long till the major resistance. Currently, price is in a sensitive zone, if we get Daily/4H indication of running lower, we short. If it displaces upwards on Daily/4H we long. On any side here, we wait for the first expansion move.
ETH forming double topETH is forming a double top, nice confluence to what BTC is doing rn
Maybe that's the turnaround and its going back down for now.

EtherumEth is in bullish trend
on 1D TF there was a bearsish divergeanc which create a correction
scrip has taken support from 0.5 fib level and bouncing back now.
apprently it is forming a flag pattern and it can hit target of 4500 soon.

ETH 4H – Demand Ladder Holding Strong, Bullish Set Up?Ethereum has been climbing a ladder of demand zones on the 4H chart — with each major impulse followed by consolidation and a successful retest of prior support. This current pullback has once again tapped into a reclaimed demand area near $3,400–$3,500.
So far, every past structure has acted as a springboard for the next leg up — a pattern that’s held since April.
📊 Key insights:
– Multiple confirmed demand zones stacking higher
– Prior demand flips to support after each breakout
– Most recent pullback held structure with Stoch RSI bouncing from oversold
– Structure and momentum suggest potential continuation if $3,400 holds
A breakdown of this final zone could invalidate the staircase, but until then, structure favors the bulls.
Is ETH gearing up for $4,000+ or finally losing steam?
Drop your thoughts in the comments.

Ethereum Rejected from Supply - Bearish Shift in ProgressHello everybody!
Price has been rejected from a supply area.
The bullish trend has slowed down, and the market structure is slightly shifting bearish.
A polished upward trendline has been broken on the 1H timeframe.
We’re aiming for a target around the first untouched demand zone: 3437.
Manage your risk and trade safe!
ETH LongFollowing a significant decline, the asset will take support and bounce back from this point.
Disclaimer: This is not financial advice.
This algorithm provides highly precise buy and sell signals with alerts:
ETH NEXT MOVE AND BUY ZONE.1. Market Structure:
ETH/USDT broke previous structure highs (marked with X), confirming a bullish trend shift.
Price made a strong impulsive move upward after that break, forming higher highs and higher lows, indicating smart money accumulation.
2. Price Action & Current Retracement:
After forming a recent peak near $3,950, ETH entered into a retracement.
The retracement is currently holding above key liquidity and demand zones, showing signs of healthy correction rather than reversal.
3. Liquidity Grab – Sell-Side Liquidity (SSL):
There is Sell-Side Liquidity (SSL) resting below $3,700, which has not yet been taken out.
Smart money often targets such liquidity before initiating a new leg up — this makes SSL a potential magnet for price.
4. Fair Value Gap (FVG) + Demand Zone (POI):
Just below the SSL lies a confluence zone:
A clear Fair Value Gap (FVG) between approximately $3,680–$3,700, showing inefficiency in price.
A Demand Zone (POI) below that, between $3,640–$3,680, representing the origin of the bullish move that broke structure.
This zone provides high-probability support and a potential area of smart money re-entry.
5. Trade Setup Expectation:
Scenario: Price is likely to:
Sweep SSL below $3,700.
Tap into the FVG + Demand Zone.
Show bullish confirmation (like a bullish engulfing, Choch/BOS on lower timeframe).
Entry: After confirmation inside demand zone.
Stop Loss: Below demand zone (~$3,620).
Take Profit 1: Retest recent high at $3,950.
Take Profit 2: Extension toward $4,050–$4,100 based on higher timeframe targets.
✅
Summary:
ETH/USDT is in a bullish structure but currently pulling back. A sweep of sell-side liquidity (SSL) and a tap into the FVG + Demand Zone around $3,640–$3,700 is expected. After confirmation, it offers a high-probability long setup, aligning with smart money accumulation logic.

Long here.Genius I know right.
I though I was special calling for a big drop on XPR and closed out a nice trade to start my week with my morning coffee here in NZ.
Of course I look at the rest of the market and see that the drop was clearly across the board. I don't feel as special, but still happy. And will be really happy if we are close to a support level on ETH after this 10% drop. I am already in long with some size and ready to average into a much bigger long position. This is where I am happy to not run close stops, size up without crazy leverage and let my liquidation point act as my stop. Very rarely, but this is a very good opportunity in my opinion. Just be mindful to have a plan if we go lower, but I think we will retrace back up to $1687 within the next couple of hours.

ETHUSD : Key levelsHere is a list of key levels. All of them will be interesting to the market, but when exactly from them will be a bounce I will inform in the next posts. It is foolish to just wait for a bounce from them. Stay tuned for the next posts.
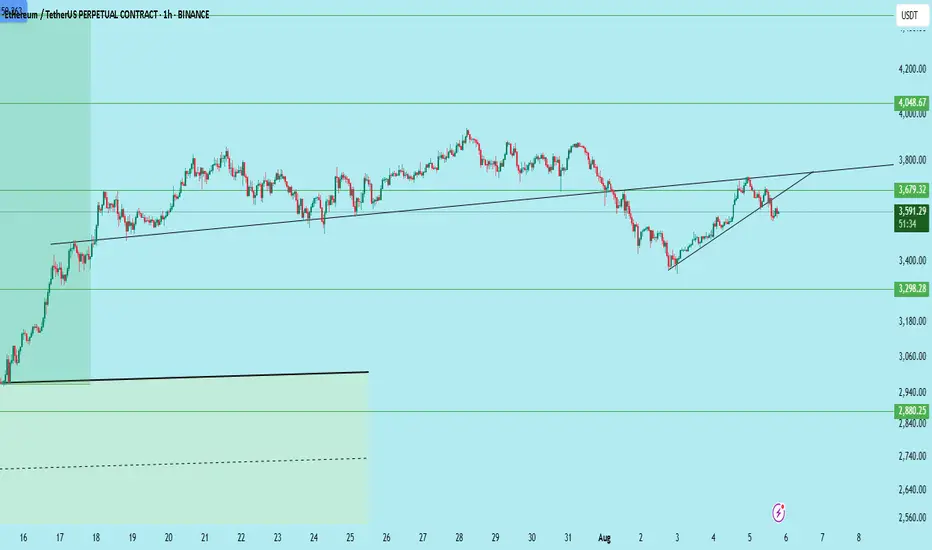
ETH/USDT Bearish Setup – Rising Wedge Breakdown & RetestEthereum (ETH/USDT) has broken down from a rising wedge — a classic bearish pattern — and is now showing signs of rejection after a clean retest of the broken trendline around $3,679.
Structure:
Rising wedge pattern on the higher timeframe
Breakdown confirmed with retest of lower trendline as resistance
No bullish follow-through after retest
Trade Plan:
Bias: Bearish below $3,680
Entry Zone: Anywhere below $3,670–3,680 if rejection is confirmed
Stop Loss: Above $3,720 (invalidation)
Targets:
Target 1: $3,298
Target 2: $2,880
Target 3: $2,640
Key Notes:
If ETH reclaims and holds above $3,680, the setup gets invalidated
Watch BTC behavior — ETH tends to follow
Volume shows no strength from bulls post-breakdown
This setup presents a high-risk, high-reward opportunity if the price continues to decline from this zone.
Conclusion:
Stay cautious, as the market could see more downside if ETH stays below $3,680. Manage risk accordingly.
DYOR | Not Financial Advice
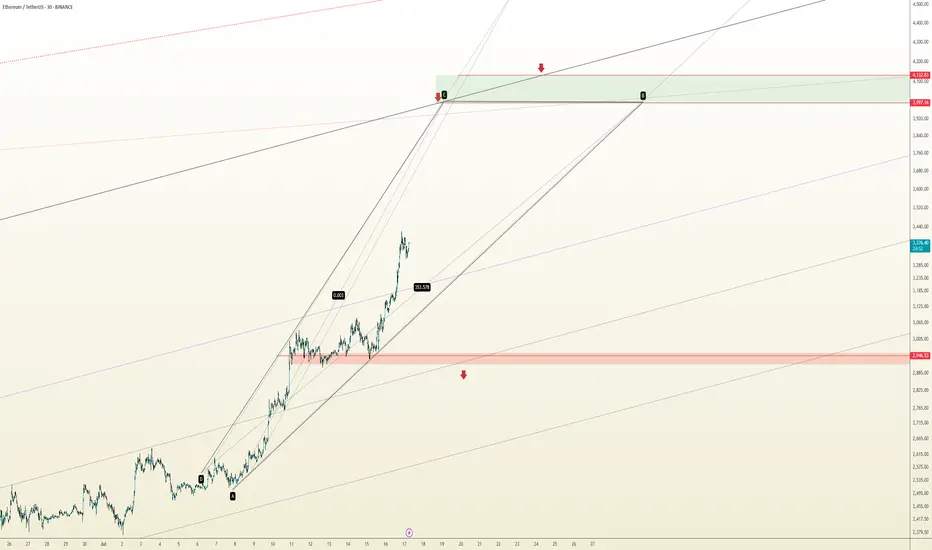
The Loudmouth Pattern: It Yells, We Trade!
On the 30-minute chart, ETH is forming a classic Broadening Formation – or as some traders like to call it, “The Big Mouth Pattern” 😄. It’s noisy, unpredictable at first glance, but when it speaks, you’d better listen.
Right now, price is moving through the bullish leg of this setup, and if momentum holds, we’re eyeing the $4,000 psychological level, followed by the $4,120 – $4,170 supply zone.
🔹 Bullish Scenario (our expected outlook):
🎯 Target 1: $4,000
🟩 Main Resistance: $4,120 – $4,170
❌ Invalidation: Confirmed close below $2,946
If price breaks and holds below that red support zone, this setup gets thrown out the window.
📊 Risk Management:
Scale in on pullbacks – if structure remains valid
No chasing without confirmation
Keep risk under 1% of total capital
📈 The market’s big mouth is open – and until it closes below $2,946, we’re listening for bullish signals. 🤑
Take profit is more important than a stop lossAre you actually in profit, or just delaying your next loss?
How many times have you watched your gains vanish because you wanted more?
Maybe it's time to stop fearing losses and start planning exits.
Hello✌️
Spend 3 minutes ⏰ reading this educational material.
💸 Why Most Traders Lose Profits They Already Had
Most traders obsess over stop losses but never define where they'll take profits. Imagine entering a great trade, watching the price go up, then suddenly it pulls back and you're out with nothing. That happens because you didn’t define your win.
A well-placed take profit acts like a contract with your future self. It secures your gain before the market decides otherwise.
📉 No Take Profit? Say Hello to Unnecessary Losses
Failing to set a take profit is basically handing the market a free ticket to reverse your gains. Especially in the highly volatile crypto space, a missed exit often turns into a regretful stop out. So while everyone is talking about stop losses, you should focus on where the money is actually made.
🧮 A Clear Profit Target Creates a Clear Mind
Having a defined profit target gives your mind a place to rest. It brings structure and removes hesitation. This peace of mind is something new traders lack, which often leads them to close early or hold too long.
🧠 Greed Is the Real Enemy of Your Gains
Greed whispers "Wait, it might go higher"
But when you don't have a take profit plan, that whisper becomes your worst advisor. Pro traders map their exits before entering, while amateurs dream of riding forever.
🛡 True Capital Protection Begins with Profit Protection
If you're aiming for safe capital in crypto, it's not just about minimizing losses. It's about securing wins. Beginners often build their whole plan around stop loss. But advanced traders fear losing profits more than they fear taking a hit.
🎯 Take Profit Is Your Emergency Exit Plan
Setting a profit target is like having an escape route during a fire. Without it, you’ll panic when things turn. Crypto markets are full of pump traps. Your profit is only real when you actually take it.
🚪 Exit Strategy Matters More Than Entry
Everyone talks about entries, but it's your exit that defines whether your trade ends in green or red. Many traders nail the perfect entry but without a clear exit plan, they hand back their profits. Prioritizing your take profit is not optional. It’s essential.
🔁 Managing Gains Is Managing Emotions
Without a defined exit, every candle can shake your decision-making. But when your take profit is set in advance, emotions can’t hijack your strategy. You’re following a plan, not a feeling.
📊 TradingView Tools to Manage Take Profits Effectively
In the world of trading, the right tool means the right decision. TradingView offers powerful tools that help you manage not just your stop loss but more importantly, your take profit targets. With tools like Price Range and Long/Short Position, you can easily visualize where you entered and where you need to exit before greed pulls you deeper.
The Fibonacci Extension tool is especially valuable during bullish runs. It allows you to map out realistic and strategic profit levels like TP1, TP2, and TP3. These targets can then be paired with horizontal lines or alerts within TradingView’s chart system.
Even if you're using a free TradingView account, a simple custom Pine Script can help set alerts when your percentage targets are hit so you can scale out or lock in profits instead of emotionally reacting to price movement.
Using these tools practically empowers traders to build real-world strategies and take control of their exits, not just their entries. That’s the real edge.
📌 Final Takeaway
A clear, well-placed take profit protects both your money and your mind. Don’t let your wins dissolve into losses. With the right tools and the right mindset, you don’t just survive the market, you beat it. Start managing your profits today, not just your losses.
✨ Need a little love!
We pour love into every post your support keeps us inspired! 💛 Don’t be shy, we’d love to hear from you on comments. Big thanks , Mad Whale 🐋
📜Please make sure to do your own research before investing, and review the disclaimer provided at the end of each post.
EthusdHonestly probably marks up very heavily soon...
We are entering etf bid war phase of the cycle.
Can't even really draw how vertical this chart could go as certain macro economic conditions seem to be brewing...
15k is the predicted target of certain large tradfi firms that are accumulating, bitmine for example.
They are basing their targets from the success of the circle internet groups public listing as well as fundamental factors such as JPMorgan and other institutions launching their own stable coins on ethereum...
Multiple companies rushing to accumulate 5% of the supply while predictions of a 75bps rate cut from the fed are starting to brew...
Supply shock combined with inflationary event aswell as eths successful merge earlier this year are incredibly bullish catalysts and we aren't even at the ath valuations seen last cycle.
ETH Market Analysis: Where Are We Heading?Current Situation
Ethereum has been on quite a journey in 2025. After climbing steadily since January and reaching nearly $4,000 in July, we're now seeing a pullback with prices around $3,400. This isn't unusual - even in strong uptrends, prices don't move in straight lines.
What The Data Tells Us
Looking at the price patterns and technical indicators:
The big picture remains positive: Despite recent dips, Ethereum is still in an uptrend when looking at the longer timeframe. We're significantly higher than where we started the year.
We're at a decision point: The price is currently sitting at an important level where buyers and sellers have previously shown strong interest.
Support and resistance zones are clear: There have been consistent price levels where Ethereum tends to bounce (support) or struggle to break through (resistance).
Three Possible Paths Forward
Path 1: Resuming the Climb (45% likelihood)
If buyers regain control, we could see Ethereum push back above $3,500, then challenge the recent highs near $3,900. Breaking that level could open the door to the psychologically important $4,000 mark and potentially beyond.
Path 2: Further Pullback (40% likelihood)
If selling pressure continues, Ethereum might drop toward $3,200 first, with stronger support around $3,000. In a deeper correction scenario, we could test the $2,800 area where many buyers stepped in during previous dips.
Path 3: Sideways Movement (15% likelihood)
Sometimes markets need time to digest gains. Ethereum could spend several weeks trading sideways between roughly $3,300 and $3,600 before making its next significant move.
What To Watch For
Breakout signals: A strong move above $3,550 with increasing trading volume would suggest the uptrend is resuming.
Breakdown signals: Falling below $3,350 with conviction could indicate more downside ahead.
Volume patterns: Higher volume on up-days versus down-days would suggest stronger buyer interest.
This analysis is based purely on price patterns and technical indicators, looking at what the market has actually done rather than predictions based on news or sentiment.

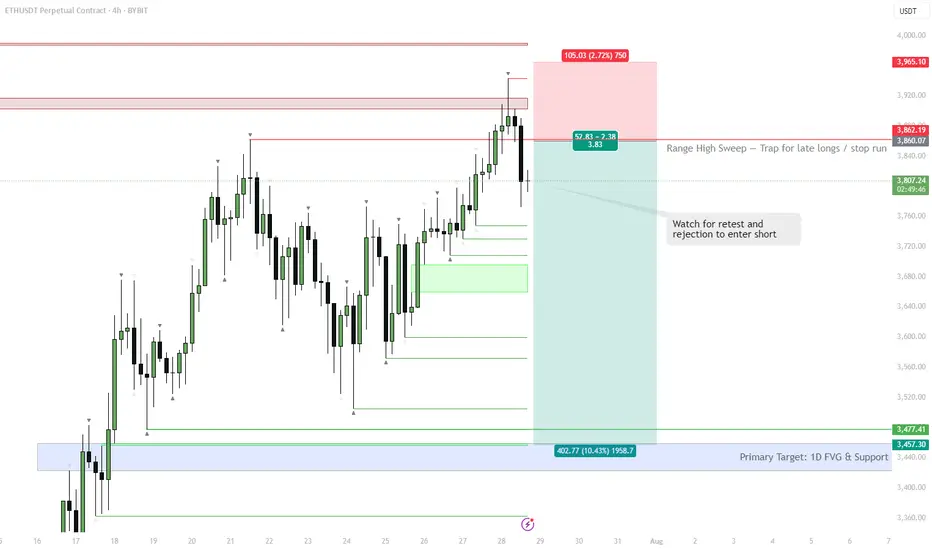
ETH | #4h #short — Range High Sweep & Short SetupScenario:
ETH swept the range high at $3,860, trapping late buyers and triggering stops. Watching for a retest of this level — if it holds as resistance and we see rejection, that’s a short trigger.
Target:
Main target is the 1D FVG at $3,457–$3,477. Possible extension: sweep of range low if selling accelerates.
Why:
Failed breakout setups are classic mean reversion triggers, especially when supported by a visible liquidity pool (FVG) below.
Plan:
Wait for a retest and rejection to confirm short. Partial TP at the FVG zone, manage risk above the sweep high.
ETH Price Weakens: Watching This Strong Demand Zone Closely$ETH/USDT Analysis (12H)
Ethereum has broken below a key support zone, confirming short-term weakness in price structure.
At the same time, the RSI is showing bearish divergence, signaling slowing momentum while the price was making higher highs — a classic early warning of a potential drop.
Now all eyes are on the strong demand zone below. If ETH finds support there, we could see a solid bounce or even a full trend reversal. But if this zone fails, deeper correction may follow.
DYOR, NFA
Thanks for the reading
