ETHEREUM: THE NEW BOND OF THE DIGITAL WORLDPrice isn’t the goal. Price is the side effect.
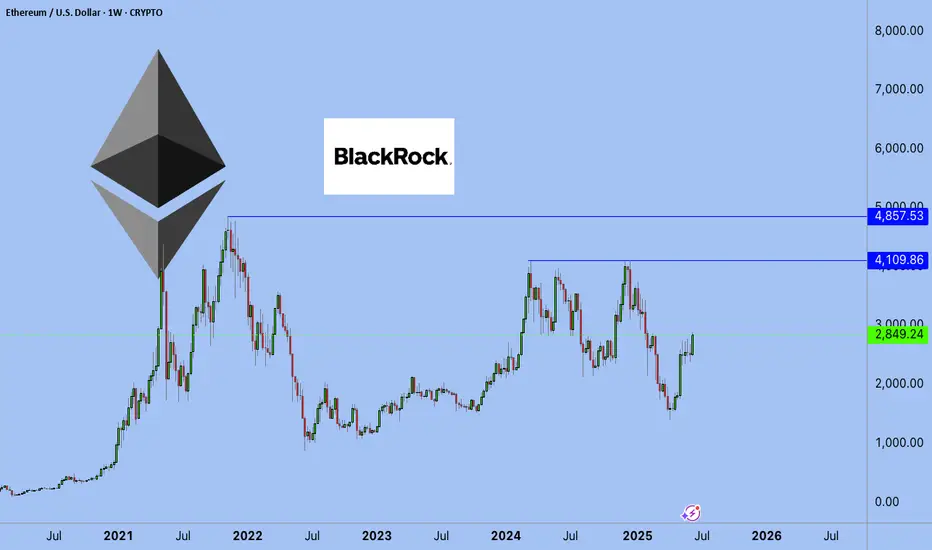
Meanwhile, BlackRock - a black hole with a trust-backed logo - just absorbed 42,000 ETH more.
Yesterday, you may have read this "regular" headline:
BlackRock increases its Ethereum exposure to $4 billion, adding $109.5 million via ETFs.
But here’s w
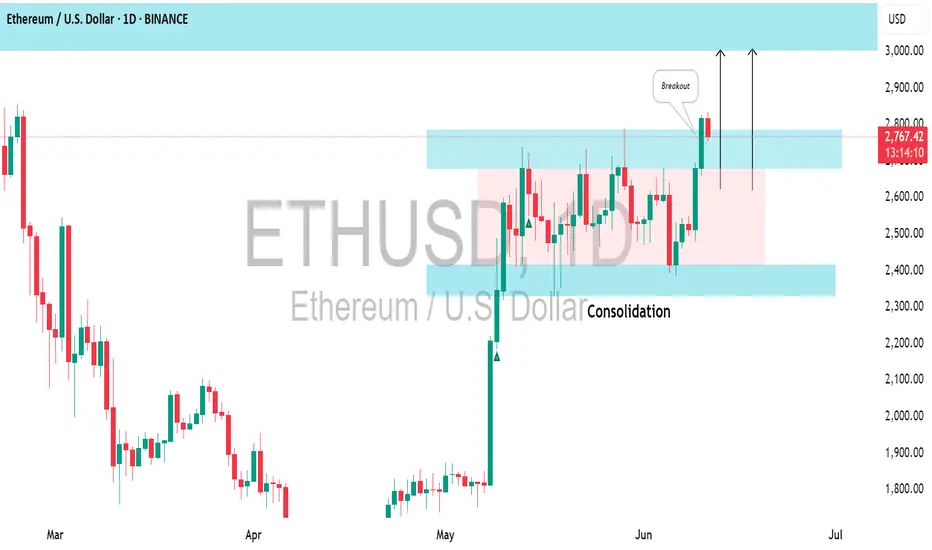
ETHEREUM (ETHUSD): Bullish Continuation is Coming?!📈ETHEREUM is in a long-term bullish trend, but since late May, it has been consolidating within a horizontal range.
However, the price bounced yesterday and closed above the range's resistance, which is likely to initiate a trend-following movement.
The next resistance level is at 3000.
Ethereum - This structure decides everything!Ethereum - CRYPTO:ETHUSD - trades at a key structure:
(click chart above to see the in depth analysis👆🏻)
After Ethereum retested the previous all time high in the end of 2024, we saw quite a harsh move lower. This move was followed by an expected recovery, however Ethereum is still trading bel

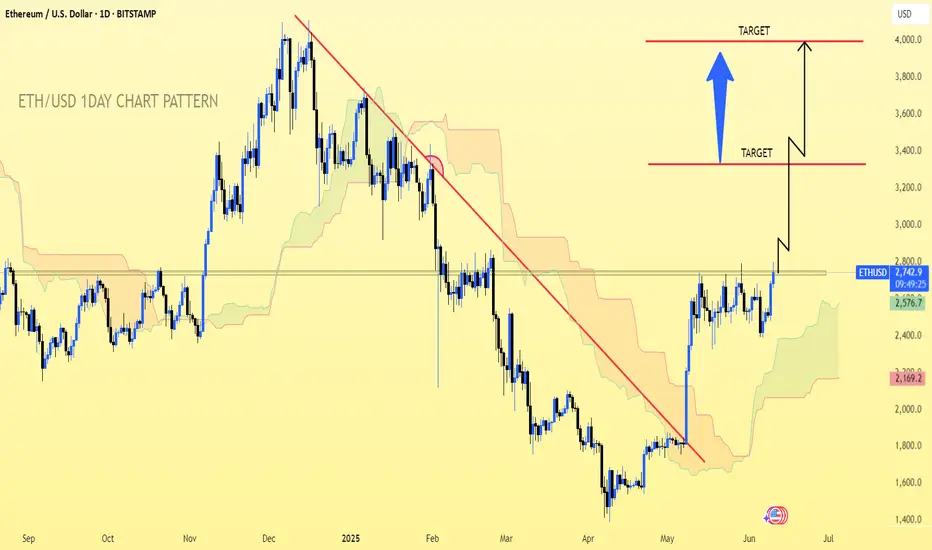
ETH/USD.1D CHART PATTERN.I'm looking at a long trade idea on ETH/USD with the following structure:
Buy Entry: $2,740
Target 1: $3,320
Target 2: $4,000
Here's a breakdown of the trade setup and key considerations:
---
📈 Trade Summary
Parameter Value
Entry $2,740
Target 1 $3,320
Target 2 $4,000
Potential Upside (to
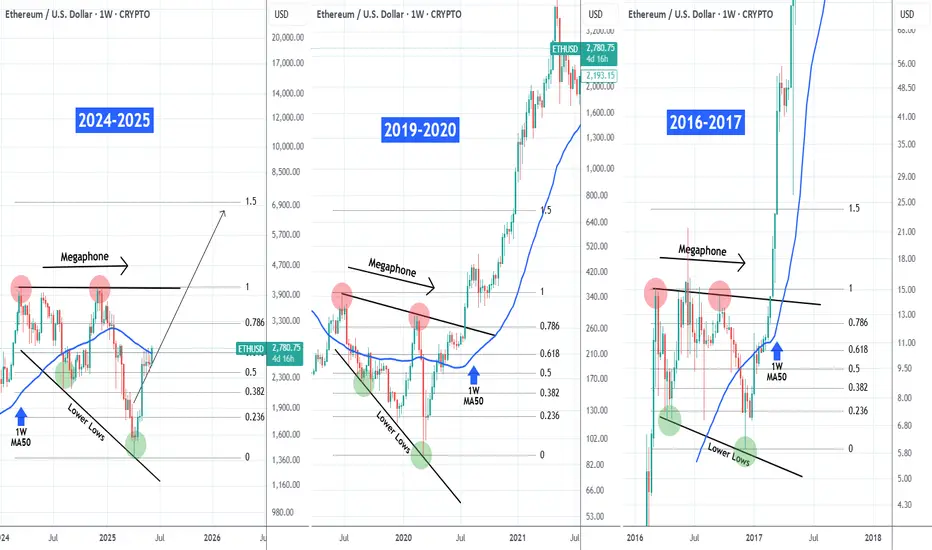
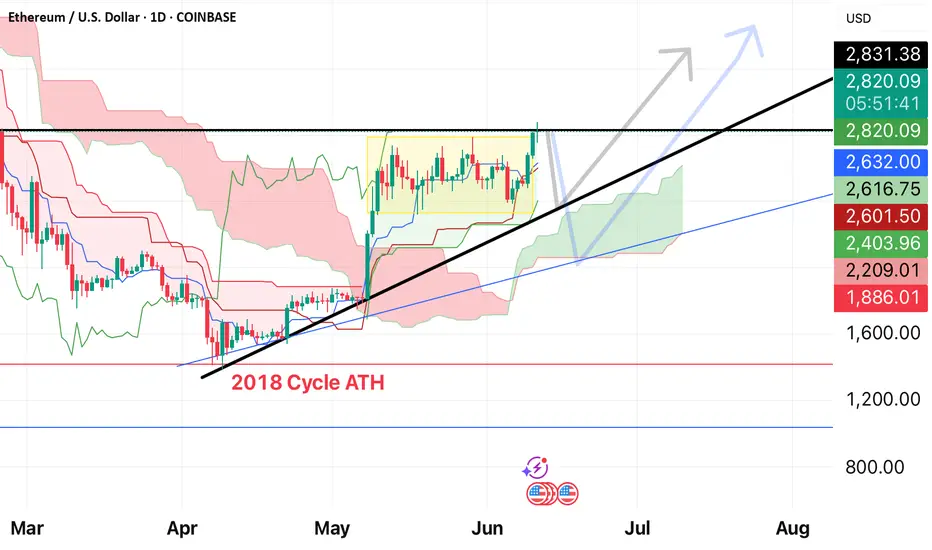
ETHEREUM This Megaphone emerged on all previous Cycles.Ethereum (ETHUSD) is showing incredible strength at the moment as it broke above its 1W MA50 (blue trend-line) and its goal now will be to close the week above it.
This resembles May 2020 and January 2017 when again the price was struggling to break above its 1W MA50, all within a similar Megaphone
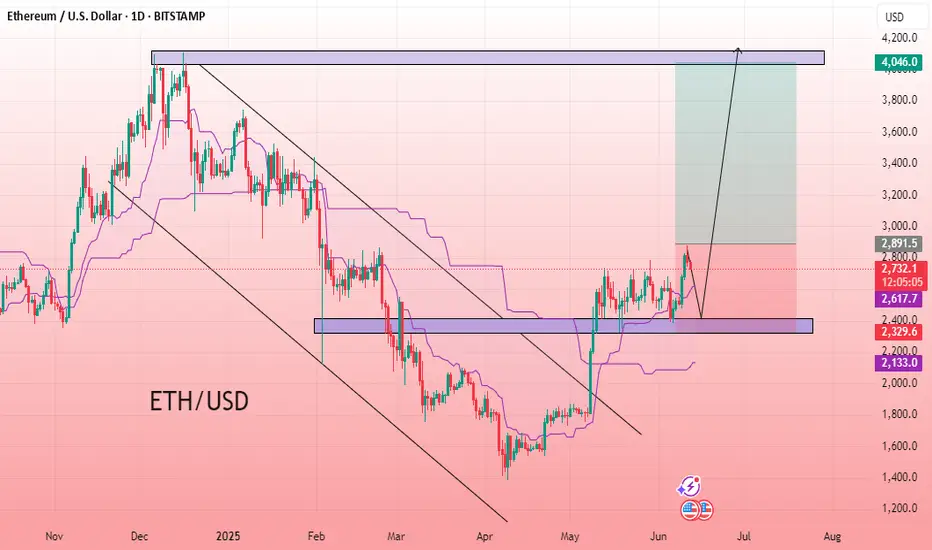
ETH/USD LONG SETUPThe chart displays the Ethereum/U.S. Dollar (ETHUSD) price action on a 1-day timeframe. The price has broken through a descending channel, indicating a potential buying opportunity. A blue rectangle highlights a support zone, and a blue shaded area projects a potential price increase. The current pr
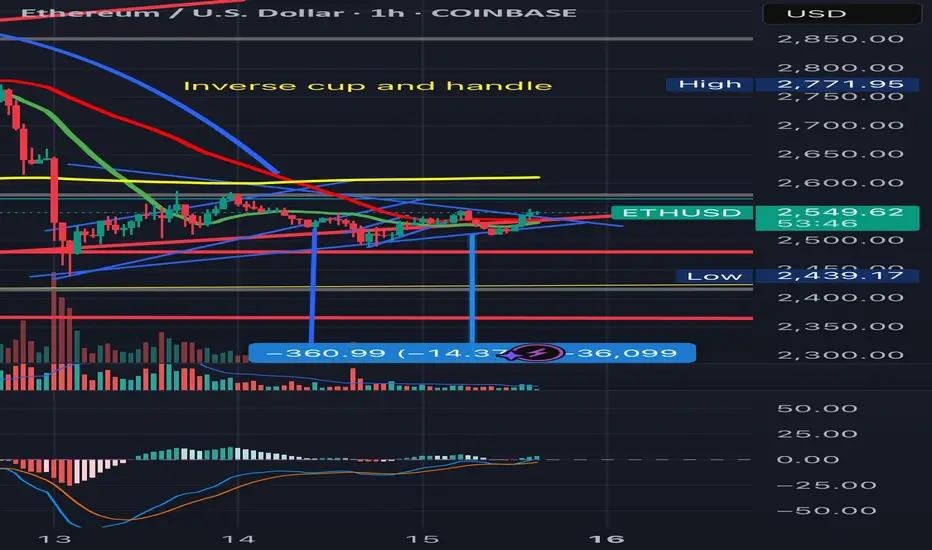
Inverse cup and handle + Symetrical triangle (continuation) ETHInverse cup and handle + Symetrical triangle (down)
Bearish
Target 2100 ish
Thank me later,
The Short Master
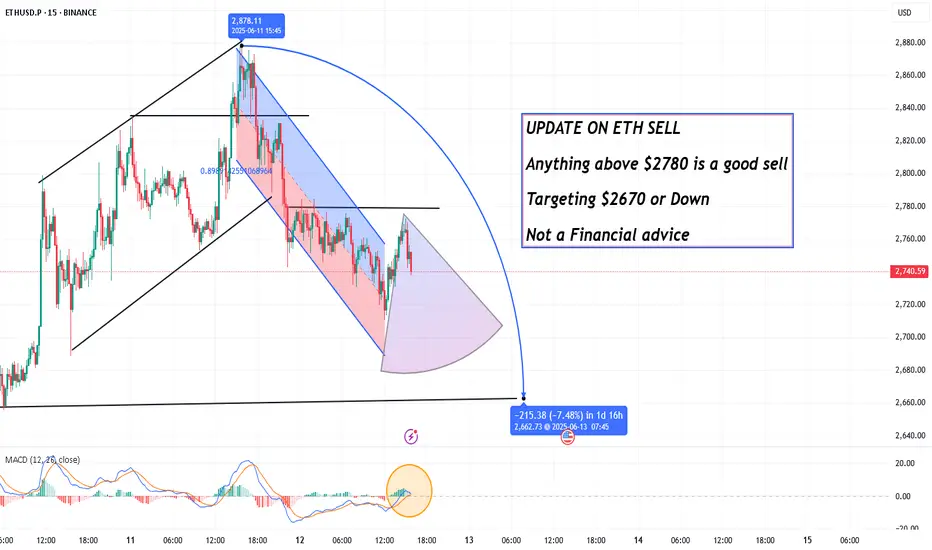
UPDATE ON ETH SELL ,Anything above $2780 is a good sellUPDATE ON ETH SELL
Anything above $2780 is a good sell
Targeting $2670 or Down
Not a Financial advice
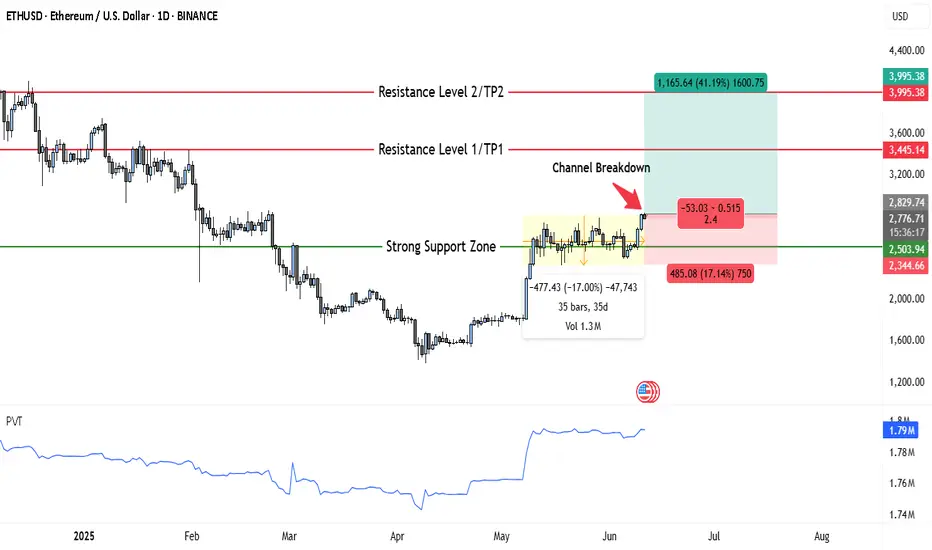
ETH Just Broke Out — Here’s Why $3,445 and $3,995 Are TPsEthereum is showing a strong bullish structure on the daily chart, having recently broken out of a month-long consolidation channel. After spending over 35 days trading in a narrow sideways range between approximately $2,345 and $2,780, ETH has now pushed through the upper boundary of that zone, sig
ETH Short to Support or breakout candle retestIf it is and ascending triangle and things are bearish we can go deep into the cloud support
If it's super bullish we will quickly just test the trend line of the last breakout candle
See all ideas
Summarizing what the indicators are suggesting.
Oscillators
Neutral
SellBuy
Strong sellStrong buy
Strong sellSellNeutralBuyStrong buy
Oscillators
Neutral
SellBuy
Strong sellStrong buy
Strong sellSellNeutralBuyStrong buy
Summary
Neutral
SellBuy
Strong sellStrong buy
Strong sellSellNeutralBuyStrong buy
Summary
Neutral
SellBuy
Strong sellStrong buy
Strong sellSellNeutralBuyStrong buy
Summary
Neutral
SellBuy
Strong sellStrong buy
Strong sellSellNeutralBuyStrong buy
Moving Averages
Neutral
SellBuy
Strong sellStrong buy
Strong sellSellNeutralBuyStrong buy
Moving Averages
Neutral
SellBuy
Strong sellStrong buy
Strong sellSellNeutralBuyStrong buy
Displays a symbol's price movements over previous years to identify recurring trends.
Curated watchlists where ETHUSD.P is featured.

Gen 2: Crypto is here to stay - and it's brought some friends…
19 No. of Symbols

Proof of Work: Embracing the crunch
27 No. of Symbols

Smart contracts: Make the smart decision
36 No. of Symbols
Staking Coins: Pick up a stake
18 No. of Symbols

Top altcoins: Choose your alternatives carefully
28 No. of Symbols
See all sparks