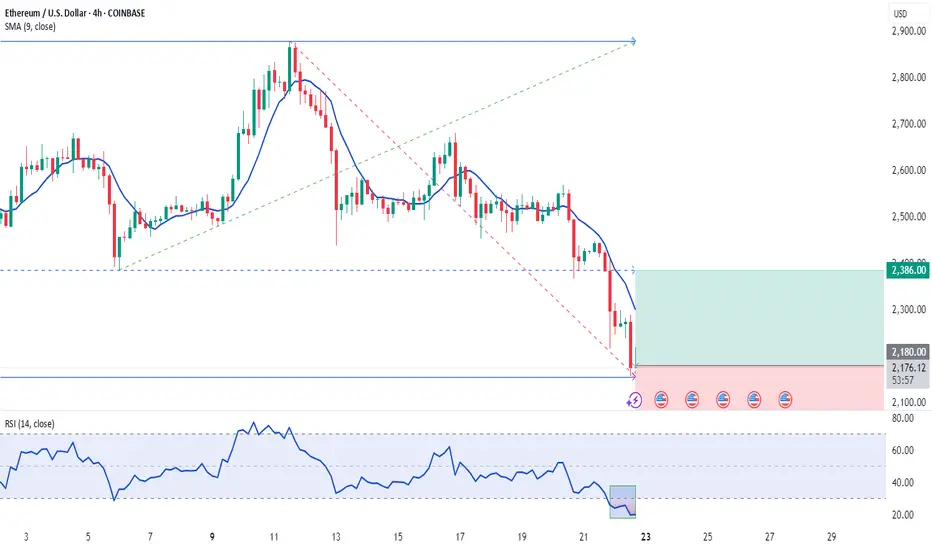
ETHUSD 4H Chart | ETH Bearish SetupThis chart highlights a possible bearish breakdown scenario for Ethereum (ETHUSD) on the 4H timeframe.
🔍 Key Levels:
Breakdown Confirmation Level: $2,362
Target 1: $2,151
Target 2: $1,954
(Optional Target 3: $1,750 if added)
📉 After multiple failed attempts to break above resistance, ETH price is now testing a critical support zone. A confirmed breakdown below this level could trigger further downside towards the mentioned targets.
Ichimoku Cloud shows weakening bullish momentum, supporting the potential for a bearish move.
Use Proper Money Management
ETHUSD.P trade ideas

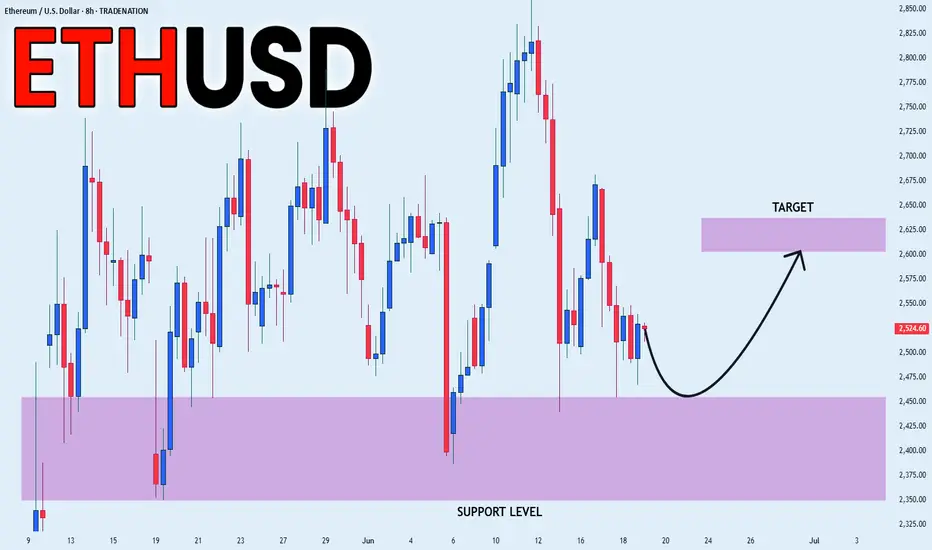
ETHEREUM LOCAL LONG|
✅ETHEREUM is going down now
But a strong support level is ahead at 2,375$
Thus I am expecting a rebound
And a move up towards the target of 2,600$
LONG🚀
✅Like and subscribe to never miss a new idea!✅
Disclosure: I am part of Trade Nation's Influencer program and receive a monthly fee for using their TradingView charts in my analysis.
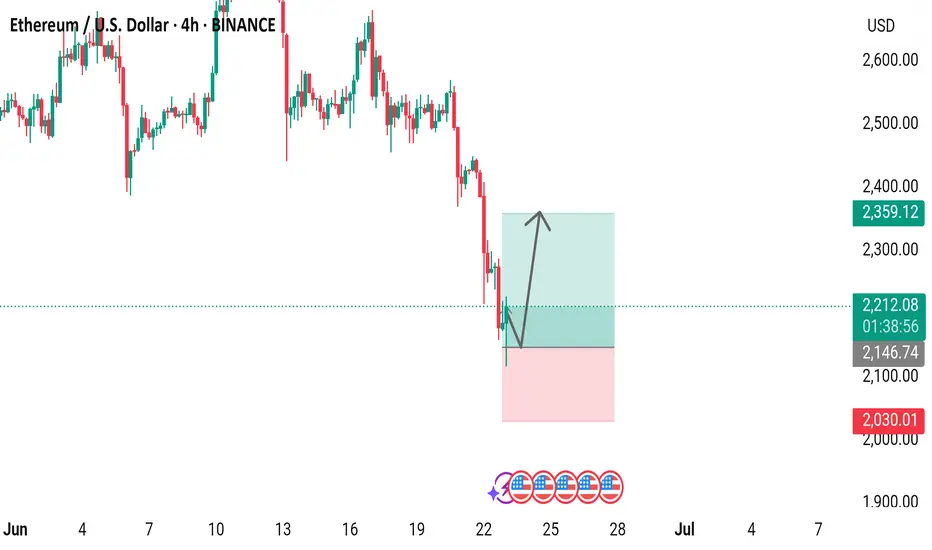
Ethereum/US Dollar 4-Hour Chart (BINANCE)4-hour price movement of Ethereum (ETH) against the US Dollar (USD) on the BINANCE exchange. The current price is $2,211.36, reflecting a decrease of $85.21 (-3.71%). The chart highlights a recent downward trend with a potential support zone between approximately $2,100 and $2,200, followed by a possible upward movement as indicated by the shaded area. The data is captured as of June 23, 2025.
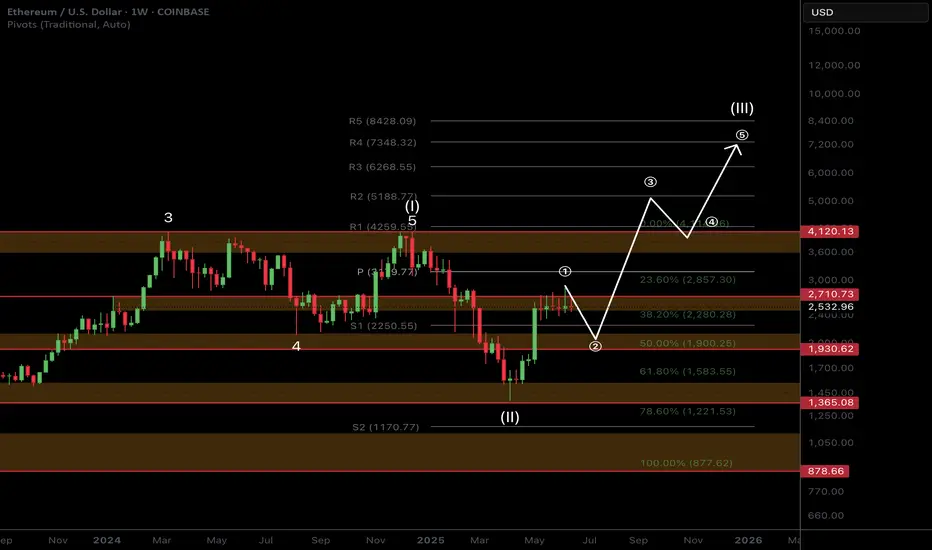
ETH Macro Analysis☕ 𝙂𝙈. CRYPTOCAP:ETH Macro analysis update...
📈 𝙇𝙤𝙣𝙜 𝙩𝙚𝙧𝙢 outlook remains unchanged and recent price action printing a doji. Target is still $7k for this cycle.
📉 𝙎𝙝𝙤𝙧𝙩 𝙩𝙚𝙧𝙢 outlook has investors looking lower towards the $1900 target but this isn't guaranteed to be reached and price action may front tat $2200.
War escalation's and retail selling are keeping price suppressed. ETF inflows and staking continue to grow!
The time for patience continues. Money is made in the sitting, weathering volatility, not flipping in and out of trades on every bit of news and price movement
𝙏𝙚𝙘𝙝𝙣𝙞𝙘𝙖𝙡 𝘼𝙣𝙖𝙡𝙮𝙨𝙞𝙨
Price is consolidating at its recent highs. Consolidation under resistance has high probability of breaking out, the longer it remains the higher the probability.
Elliot Wave (EW) analysis suggests a motif wave ended at the $2700 resistance, with a wave 2 retracement underway, likely a shallow one.
Safe trading
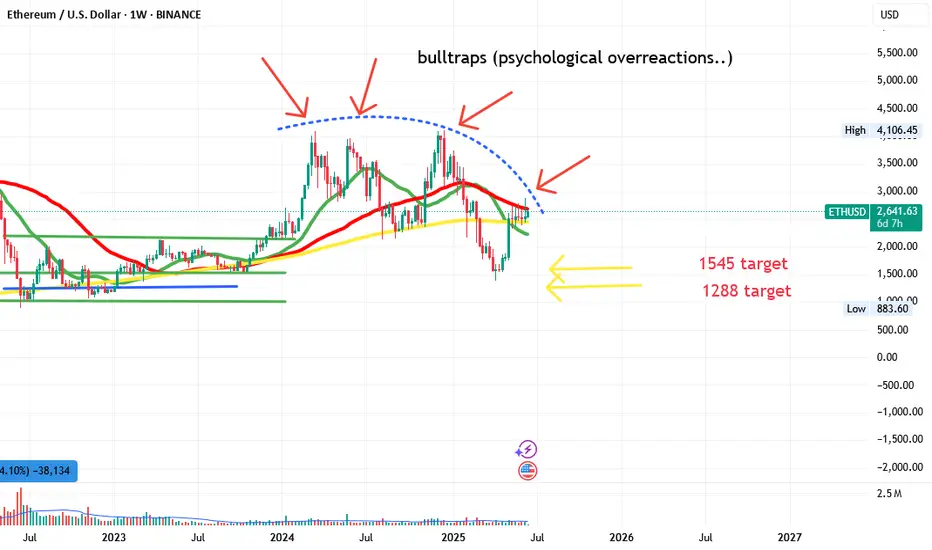
ETH SHORT TERM/MID TERM BEARISH PRICE MOVEMENTHello everyone,
i would like to share my view of ETH, in the future it will hit between 6500/7000 no doubt but short to mid term i believe we will see the lower price levels once again before it takes off to new highs!
targets: 1545 , 1288
Greetings,
The Short Master
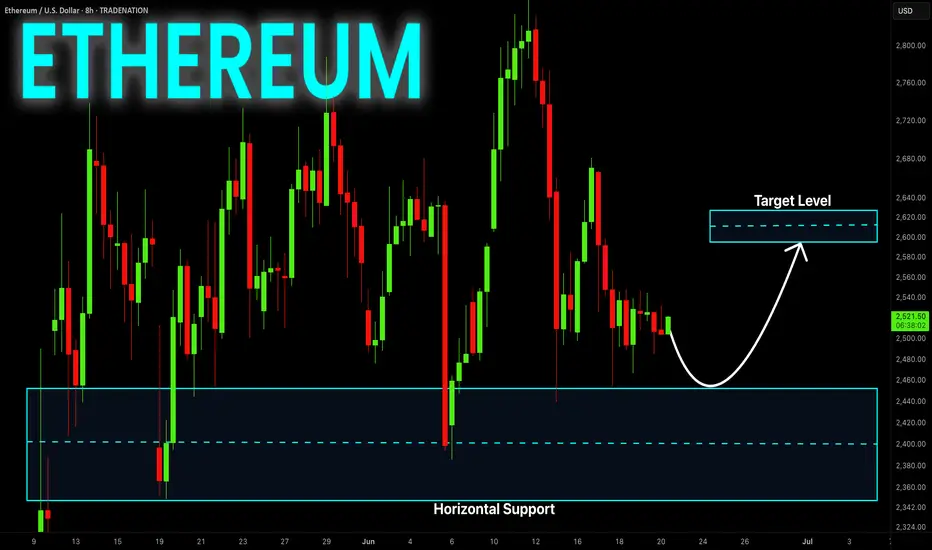
ETHEREUM Risky Long! Buy!
Hello,Traders!
ETHEREUM is consolidating
Above the horizontal support
Area around 2360$ and we
Are already seeing a local
Rebound from the level
So as we are bullish biased
A further price growth
Is to be expected
Buy!
Comment and subscribe to help us grow!
Check out other forecasts below too!
Disclosure: I am part of Trade Nation's Influencer program and receive a monthly fee for using their TradingView charts in my analysis.
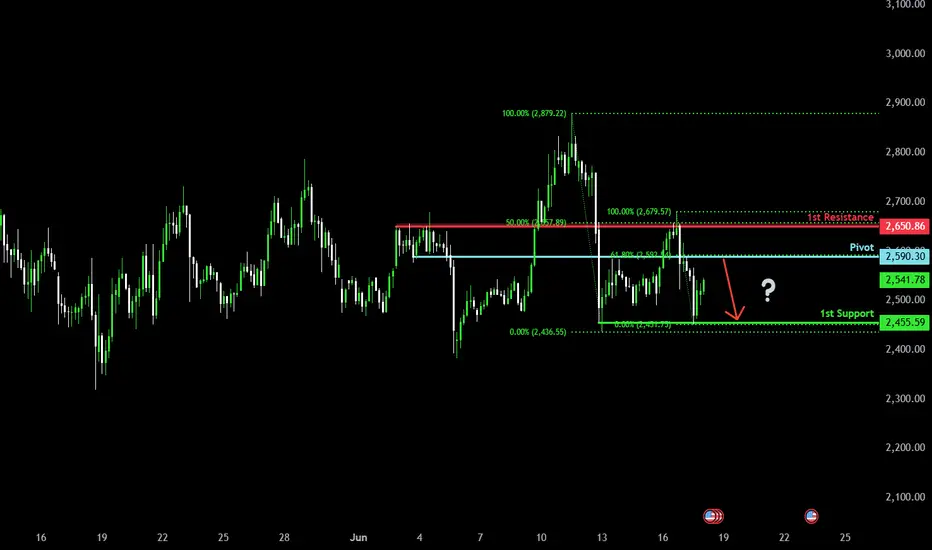
ETHUSD Breakdown Alert – Potential for Strong Bearish Move BelowEthereum (ETHUSD) is showing signs of weakness after multiple rejections from the resistance near 2553. The price is now consolidating just above the critical support zone around 2400, highlighted by the pink shaded area. This zone has historically acted as a strong demand area, but with repeated testing, its strength appears to be fading.
A breakdown below this zone may trigger a significant bearish move, targeting deeper levels in the coming sessions.
---
🔍 Technical Analysis:
Price Structure: ETH has been in a sideways consolidation phase between 2553 and 2400. Each bounce from support has shown diminishing bullish strength.
Volume: Declining buy volume near resistance, and increasing sell pressure near the support area, indicate potential for a breakdown.
Momentum: Lower highs and weak bullish candles suggest bears are gradually gaining control.
Trend Outlook: Bearish bias remains as long as price stays below 2553, with a strong breakdown likely below 2400.
---
📌 Key Levels:
Major Resistance: 2553
Immediate Support: 2400 (Critical Zone)
Bearish Targets:
TP1: 2215.1
TP2: 1967.4
TP3: 1775.3
---
⚠️ Trade Plan:
Sell Setup: Wait for a 4H candle to close below 2400 for confirmation.
Stop Loss: Above 2553 (resistance zone).
Risk Management: Use proper lot sizing and risk-to-reward ratio of at least 1:2.
Note: Avoid early entries without confirmation to prevent false breakouts.

You won't see ETHUSD cheaper than this, I'm buying at 3290Any price below 3300 is okay if the stop loss is still in place. The probability of this trade playing out is very high. Almost everybody is also bearish now. So I'm very comfortable in this trade
TP1 @ 2700
TP2 @ 3000
TP3 @ 5000

ETH/USD Price forms a falling wedge (bearsh pattern).''MARKET WILL GO DOWN MORE SOON STAY STRONG
A potential short entry (sell trade) is plotted just below the supply zone, with stop-loss above the previous structure high.
Displayed trade setup shows a well-calculated R:R, favoring reward over risk.
SL: Tight and above supply
TP: Extends deep into the green demand zone below

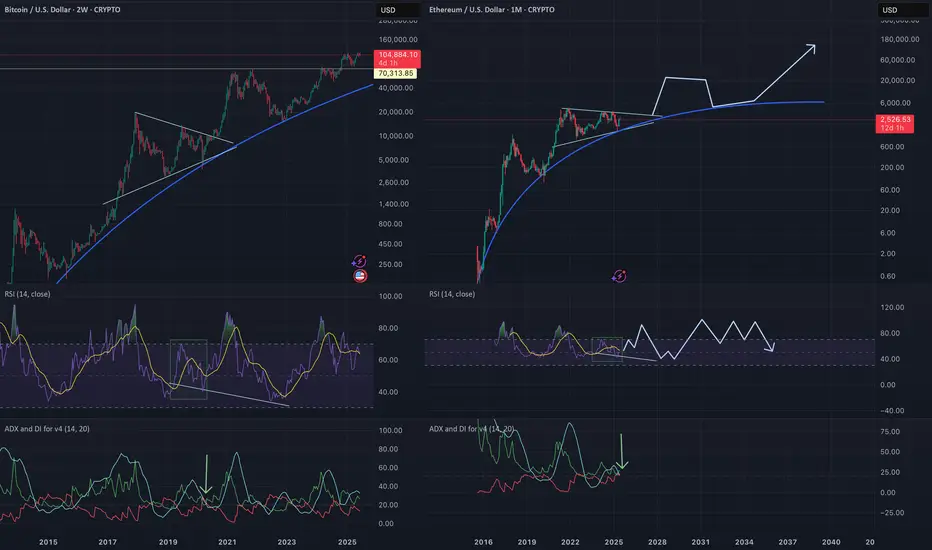
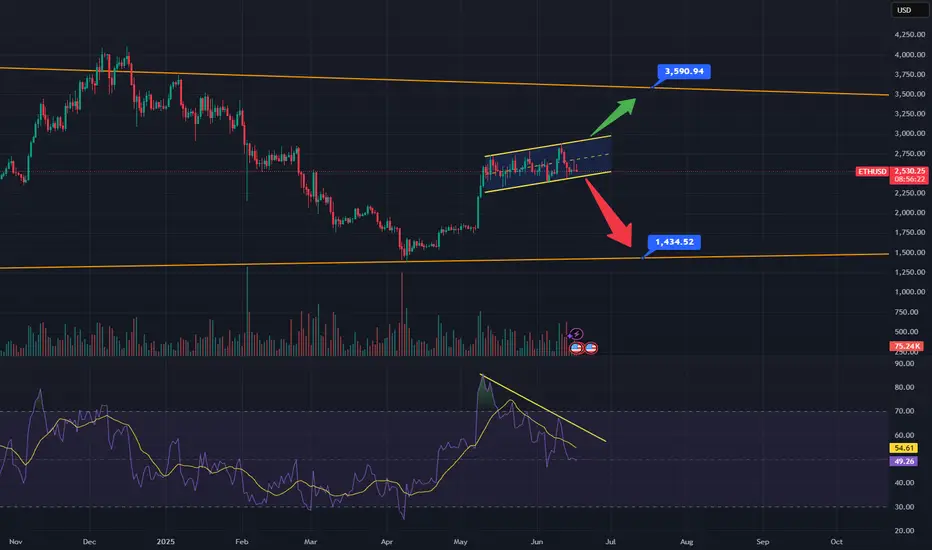
ETH: Breakout or Breakdown?As you can see ETH has been trading inside of this rising channel since the beginning of May. Rising channels favor a break to the downside, I've also highlighted some bearish divergence on the RSI which also points to a move down. The orange lines are long term weekly trend lines. The bottom orange line connects the 2022 lows through to the April lows, if price breaks down, expect a retest of the underside of the channel before moving down to the orange line around $1435. This would only be the third hit and third hits rarely breakdown. If it defies logic and breaks out above, look for it to move up to the top orange line around $3600, which connects the 2021 bull market highs through the march 24', May 24' and December 24' highs. If it comes into this area, it would be a 5th hit of a major weekly trendline, 5th hits have a very high probability of breaking out to the upside, if this happens it would be very bullish. In this scenario I would expect ETH to come down and test the top of said trendline as support before moving to new all-time highs. A Fibonacci retracement from the 2020 lows to the 2021 highs would put new price targets at $6,670 at the -0.382 as well as $7,800 at the -0.618.
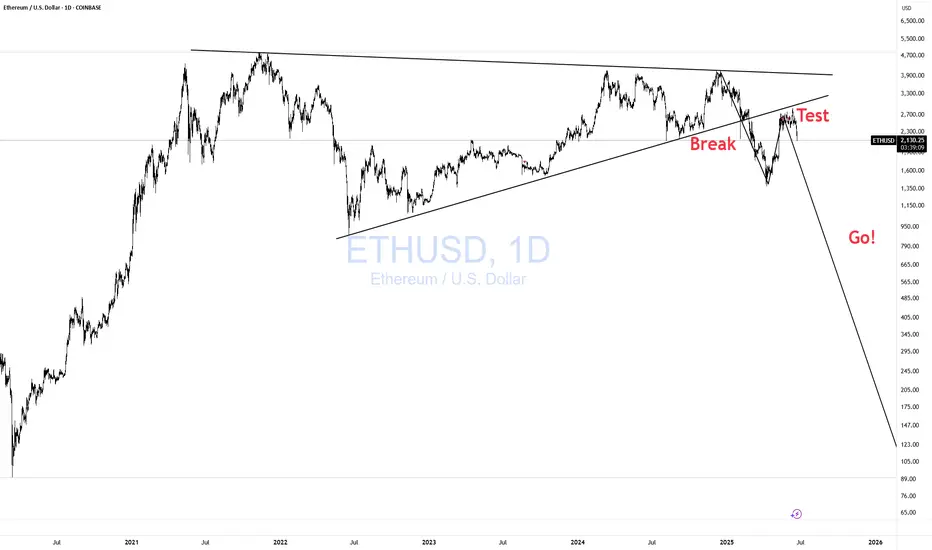
ETHUSD Break- Test- GO!!! Nothing Changed! 3rd EditionI have been warning about this for some time. Please visit my previous two posts for more info and updates.
Magic!
Click boost, follow, and subscribe for more. Let's get to 5,000 followers ))
ETH USD LONG!The price has been a trading in a channel on the 4hrs timeframe, and recently it traded on the lower bound of the channel and a reversal pattern is observed on the 1Hr timeframe.
Hence, the price is now expected to rise.
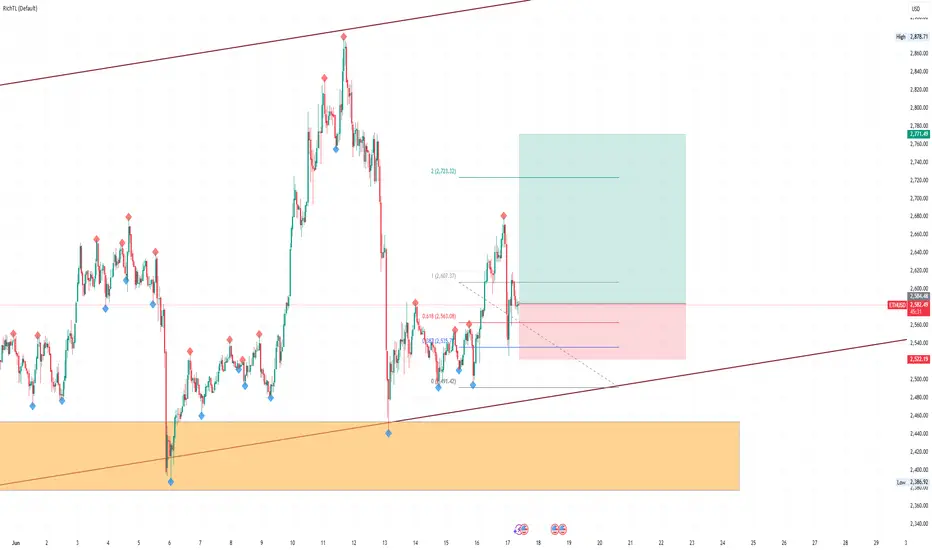
Potential bearish drop?Ethereum (ETH/USD) is rising towards the pivot and could reverse to the pullback support.
Pivot: 2,590.30
1st Support: 2,455.59
1st Resistance: 2,650.86
Risk Warning:
Trading Forex and CFDs carries a high level of risk to your capital and you should only trade with money you can afford to lose. Trading Forex and CFDs may not be suitable for all investors, so please ensure that you fully understand the risks involved and seek independent advice if necessary.
Disclaimer:
The above opinions given constitute general market commentary, and do not constitute the opinion or advice of IC Markets or any form of personal or investment advice.
Any opinions, news, research, analyses, prices, other information, or links to third-party sites contained on this website are provided on an "as-is" basis, are intended only to be informative, is not an advice nor a recommendation, nor research, or a record of our trading prices, or an offer of, or solicitation for a transaction in any financial instrument and thus should not be treated as such. The information provided does not involve any specific investment objectives, financial situation and needs of any specific person who may receive it. Please be aware, that past performance is not a reliable indicator of future performance and/or results. Past Performance or Forward-looking scenarios based upon the reasonable beliefs of the third-party provider are not a guarantee of future performance. Actual results may differ materially from those anticipated in forward-looking or past performance statements. IC Markets makes no representation or warranty and assumes no liability as to the accuracy or completeness of the information provided, nor any loss arising from any investment based on a recommendation, forecast or any information supplied by any third-party.
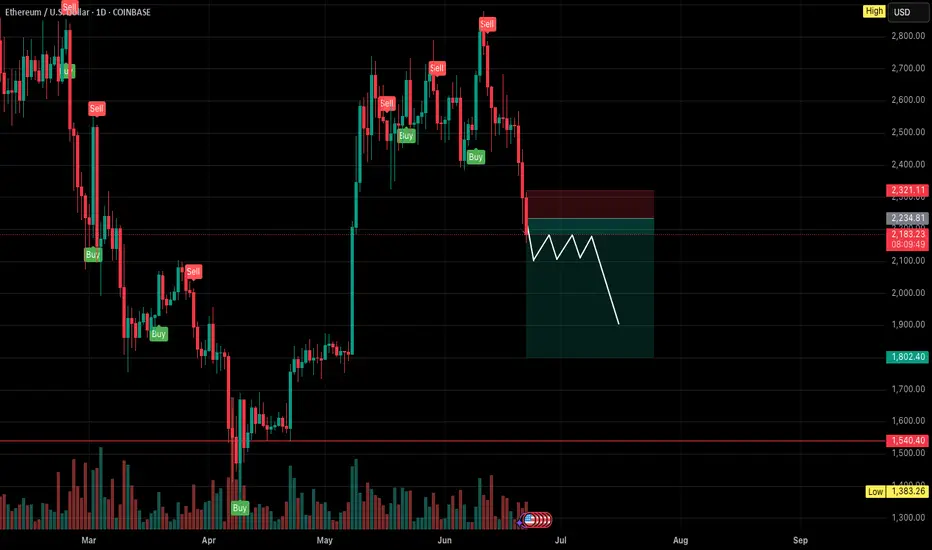
Strong bearish momentum for EthereumCOINBASE:ETHUSD Expecting bearish continuation for Ethereum. Consolidation around 2100 and either a push downward to 1900 - 1800 or if peace is made with Iran and Israel, price could reverse and push back to the 2000 range. Let me know your thoughts everyone :)
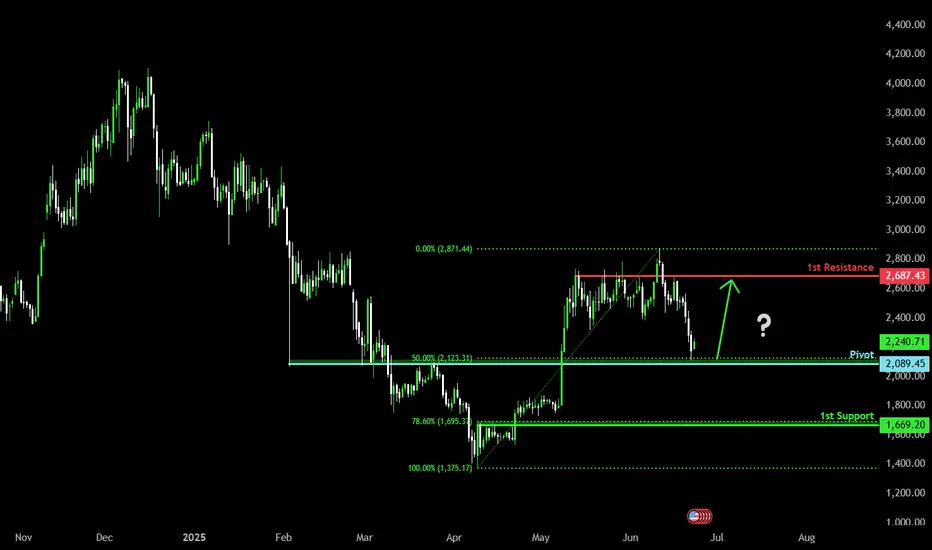
Bullish bounce off 50% Fibonacci support?The Ethereum (ETH/USD) is reacting off the pivot which has been identified as an overlap support and could bounce to the 1st resistance.
Pivot: 2,089.45
1st Support: 1,669.20
1st Resistance: 2,687.43
Risk Warning:
Trading Forex and CFDs carries a high level of risk to your capital and you should only trade with money you can afford to lose. Trading Forex and CFDs may not be suitable for all investors, so please ensure that you fully understand the risks involved and seek independent advice if necessary.
Disclaimer:
The above opinions given constitute general market commentary, and do not constitute the opinion or advice of IC Markets or any form of personal or investment advice.
Any opinions, news, research, analyses, prices, other information, or links to third-party sites contained on this website are provided on an "as-is" basis, are intended only to be informative, is not an advice nor a recommendation, nor research, or a record of our trading prices, or an offer of, or solicitation for a transaction in any financial instrument and thus should not be treated as such. The information provided does not involve any specific investment objectives, financial situation and needs of any specific person who may receive it. Please be aware, that past performance is not a reliable indicator of future performance and/or results. Past Performance or Forward-looking scenarios based upon the reasonable beliefs of the third-party provider are not a guarantee of future performance. Actual results may differ materially from those anticipated in forward-looking or past performance statements. IC Markets makes no representation or warranty and assumes no liability as to the accuracy or completeness of the information provided, nor any loss arising from any investment based on a recommendation, forecast or any information supplied by any third-party.
Ethereum: How Deep Into the Buying Area?📉 CRYPTO:ETHUSD is currently testing the extreme buying zone $2140–$1970 — a key area where a bullish reaction is anticipated. But if the bounce fails to materialize next week, eyes shift to the next potential demand zone near $1800.
This level aligns with prior structure and could offer a stronger base for the next leg higher — as long as the broader structure remains intact.

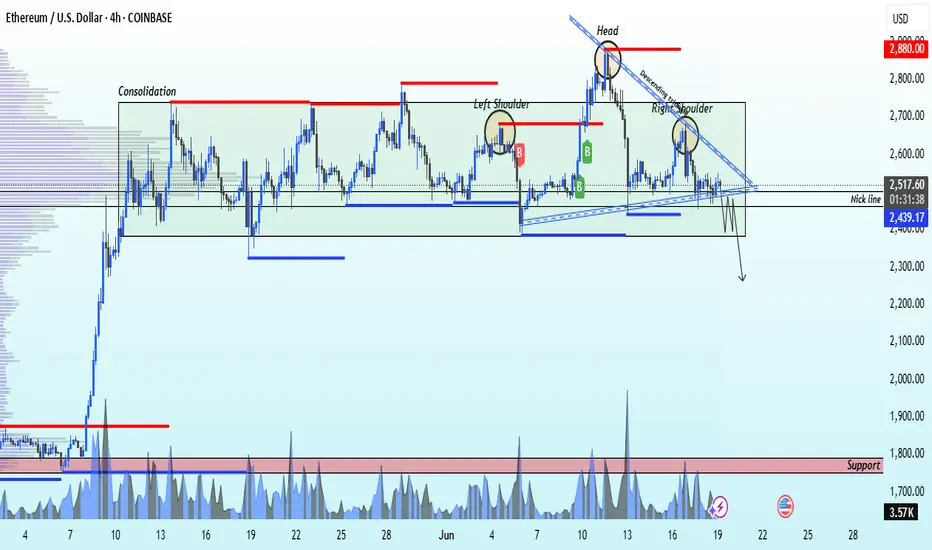
ETHUSD selling momentum head and shoulder 📉 ETH/USD Technical Breakdown Alert 📉
🚨 Pattern Formation: Head & Shoulders + Descending Triangle 🚨
On the 4H time frame, ETH/USD has confirmed a Head and Shoulders pattern, with a strong descending triangle breakdown from the neckline at $2,450.
🔻 Bearish Momentum Building
The market structure is signaling further downside pressure. A clean break below the neckline has triggered a strong sell signal.
🎯 Technical Target
1st Support Zone: $1,765
(Watch this level for potential bounce or further continuation)
💡 This setup aligns with classic bearish continuation patterns — risk management is key as always.
📊 Stay sharp, trade smart.
👉 Like, Follow, Comment & Join our community for more real-time updates and technical setups.
— Livia 😜
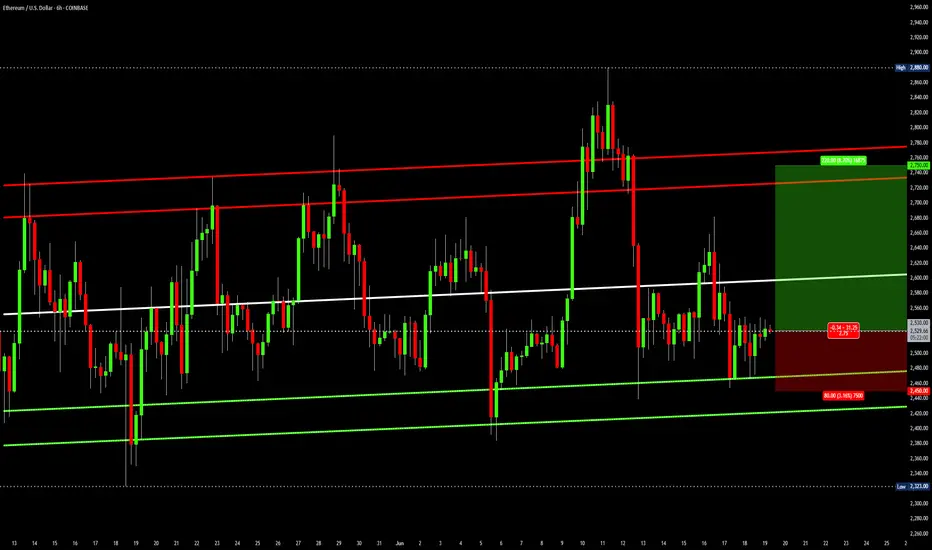
Ethereum channelThis is a straightforward analysis. Ethereum has been trading in an ascending parallel channel for 6 weeks now. As long as this pattern stays valid, ETH is a long at the bottom and short at the top of the channel, repeat. Round numbers support is 2450 and resistance is 2750.
Trade idea:
Long: 2530
Profit: 2750
Stop: 2450
Ethereum - This structure decides everything!Ethereum - CRYPTO:ETHUSD - trades at a key structure:
(click chart above to see the in depth analysis👆🏻)
After Ethereum retested the previous all time high in the end of 2024, we saw quite a harsh move lower. This move was followed by an expected recovery, however Ethereum is still trading below a key structure. Either move is still possible and will shape the future of Ethereum.
Levels to watch: $2.500, $4.000
Keep your long term vision!
Philip (BasicTrading)

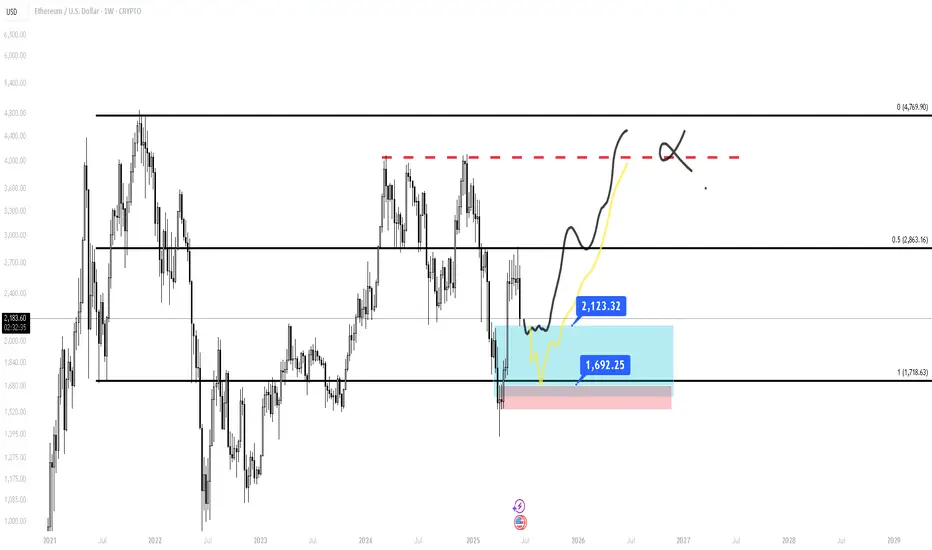
Ethereum (ETH/USD) Weekly Chart Trend Analysis Ethereum (ETH/USD) Weekly Chart Trend Analysis Using Trendline, Fibonacci, and Technical Indicators
In this article, we analyze the overall trend of Ethereum (ETH) against the U.S. Dollar (USD) based on the weekly chart using essential technical tools such as trendlines, Fibonacci retracement/extension, moving averages, and key indicators. These tools help identify support and resistance levels, price momentum, and potential medium- to long-term scenarios.
1. Trendline Analysis
In the weekly chart, the trendline shown with a dashed gray line acts as a key resistance. This line is drawn from the early 2024 high around $4,127 to the late 2024 low near $1,376. This downtrend line reflects continued bearish pressure over several months.
Recently, ETH attempted to breach this trendline. Price has touched or hovered around the line a few times, but weekly candles have not decisively closed above it. A confirmed breakout with multiple weekly closes above this trendline would signal a potential shift from a downtrend to an uptrend.
2. Fibonacci Retracement and Extension Analysis
The Fibonacci retracement tool was applied from the low of $1,376 to the high of $4,127. Key levels are:
0.236 (~$2,026): First major support level after a significant pullback. ETH bounced strongly from here.
0.382 (~$2,428): Current key resistance where price is consolidating. A close above this level would open the path to higher targets.
0.618 (~$3,077): A popular target level in bullish retracements.
1.0 (~$4,127): The previous cycle high. A breakout here would establish a Higher High pattern.
Extension levels (1.272, 1.618, 2.0): Used to project long-term bullish targets beyond the previous high. These lie at $4,875 / $5,828 / $6,878 respectively.
3. Moving Averages (EMA) Analysis
The chart features Exponential Moving Averages:
EMA 10-week (yellow): Tracks short-term trends. Currently flattening.
EMA 50-week (purple): Serves as a medium-term resistance. Price is hovering near this level.
EMA 200-week (white): A long-term structural support. ETH remains above this, indicating it has not yet entered a full bearish market phase.
Holding above the EMA 200 is a positive structural sign, while the flattening of EMA 10 may hint at short-term buying exhaustion.
4. Indicator Analysis
Stochastic RSI: Currently in the Overbought zone with a bearish crossover, indicating a possible short-term pullback.
RSI (Relative Strength Index): Formed a bullish divergence from the recent lows and is slowly climbing. However, it is still below the 55 level, suggesting the uptrend momentum is not yet fully confirmed.
5. Trend Scenarios and Strategic Outlook
Scenario 1: Bullish Continuation
Condition: Price closes above $2,428 and EMA 50.
Next Targets: $3,077 / $3,539 / $4,127
Strategy: Consider long positions on pullbacks above $2,428.
Scenario 2: Sideways Consolidation
Condition: Price remains between $2,026 and $2,850.
Strategy: Range trading — buy near $2,050 and sell near $2,800-$2,850.
Scenario 3: Bearish Breakdown
Condition: Price breaks below $2,026 and EMA 200 decisively.
Downside Targets: $1,650 / $1,500 / $1,376
Strategy: Stay in cash or open short positions with proper risk management.