Ethereum Technical Breakdown – Support Zone in FocusETHUSD – Channel Breakdown and Support Retest in Play (4H Chart)
Ethereum has recently broken below a rising channel structure on the 4H timeframe, indicating a possible shift in short-term momentum.
🔹 Channel Structure: Price maintained higher highs and higher lows within a well-defined ascending channel.
🔹 Breakdown: A clean break below the lower trendline suggests weakening bullish momentum.
🔹 Support Zone: ETH is approaching a previously tested support area, which may act as a reaction zone.
🔹 Retest Potential: If price moves back upward, watch for a retest of the broken channel as resistance.
🔹 Risk Area Highlighted: If support fails, further downside may be possible.
This chart is shared for educational and technical analysis purposes only. No financial advice is being offered.
ETHUSD.P trade ideas

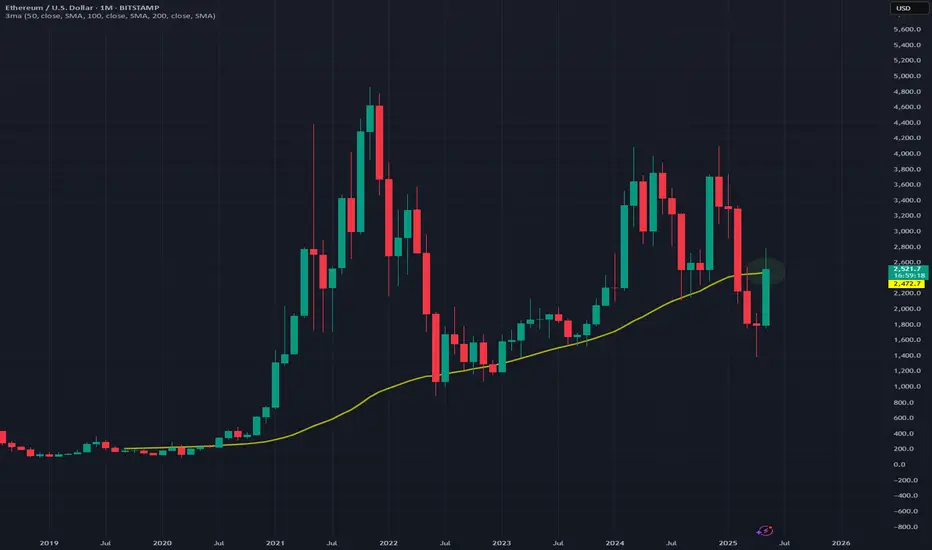
June Will Be Good ETHUSD ETH has reclaimed the 50MA this month and with a day until June i suspect the bull action will continue
Monthly chart with the 50MA in yellow
Keen to see where this goes
$ETH Ethereum Breakdown Threatens Channel:
ETH is testing the lower boundary of the ascending channel. Repeated rejections from the midline and strong sell volume suggest weakness.
🔸 Key Support Zone at $2,450 – $2,420:
This zone is under pressure. A clean break below this area will confirm a breakdown from the channel structure, shifting bias bearish.
🔸 Downside Target: $2,300 – $2,250
If ETH fails to hold above the support zone, the next demand level lies around $2,300, with further potential downside toward $2,250.
🔸 Upside Target:
If Ethereum fails to break down and instead bounces from the current support zone ($2,450–$2,420), the upside target remains at $2,700 – $2,800, which is the upper boundary of the ascending channel shown in the chart.

ETH/USD indicating a bearish bias.Technical Features Identified:
1. Historical Price Action:
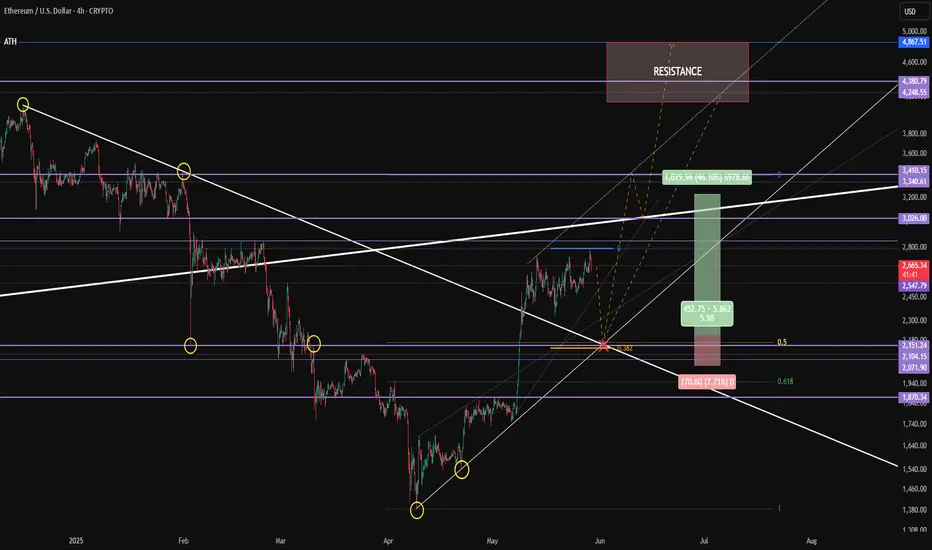
The chart shows a prolonged sideways consolidation (labeled as “side ways”) in late April and early May.
This period is marked with low volatility and horizontal price movement.
2. Breakout:
A breakout to the upside occurred around May 10th, with a significant rally leading into a new high.
This move formed a bullish impulse followed by multiple market structure shifts, possibly indicating the end of the uptrend.
3. Distribution Pattern:
Post-rally, the price appears to be forming a distribution zone or a head and shoulders/top formation, suggesting potential exhaustion of buying pressure.
The highlighted rectangle in dark grey seems to indicate a resistance/supply zone where price is struggling to break higher.
4. Forecasted Price Movement:
There are red arrows pointing downwards, indicating a bearish bias.
A projected path shows price may break below the current range and head lower.
The target zone is marked near the $2,125 - $2,050 range, implying a bearish target based on the current pattern.
5. Indicators & Tools:
Ichimoku Cloud is visible (light blue area), typically used to assess momentum, trend, and potential support/resistance levels.
Chart annotations include boxes for consolidation zones, arrows for forecast direction, and price labels for expected targets.
Liquidity sweep and wick-only analysis is applied, suggesting the trader is considering stop hunts or fake-outs in liquidity zones.
---
Conclusion & Sentiment:
This chart suggests a bearish outlook for ETH/USD in the near term. The trader anticipates a breakdown from the consolidation following a distribution pattern, with a projected downside target around $2,125. The analysis is focused on price action, liquidity dynamics, and support/resistance zones.

SELL ETH TO 1450*I am in no way a financial advisor and you should always do your own due diligence before placing any trade. Do not trade what you are not comfortable with losing. No trade is guaranteed.
Sell ETH
Stop loss : 2812
Take profit: 1450
1-2% risk on funded accounts
3-5% on live accounts

MTF outlook: local wave X/A finished, looking for retracementThe local wave X (or A) from April 8 low seems to have finished at $2790 on May 28th.
Now looking for a retracement (wave Y or B).
Locally, 0.382 Fib level at $2250 provide an interesting level for counter-trading, and I'd be looking for sign of local strength for a short-term long position.
I'll start looking for sign of strength at 0.5 level ($2087), but in reality, I'd really like to see the POC tapped at $1875 for the best risk-to-reward ratio, and to finish the wave X (or B) move. The POC is derived from the larger wave Y since Dec. 2024 to April 2025.
Timing is a guess but based on time-fib projection and understanding of the traditional market summer lull days, I'm expecting wave Y (or B) to finish late June to mid-July. June, July, August are dubbed the 'dog days of summer' because not a lot of price action happens, so trend usually stalls or corrects (this is statistical average). Just an intuitive guess.


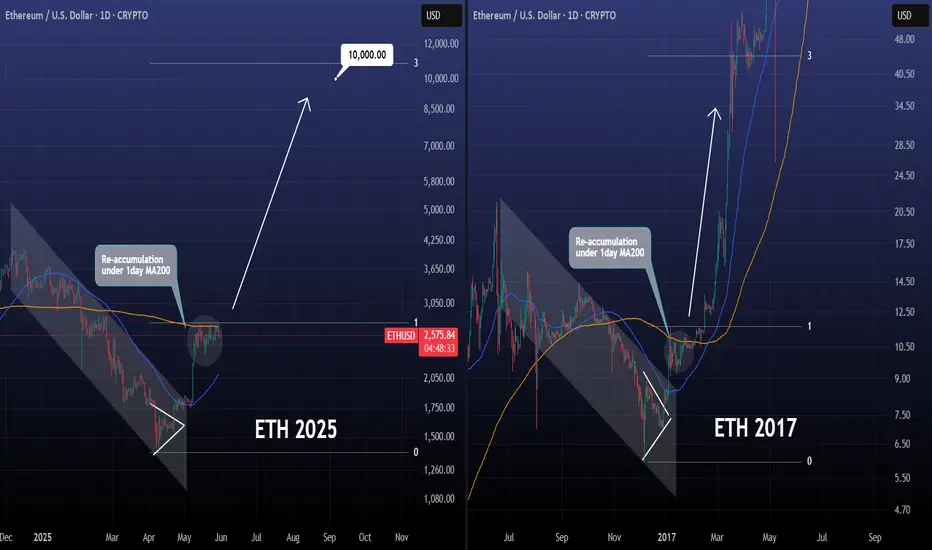
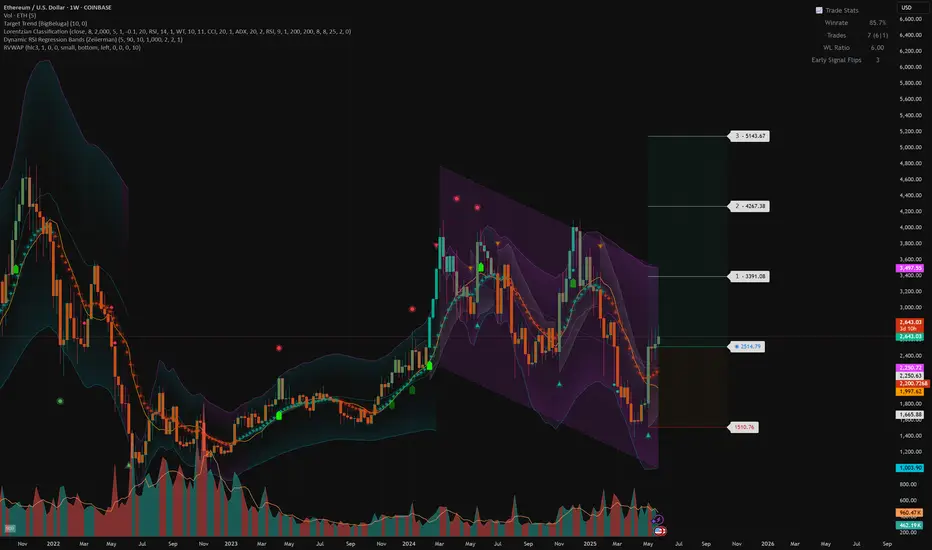
ETHEREUM can reach $10000 if 2017 is repeated.Ethereum / ETHUSD is consolidating under the 1day MA200 (resistance) and over the 1day MA50 (support).
The 2025 correction has been quite similar so far to 2016, both bearish Channels bottoming on a Triangle pattern and then rebounding.
In 2017 that rebound resulted in an insane rally above the 3.0 Fibonacci extension.
Even if the market doesn't rise this time this aggressively and that quickly, it can still approach the 3.0 Fib at 10000 and form the top for this Cycle.
Follow us, like the idea and leave a comment below!!
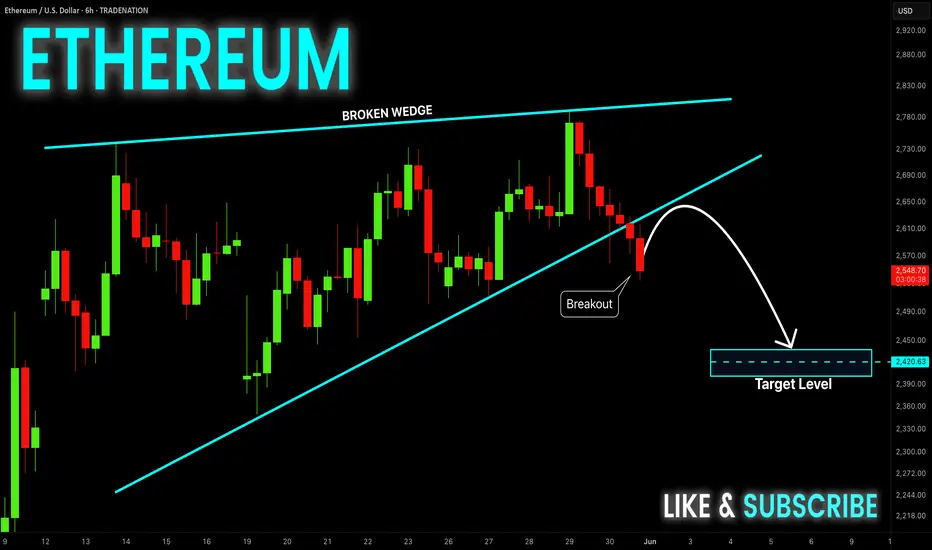
ETHEREUM Wedge Breakout! Sell!
Hello,Traders!
ETHEREUM was trading in an
Uptrend but then the coin
Formed a bearish wedge pattern
And we are now seeing a bearish
Breakout so we are locally
Bearish biased and we will be
Expecting a long awaited
Bearish correction
Sell!
Comment and subscribe to help us grow!
Check out other forecasts below too!
Disclosure: I am part of Trade Nation's Influencer program and receive a monthly fee for using their TradingView charts in my analysis.
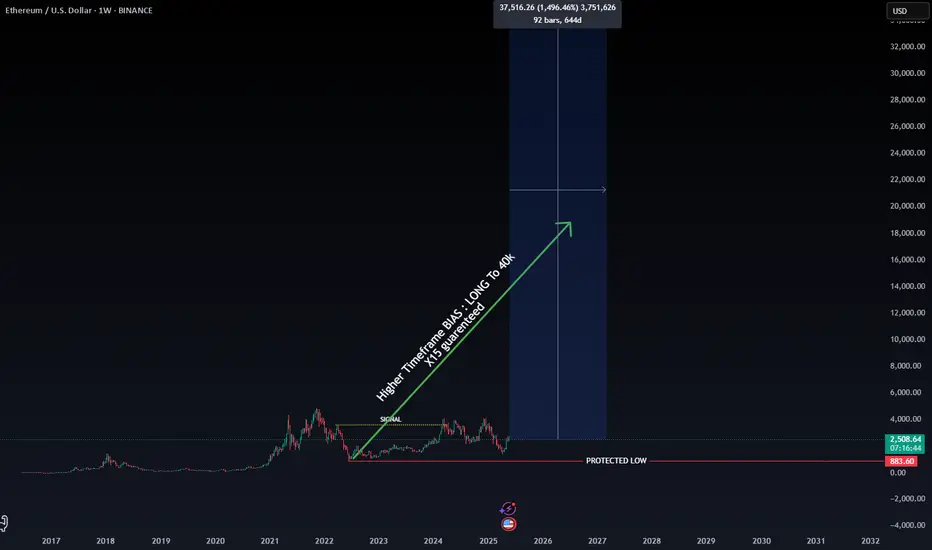
ETH Investors Are Confused, But the Algorithm Says $40K's Coming🚨 Ethereum: Confusion or Opportunity?
Many investors are currently confused — wondering whether Ethereum (ETH) is due for a deeper retracement… or if it’s about to skyrocket. So, what’s really going on?
According to our algorithmic model, ETH confirmed a long-term price target of $40,000 the moment it broke above $3,594 on March 11, 2024.
The pullback that followed?
It’s not a sign of weakness — it’s a golden entry opportunity for the next leg up with a garenteed x15 ROI from actual prices.
📉 The $883 low is considered a protected low, and according to our structure, it will likely remain untouched until ETH reaches $40,000.
💰 Why We’re Heavily Exposed to ETH
Given the current market conditions, we’ve allocated the majority of our capital to Ethereum, as it currently represents one of the most secure and promising assets in the crypto space for mid- to long-term positioning.
This isn’t just a trade — it’s a strategic investment.
🚀 Happy Trading,
ETHUSD INTRADAY coiling consolidation pattern resistance at 2,75Trend Overview:
Ethereum (ETH/USD) remains in a bullish trend, underpinned by a sequence of higher lows and a well-defined rising structure. Recent intraday price action reflects a consolidation phase, likely forming a bullish continuation pattern within the prevailing uptrend.
Key Technical Levels:
Support: 2,360 (primary), followed by 2,160 and 2,090
Resistance: 2,750 (initial), then 2,930 and 3,130
Technical Outlook:
A corrective pullback toward 2,360, which aligns with a prior consolidation zone, may offer a buy-the-dip opportunity. A successful retest of this level could set the stage for a continuation toward 2,750, 2,930, and 3,130 over the medium to long term.
However, a confirmed break and daily close below 2,360 would invalidate the near-term bullish outlook, increasing the risk of a deeper correction toward 2,160 and 2,090.
Conclusion:
ETH/USD continues to show bullish momentum as long as it holds above the 2,360 support level. A rebound from this zone would likely confirm the ongoing consolidation as a base for further upside. A breakdown below 2,360, however, would shift the short-term bias bearish, exposing Ethereum to deeper downside risk.
This communication is for informational purposes only and should not be viewed as any form of recommendation as to a particular course of action or as investment advice. It is not intended as an offer or solicitation for the purchase or sale of any financial instrument or as an official confirmation of any transaction. Opinions, estimates and assumptions expressed herein are made as of the date of this communication and are subject to change without notice. This communication has been prepared based upon information, including market prices, data and other information, believed to be reliable; however, Trade Nation does not warrant its completeness or accuracy. All market prices and market data contained in or attached to this communication are indicative and subject to change without notice.

Ascending TriangleETH tightening up above the 20 EMA, wearing off overbought conditions. Looks ready to go in coming days.

ETH is moving within the 2550.00 - 2.765.00 range👀Possible scenario:
Ethereum (ETH) reclaimed $2,600 support and is pushing toward key resistance at $2,850 after breaking out of a bullish pattern. Analysts see upside potential toward $3,800 if the rally holds. ETH is now testing the upper zone of its $2,220–$3,900 macro range, after bouncing from below $2,000 earlier this month. However, the May 30 expiration of $11.4B in BTC and ETH options could add short-term volatility.
While the Pectra upgrade boosted institutional appeal, JPMorgan notes Ethereum’s onchain activity remains weak, with flat daily transactions and addresses. Rising ETH supply and lower fees post-Dencun raise inflation concerns.
✅Support and Resistance Levels
Support level is now located at 2,550.00.
Now, the resistance level is located at 2,765.00.

Is Ethereum set to fire up ?Ethereum has been consolidating for the past 2 weeks between 2300 and 2700.
Upside resistance at 2700-2750 levels puts pressure on short-term prices.
A convincing close above the 2750 level triggers fresh upside in the short term, leading to a retesting of 3300 as an Initial target. Risk is defined at 2300. A close below this level will negate the bullish view.

Ethereum - flight path idea (with targets)4H timeframe
Long trade
Entry = $2,200
Areas of confluence:
- Bounce of the downtrend
- 382 fib
- Co-incides with a wick that acted as support / resistance @ 2,151
- Uptrend
TP1 = 3,230 / 46%
TP2 = 4,040 / 82%
SL = 2,040 / -8%
ETH weekly turning positive too targeting $5000 sl $1500Weekly trend turning slowly turning positive with daily already in a positive channel, expecting 5000 with corrections along the way. Dipping below $1500 would invalidate
Ethereum = MySpace of Crypto?I have been watching COINBASE:ETHUSD flirt with 2750 for the better part of May as all crypto has gone "risk on" with Bitcoin's All-Time-High push. This level is the 50% Retracement of the last major high in December 2024 to the low of April 2025. There is also significant Volume Profile Resistance from February matching this price action level. This level is good for a short and can even be managed with tight risk given the clear price structure at this level.
Normally I am a pure technical trader but I have a bearish fundamental bias on Ethereum...
Fundamentals:
Ethereum is dying. I know that may be unpopular to say but it is losing "network effect."
Ethereum used to be the standard for the smart contract use case of cryptocurrency but it is being replaced by competition namely Solana. I ask, "what does Ethereum do that Solana does not do cheaper/faster/better?" Even the President of the United States used Solana to create his scam meme coin. Value judgements aside the use case of smart contracts to create new tokens has proven to be popular and the market has chosen which chain to create them. It was no longer Ethereum.
The best analogy to Ethereum's fall from dominance would be to look back at social media companies like MySpace. At some inflection point for various reasons users choose to leave a platform for another. That is network effect and unfortunately for Ethereum it has already begun to lose it.

ETH – Multi-Timeframe Breakout Watch
CRYPTO:ETHUSD BINANCE:ETHUSD
📈 ETH is aligning strong bullish patterns across multiple timeframes:
⏱ On the 4H, price is pushing against the top of an ascending triangle — breakout attempt underway.
📆 On the 3D chart, ETH is emerging from a falling wedge and pressing into key horizontal resistance.
🗓 Monthly timeframe reveals a bullish pennant — signaling long-term buildup.
⚠️ With these structures converging, this breakout could be pivotal for ETH’s next major

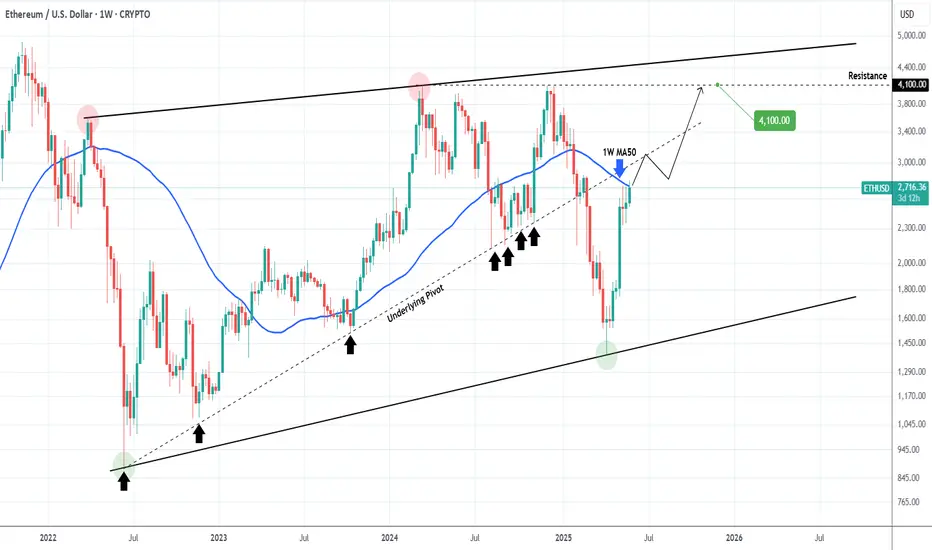
ETHEREUM Break above this level and things get real interesting!Ethereum (ETHUSD) broke above its 1W MA50 (blue trend-line) this week and will attempt to close the week above it to confirm the official restoration of the long-term bullish trend.
Regardless of that, there is another hidden trend-line that may dictate the pace of that potential bullish break-out and is no other than the underlying Pivot trend-line that started on the June 13 2022 market bottom and acted as Higher Lows up until February's Tariff fueled correction.
As a result, this is now posing as a Resistance and a break above it should technically deliver rallies similar to the Bullish Legs of 2023 - 2024.
Our 4100 Target remains intact.
-------------------------------------------------------------------------------
** Please LIKE 👍, FOLLOW ✅, SHARE 🙌 and COMMENT ✍ if you enjoy this idea! Also share your ideas and charts in the comments section below! This is best way to keep it relevant, support us, keep the content here free and allow the idea to reach as many people as possible. **
-------------------------------------------------------------------------------
💸💸💸💸💸💸
👇 👇 👇 👇 👇 👇
Ethereum - Expecting Bullish Continuation In The Short TermH1 - We have a clean bullish trend with the price creating a series of higher highs, higher lows structure.
This strong bullish momentum is followed by a pullback.
No opposite signs.
Until the two Fibonacci support zones hold I expect the price to move higher further.
If you enjoy this idea, don’t forget to LIKE 👍, FOLLOW ✅, SHARE 🙌, and COMMENT ✍! Drop your thoughts and charts below to keep the discussion going. Your support helps keep this content free and reach more people! 🚀
--------------------------------------------------------------------------------------------------------------------
Disclosure: I am part of Trade Nation's Influencer program and receive a monthly fee for using their TradingView charts in my analysis.

Ethereum Analysis (1D)
🔍 Top Consolidation
ETH is struggling to break and hold above the $2,780-2,810 resistance
Tight range for days, indicating accumulation without clear direction
🎭 Potential Bull Trap
“AMD-style” scenario: a false breakout today followed by a sharp rejection
Upward manipulation to hunt long stops
📉 Retracement Phase
After the rejection, expect ETH to retrace the recent bullish impulse
Technical target : test the 50% Fibonacci level (~$2,350) or the OTE zone around $2,300–2,250
🚀 Mega Breakout Incoming
Once manipulation and retracement phases complete, look for a massive bullish breakout
Next upside target: reclaim highs above $3,000+
👉 Watch For :
False break above $2,810
Confirmation of 50% retracement to validate renewed bullish momentum
Volume and price action in the $2,300-2,250 zone
💡 Summary : accumulation → bull trap → healthy retracement → launch into a new bullish leg.

#ETH/USDT#ETH
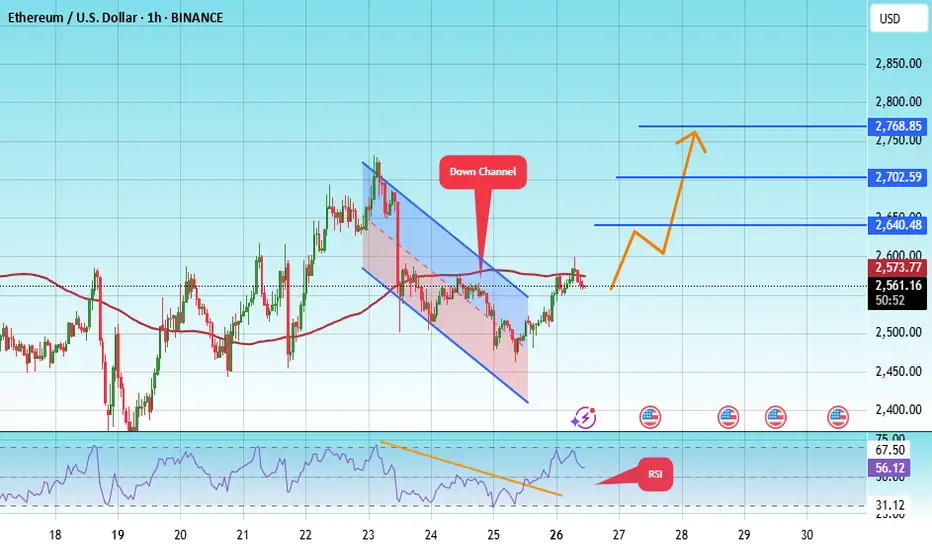
The price is moving within a descending channel on the 1-hour frame, adhering well to it, and is heading for a strong breakout and retest.
We are seeing a bounce from the lower boundary of the descending channel, which is support at 2465.
We have a downtrend on the RSI indicator that is about to break and retest, supporting the upward trend.
We are looking for stability above the 100 moving average.
Entry price: 2558
First target: 2640
Second target: 2702
Third target: 2768
Buying Ethereum Using the 3 Step Rocket Booster StrategyThe young people in my neighbourhood
have so much potential. But there is a problem.
They want to get the sweetness of life without
working for it. I get the high of getting into a
dopamine hit. But that's not the right way to see things.
Its not easy to be a serious young person.Infact when
I was younger, and i decided to be serious my fellow
Young mates: Teased me, bullied me, and laughed at me
For being serious.In fact they told me i would age faster
on my face.If you decide to take life seriously as
a young person.
You will benefit in the future sooner or later.
Look at this chart.What's so special about it?
It is following the rocket booster strategy.
What is the rocket booster strategy?
It has 3 Steps:
#1-The price has to be above the 50 EMA
#2-The price has to be above the 200 EMA
#3-The price should gap up in an uptrend.
Using this strategy is the reason
of how I found this crypto coin.
The Top 3 Facts About Ethereum
#1 Ethereum is a cryptocurrency built
using blockchain technology
#2-Ethereum is the second-largest cryptocurrency
In terms of market capitalisation.
#3-Ethereum has a market cap of about $329 billion Dollars.
Knowing when to buy Ethereum is very important
because if you buy it at the wrong time, you will
lose at least 70% of your capital.
How do i know?? because this is what happened to me.
The rocket booster strategy will help you.
By the way, i used the Trading View screener.
Rocket boost this content if you
Want a demonstration of the rocket booster
strategy using the trading brand new screener.
Remember Rocket boost this content to learn more.
Disclaimer: Trading is risky because you will lose money
Please use a simulation trading account
Before you trade with real money. Also learn risk management
and profit-taking strategies.
