Ethereum: The Bullish Cycle Starts Now!The minimum new 2025 All-Time High for Ethereum is $5,794. The next target sits at ~$8,500.
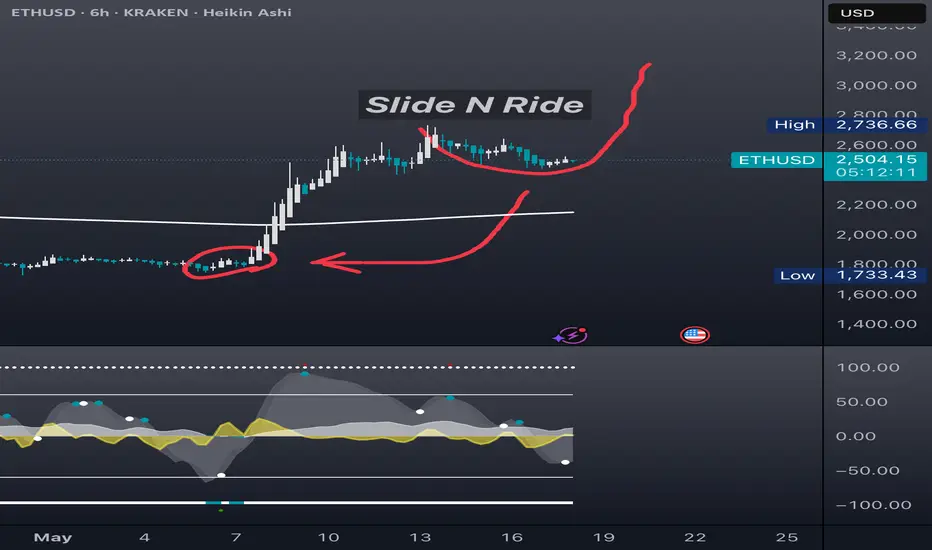
Ethereum took some time out and used this week to challenge resistance. Resistance was found at 0.5 Fib extension with exactitude, that is, $2,746.
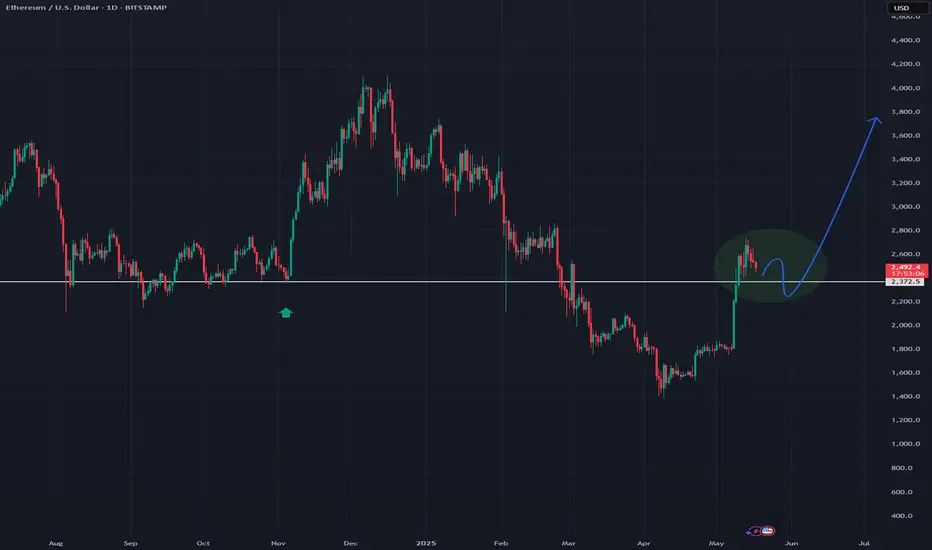
Two supports mainly: 1) $2,424 and 2) $2,026.
The bottom is in and it is really far away. The $2,026 is the 0.236 Fib extension and also the baseline of the rounded bottom pattern.
The correction low sits at $1,383 and Ethereum (ETHUSD) will never ever in its entire history trade at this price ever again. It is gone forever. Right now it is still relatively early but this will be more obvious as the month reaches its end.
Good evening my fellow Cryptocurrency trader, I hope you are having a nice Sunday and the week is about to close.
Ethereum is still early, early in its trading session based on the long-term bullish cycle, and I say this based on market data and the chart. Not my speculative opinion.
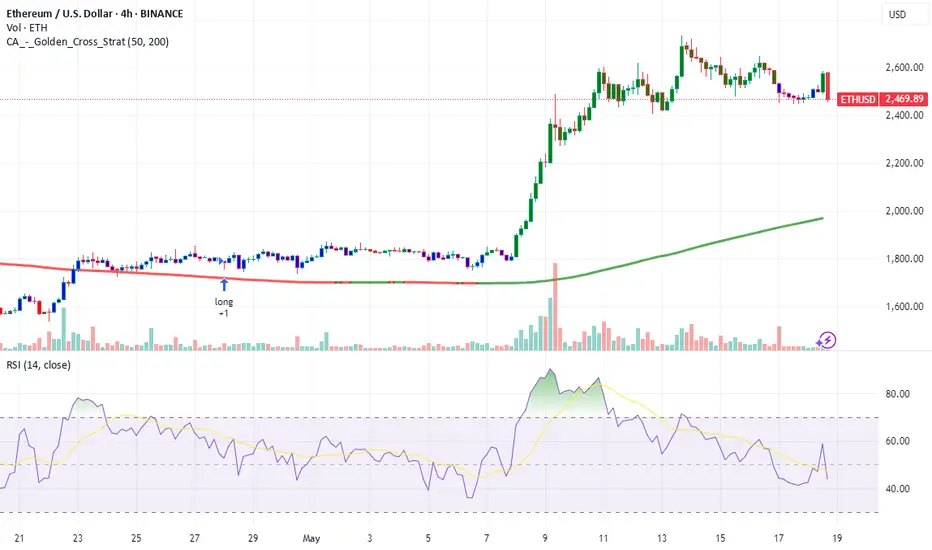
This is the biggest exchange in the list, it comes up first.
Exchanges are listed by volume when you look up a pair here on TradingView.
It turns out that trading volume is still low but prices are going up. This is what tells me that it is still early, wave 1. When the action gets going and bullish momentum grows, volume will reach its highest; wave 3. Then the action will continue and will go crazy but volume won't keep up; wave 5.
I say the minimum is $5,794 and this is an easy target. Can go higher, much higher but 5.8K is an easy bet.
Go LONG hold spot trade options do what it takes.
Buy the funds, the ETFs, the actual coins holding or staking it doesn't matter as long as you participate. Even with stablecoins through DYDX or whatever way you prefer. As long as you participate in this awesome market the market will reward you.
Thank you for reading.
Namaste.
ETHUSD.P trade ideas

ETH/USDT – Daily Chart Technical AnalysisDate: 18th May, 2025
Prepared by: Musarrat
Ethereum is currently undergoing a retracement phase after a strong bullish rally. A Fibonacci retracement tool has been applied from the recent low around $1,577 to the swing high of $2,742.75 to identify key levels of potential reversal.
Key Technical Levels:
Fibonacci Retracement Zones:
0.236: $2,572.75 (minor resistance)
0.382: $2,467.66
0.5: $2,382.99 (current price nearing this zone)
0.618: $2,298.71 (strong retracement zone)
0.786: $2,176.73
Buy Limit Order:
Entry Price: $2,415
Positioned between the 0.5 and 0.618 retracement levels—an optimal buy zone based on historical retracement behavior.
Stop Loss: $2,174
Placed just below the 0.786 retracement level to allow room for price fluctuation while protecting downside risk.
Take Profit Targets:
TP1: $2,732 – Near the previous swing high and a key resistance level.
TP2: $3,210 – A projected extension level, marking a strong bullish continuation if the uptrend resumes.
Indicator Analysis:
RSI (14): Currently at 61.05, indicating bullish momentum still holds, but approaching neutral territory. A bounce from current levels would confirm strength.
Conclusion:
The chart suggests a healthy retracement within an uptrend. A buy limit at $2,415 offers an opportunity to enter the market at value, targeting a rebound toward previous highs and beyond. The setup is supported by:
Retracement to golden ratio zones (0.5–0.618)
Strong RSI trend above 60
Clear stop-loss and reward levels offering favorable risk-to-reward ratio
Strategy:
Wait for price to trigger the Buy Limit at $2,415. If filled, monitor for price action confirmation and manage trade towards TP1 and TP2.

Is XRP About to Rebound? Bullish Signals EmergeXRP Flashes Bullish Signal: Technical Indicator Hints at Imminent Rebound – 100x Gains Coming? The Future Is Closer Than You Think—Analyst
The cryptocurrency market is a volatile and often unpredictable space, where fortunes can be made and lost in the blink of an eye. Among the myriad of digital assets vying for attention, XRP, the cryptocurrency associated with Ripple Labs, has consistently been a topic of intense debate and speculation. While it has faced its fair share of challenges, including regulatory scrutiny and market fluctuations, XRP continues to hold the interest of investors and analysts alike.
Recently, XRP has been displaying what some experts are interpreting as bullish signals, suggesting a potential rebound in its price. These signals are primarily derived from technical analysis, a method of evaluating assets by analyzing statistical trends gathered from trading activity, such as price movement and volume. One particular technical indicator is hinting at an imminent upswing, leading some analysts to predict significant gains for XRP in the near future.
This article delves into the technical indicators flashing bullish signals for XRP, examines the factors that could contribute to a potential rebound, and explores the possibility of a 100x gain, a prospect that has captured the imagination of many XRP enthusiasts.
Technical Indicators Pointing Towards a Rebound
Technical analysis plays a crucial role in understanding potential price movements in the cryptocurrency market. Several indicators are currently suggesting a bullish outlook for XRP:
1. Moving Averages: Moving averages are commonly used to smooth out price data over a specific period, helping to identify trends. When a shorter-term moving average crosses above a longer-term moving average, it is often seen as a bullish signal, indicating that the price is likely to rise. XRP has recently exhibited this "golden cross" pattern on certain timeframes, suggesting a potential upward trend.
2. Relative Strength Index (RSI): The RSI is a momentum indicator that measures the magnitude of recent price changes to evaluate overbought or oversold conditions in the price of an asset. An RSI value below 30 typically indicates that an asset is oversold and may be due for a rebound. XRP's RSI has been hovering in oversold territory, suggesting that buying pressure could soon increase.
3. Fibonacci Retracement Levels: Fibonacci retracement levels are horizontal lines that indicate potential support and resistance levels based on the Fibonacci sequence. These levels are often used to predict where the price of an asset might find support during a downtrend or resistance during an uptrend. XRP has been testing key Fibonacci retracement levels, and a successful breakout above these levels could signal a significant price increase.
4. Chart Patterns: Technical analysts also look for specific chart patterns that can provide clues about future price movements. Some patterns, such as the "inverse head and shoulders" or the "double bottom," are considered bullish formations, suggesting that the price is likely to rise. XRP has been forming patterns that resemble these bullish formations, further supporting the possibility of a rebound.
Factors Contributing to a Potential XRP Rebound
While technical indicators can provide valuable insights, it is essential to consider the fundamental factors that could influence XRP's price. Several factors could contribute to a potential rebound:
1. Ripple's Ongoing Legal Battle with the SEC: The most significant factor weighing on XRP's price has been Ripple's legal battle with the U.S. Securities and Exchange Commission (SEC). The SEC alleges that Ripple sold XRP as an unregistered security, a claim that Ripple vehemently denies. A favorable outcome in this case could significantly boost XRP's price, as it would remove a major source of uncertainty and regulatory risk.
2. Growing Adoption of XRP for Cross-Border Payments: Ripple has been actively promoting XRP as a solution for cross-border payments, touting its speed, efficiency, and low cost compared to traditional methods. Increased adoption of XRP by financial institutions and payment providers could drive demand for the cryptocurrency, leading to a price increase.
3. Expansion of Ripple's Ecosystem: Ripple has been expanding its ecosystem by developing new products and services that utilize XRP. These include RippleNet, a network of financial institutions that use Ripple's technology for cross-border payments, and On-Demand Liquidity (ODL), a service that allows businesses to use XRP to source liquidity for cross-border transactions. A thriving ecosystem could attract more users and investors to XRP, further supporting its price.
4. Overall Cryptocurrency Market Sentiment: XRP's price is also influenced by the overall sentiment in the cryptocurrency market. A positive market sentiment, characterized by rising prices and increased investor confidence, could lift XRP along with other cryptocurrencies. Conversely, a negative market sentiment could put downward pressure on XRP's price.
The Possibility of a 100x Gain: A Realistic Scenario?
The prospect of a 100x gain in XRP's price has captured the imagination of many investors. While such a gain is certainly possible, it is essential to approach this scenario with a healthy dose of skepticism and realism.
To achieve a 100x gain, XRP's price would need to increase by a factor of 100 from its current level. This would require a massive influx of capital into XRP, driven by a combination of factors, such as a favorable outcome in the SEC case, widespread adoption of XRP for cross-border payments, and a significant increase in overall cryptocurrency market capitalization.
While these factors are not entirely out of the realm of possibility, they are by no means guaranteed. The cryptocurrency market is inherently unpredictable, and unforeseen events could derail any potential rally in XRP's price.
Analyst Perspective: The Future Is Closer Than You Think
Despite the inherent risks and uncertainties, some analysts remain optimistic about XRP's future. These analysts point to the potential for XRP to disrupt the traditional cross-border payments industry, the growing adoption of Ripple's technology, and the possibility of a favorable outcome in the SEC case as reasons for their bullish outlook.
One analyst, in particular, has stated that "the future is closer than you think" for XRP, suggesting that significant gains could be realized in the near future. This analyst believes that XRP is currently undervalued and that its price could surge once the regulatory uncertainty surrounding Ripple is resolved.
Conclusion: Navigating the XRP Landscape
XRP presents a complex and often contradictory picture. Technical indicators are flashing bullish signals, suggesting a potential rebound in its price. Factors such as Ripple's ongoing legal battle with the SEC, growing adoption of XRP for cross-border payments, and the overall cryptocurrency market sentiment could all play a role in determining XRP's future.
While the possibility of a 100x gain is enticing, it is essential to approach this scenario with caution and realism. The cryptocurrency market is inherently volatile, and unforeseen events could impact XRP's price.
Ultimately, whether XRP achieves its full potential remains to be seen. However, the recent bullish signals and the ongoing developments surrounding Ripple suggest that the future of XRP is closer than many might think. As always, investors should conduct their own research, assess their risk tolerance, and make informed decisions before investing in any cryptocurrency, including XRP.
ETH/USD a bullish move based on the recent breakout Awais Ali:
Chart Analysis Overview:
Market Structure:
The overall market appears to have formed a support zone at the lower end and a resistance zone at the upper range.
A prior bullish move led to a Fair Value Gap (FVG), highlighted as an area of potential institutional interest.
Fair Value Gap (FVG):
The FVG is marked as an imbalance area where price moved impulsively, suggesting unfilled orders. Traders might anticipate a return to this zone before resuming a trend…
Awais Ali: It aims to capture a high-probability reversal
Awais Ali: This is a technical analysis chart for Ethereum (ETH) against the US Dollar (USD) on the 2-hour timeframe, shown on TradingView. Here's a detailed breakdown of the elements annotated in the chart:
---
Chart Elements:
1. Price Action Trend:
The chart shows a previous descending price trend, followed by a rising channel, and then a sideways consolidation period (highlighted as "SIDEWAYS").
After the sideways movement, there is a breakout upwards, indicating a bullish momentum shift.
2. Support Zone:
A clear support zone is drawn around the $1,800 area. This is where the price consolidated before making a significant move upward.
3. CHoCH (Change of Character):
The chart marks a CHoCH, which signifies a change in market structure—typically indicating a potential reversal or start of a new trend.
4. OBB (Order Block Break):
This area represents a bearish order block that price revisited and respected before pulling back.
5. Trade Setup (Entry/Target):
Entry Zone: Around the $2,494 mark (current price level).
Stop-loss Zone: Below the entry zone, suggesting risk management.
Target Zone: Around $2,850, indicating a potential bullish target.
The trade setup suggests a long (buy) position with a favorable risk-to-reward ratio.
6. Overall Outlook:
The trader anticipates a bullish move based on the recent breakout, change of character, and retest of a key zone.
---
Conclusion:
This chart represents a bullish outlook on ETH/USD, based on structure shifts, support/resistance zones, and a potential breakout continuation pattern. The trade idea involves buying near current levels with a target significantly higher and a stop-loss just below the recent structure.

ETHUSD: Strong Growth Ahead! Long!
My dear friends,
Today we will analyse ETHUSD together☺️
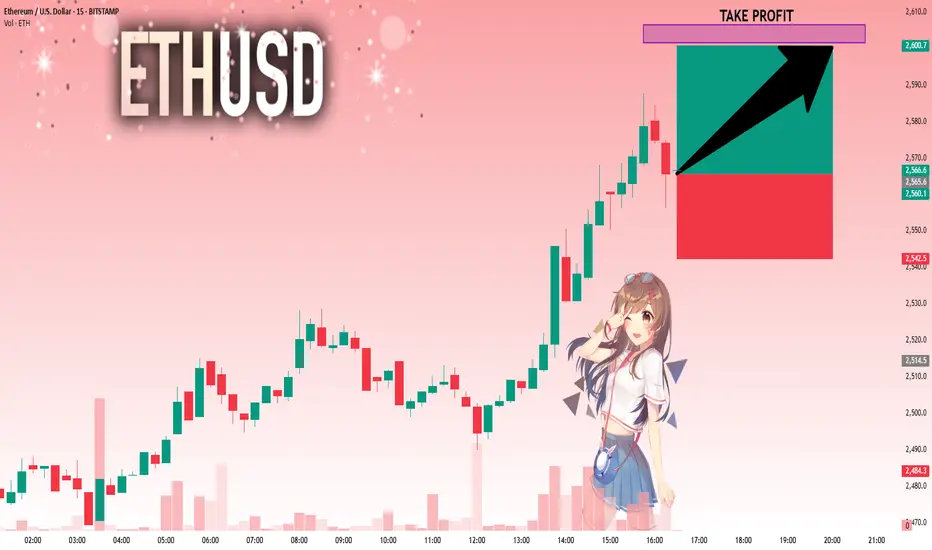
The price is near a wide key level
and the pair is approaching a significant decision level of 2,566.3 Therefore, a strong bullish reaction here could determine the next move up.We will watch for a confirmation candle, and then target the next key level of 2,601.4.Recommend Stop-loss is beyond the current level.
❤️Sending you lots of Love and Hugs❤️
ethusdtethusdt
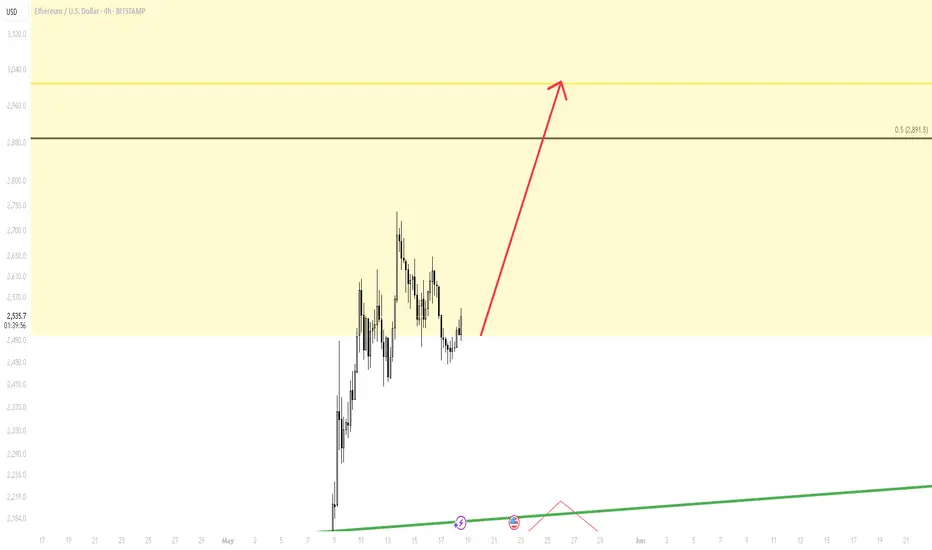
its matched and ready to move
I guess
its just an idea please dont take it serious better be careful at yellow "ifitgoes"

Speculative trade - ETHUSD300+ is the profit target for this pair. Risk reward ratio is 1:4.15 if it works out !
As this is much more volatile, it is good that you have a wider SL else you be disappointed to be out of the game too fast!
Best of luck and DYODD

Day 7- The £20 to £1million in 1 year update.Follow this Epic adventure as I turn £20 into £1million aiming to complete within 1 year. Day 7 update as I go through change of risk approach, strategy update and next stages with the updates!
Stick around, follow me on tradingview and on youtube! Keep on trading!

Ethereum Chart Signals 3:1 Risk-to-Reward Trade SetupEthereum has already experienced a minor pullback to the 0.236 Fibonacci level at $2,500. If Bitcoin breaks above its all-time high, this could mark a potential bottom for Ethereum. Consider waiting for a breakout to confirm the setup. This trade offers a 3:1 risk-to-reward ratio.
Entry 2636
Stop loss 2439
Target 3300
3 R:R
This is only for educational purpose only

ETHUSD Long Setup – Breakout Confirmation 📈 After a strong consolidation around the $2,445 demand zone, price has broken out of the descending trendline with a bullish impulse candle, signaling potential for a strong move up. Entry was taken at the breakout with SL just below the zone and a juicy RR targeting $2,694.
🧠 Key Insights:
• Clean breakout above short-term descending trendline ✅
• Strong bullish engulfing candle on breakout 🚀
• Support confirmed at demand zone around $2,445 💪
• RR ratio: 🔥 High-reward setup with minimal risk
🎯 Target: $2,694.05
📉 Stop: Below $2,445 zone
💹 Entry: $2,485.32
⚠️ Risk-Reward Ratio: Exceptional

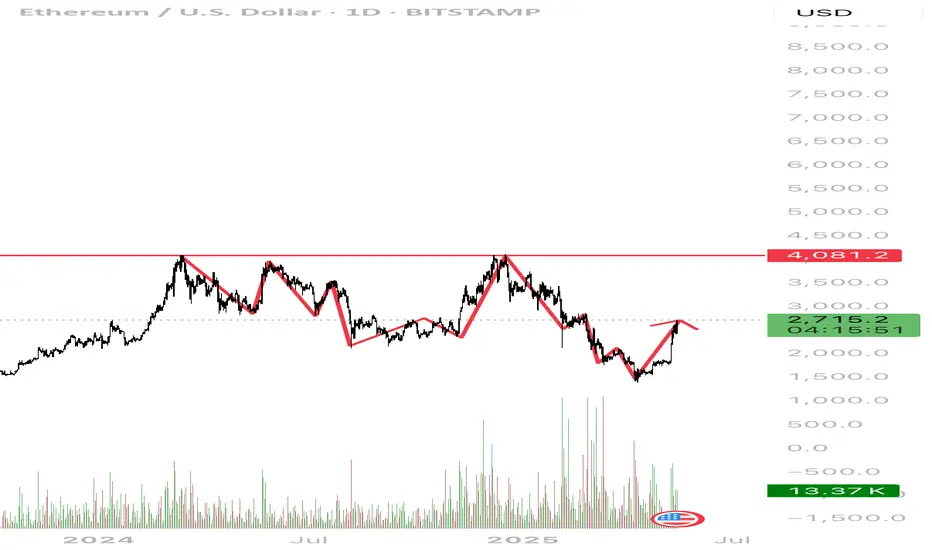
ETH is still Bearish Hello guys
As we can see on the daily chart of ETH/USD
We are still in a downtrend and we are approaching key resistance levels on 2750 and 3050 USD. I think that we must retest 2100-1900 levels to get enough volume to break the top of 4080-4100 and start a strong bullrun and we see the change of trend to bullish.
Let me know what you think and let’s share and discuss in the comments
Thank you 👌🏽💪🏽
ETH - Ethereum 2 Hours Chart turning to Uptrend? Opinions?ETH - Ethereum 2 Hours Chart turning to Uptrend? Opinions?
No positions, Not for financial advise!
Not for recommendations to buy sell any securities, stocks, crypto or FX.
DYOR

just for tracking i made those line a while ago and the market is following them... interesting how we just bounced off this resistance... do you think we will reach my last resistance to bounce back up?
eth is going up!eth is going up!
minor channel break out, lets see what happens
i took long position while waiting.
-grey

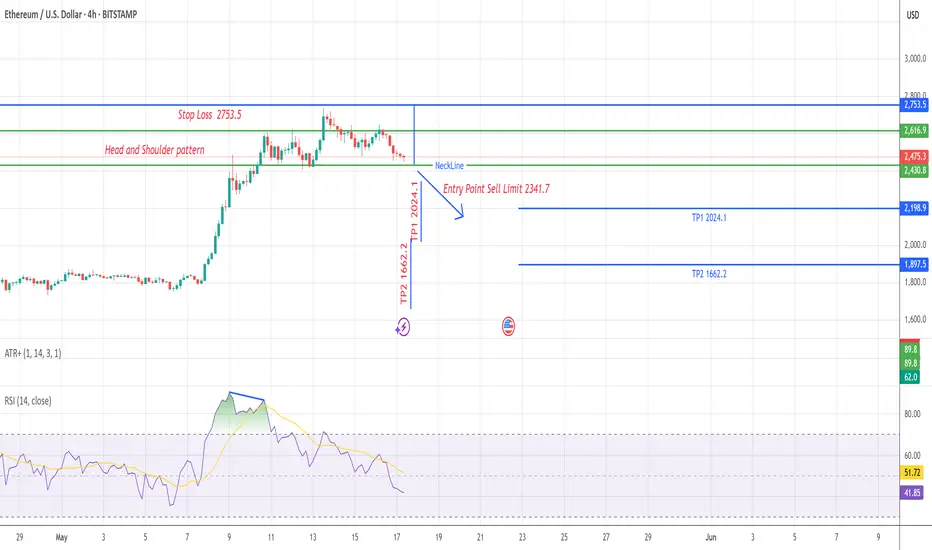
Etherium USD 4 Hour Head and Shoulder for Bearish Reversal Etherium USD 4 Hour Head and Shoulder for Bearish Reversal
Trade Plan to Short at the break of NeckLine
Continuation of the flat under the pressure of seasonal salesAnd so a difficult week is behind us, with overcoming the middle of the quarter. Against the background of positive factors, the week and the second half of the quarter opened above 2500, which provides market support and reduces the potential for decline. However, we have only come to a temporary consolidation of the market and it is too early to talk about a trend change to bullish. The final consolidation of the direction will take place in June. So far, the market has switched to seasonal sales from the 11th, as I warned about, and the bulls' task is to compensate for them. Technically, there is still a lot of potential for retest 2100-2150, which may happen in the coming week.
In an optimistic scenario, the new week will open above 2500. In this case, on Monday and Tuesday we will see insignificant sales again and the ether will not go below 2250 with a return to the hay in the second half of the week. In a more negative scenario, the week will open below 2500, in which case sales up to 2100-2150 are likely in the first half of the week, but with further purchases to 2500 due to the opening of the second half of the quarter above the level.
Today and tomorrow, there is a possibility of a wave of purchases, but I do not recommend keeping large-cap coins in operation, since seasonal sales in a negative scenario may last from mid-May to August, which will lead to their steady decline. Small-cap coins may show more significant growth impulses during this period.
We are also approaching the next assignment of the monitoring tag and delisting, which will have an additional impact on altcoins. So far, fantokens are in a good position, which successfully compensate for the drawdown of the altcoin index and are trying to grow, as they remain undervalued. I think they will remain interesting for speculators in the near future due to the drawdown of the rest of the altcoin market. ATM and city look the most interesting so far, which can continue to grow from their current positions, due to the lack of futures with active sales and the most oversold position. Under an optimistic scenario today and tomorrow, growth waves similar to acm are likely for them. Acm also has a high growth potential, but it may take time to accumulate with a retest probability of 0.75-90 before a new wave of purchases. Second of all, I am considering the alpine juv porto lazio. There is a possibility that binance will continue to add futures to fantokens every week, which will give new growth impulses.
In addition to fantokens, fio chess pivx adx quick, which remain in an undervalued position, can show a new wave of growth. I will be looking at them closer to the middle of the week.
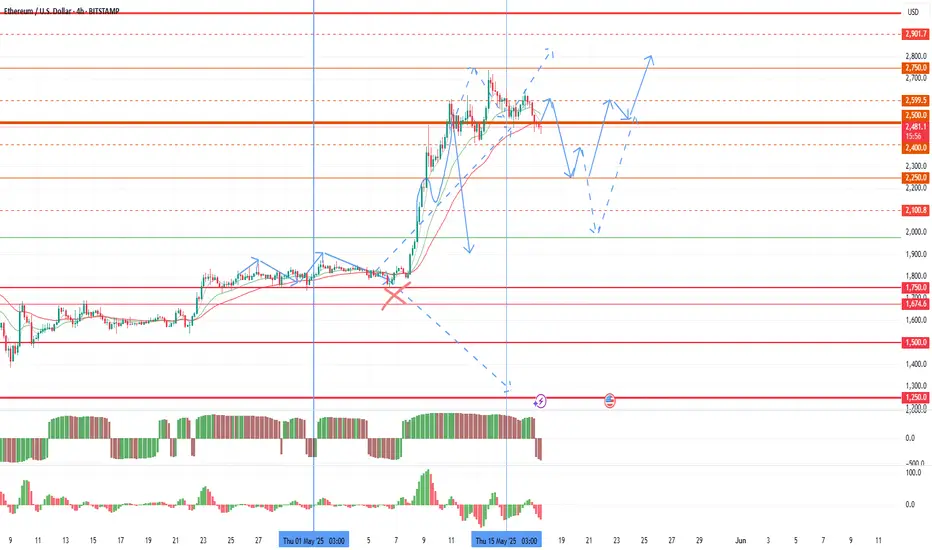
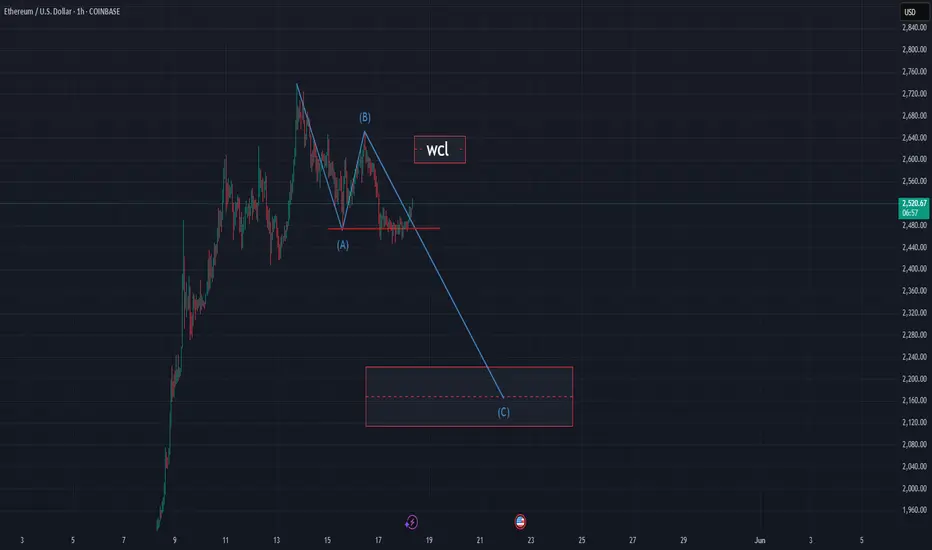
ETHUSD Long: Start of Wave 3 UpAs I explained the wave counts for Ethereum, I believe that we have seen the end of a wave 2 correction and the next wave should be a wave 3 up.
I presented the breakdown of the down move using both Elliott Waves and Fibonacci extension.
As mentioned, the stop loss should be below wave C low or if you can stomach more risk, below the low of previous wave 4. The price target is >$3800.
Good luck!

Eth has formed Head n Shoulder PatternEth has formed a Head and Shoulders Pattern, we can expect a fall up to 2100.

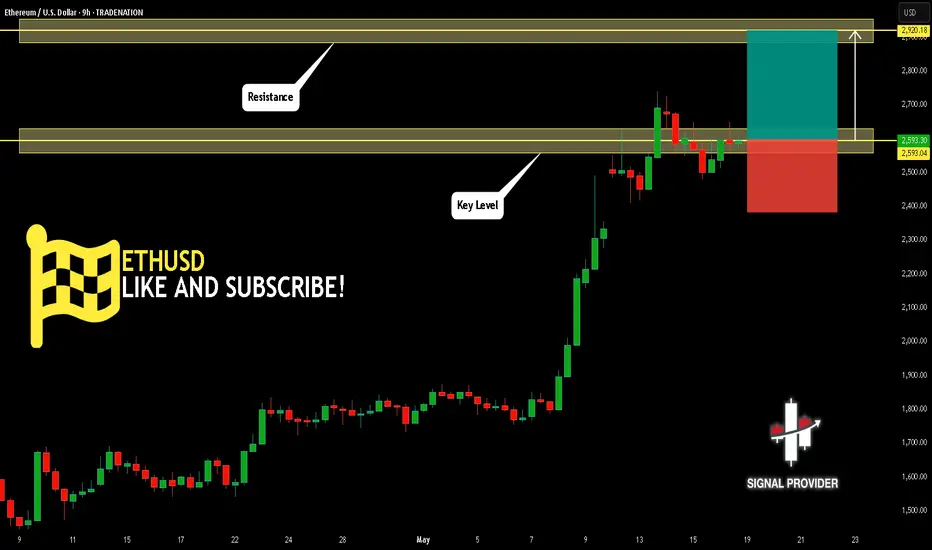
ETHUSD Is Bullish! Long!
Here is our detailed technical review for ETHUSD.
Time Frame: 9h
Current Trend: Bullish
Sentiment: Oversold (based on 7-period RSI)
Forecast: Bullish
The market is approaching a significant support area 2,593.04.
The underlined horizontal cluster clearly indicates a highly probable bullish movement with target 2,920.18 level.
P.S
The term oversold refers to a condition where an asset has traded lower in price and has the potential for a price bounce.
Overbought refers to market scenarios where the instrument is traded considerably higher than its fair value. Overvaluation is caused by market sentiments when there is positive news.
Disclosure: I am part of Trade Nation's Influencer program and receive a monthly fee for using their TradingView charts in my analysis.
Like and subscribe and comment my ideas if you enjoy them!
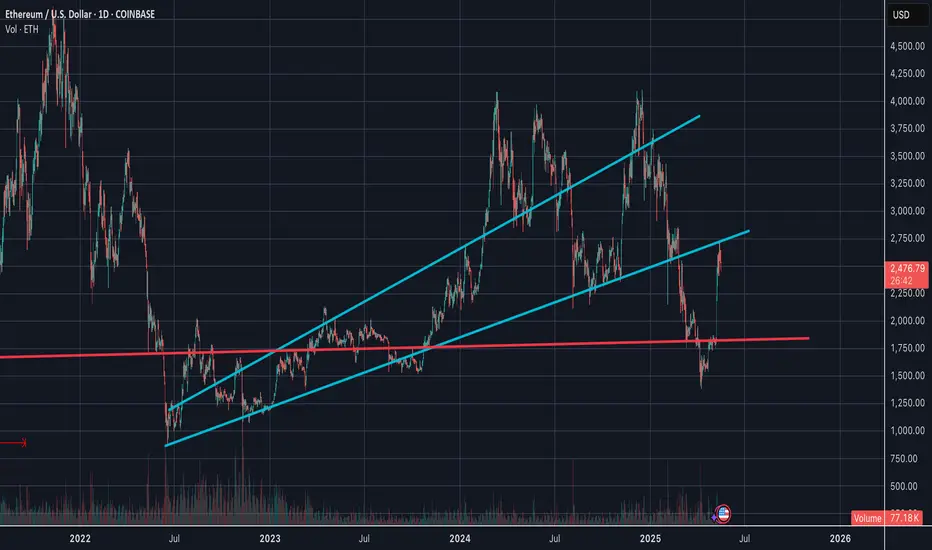
ETHUSD - Support Line Reestablished A major support line has been recovered on this ETH daily chart
One that previously led to a strong breakout
From here price will find support on this line and then pop off again
Good time to buy ETHUSD
Daily chart