ETH is moving within the 2,300.00 - 2,695.00 range👀 Possible scenario:
Ethereum (ETH) slipped 2.1% to just over $2,500 but remains up 30% for the week. Most holders are in profit, with key wallet cohorts having lower realized prices. Whale activity is being closely watched, as large sell-offs in the past triggered major drops.
Meanwhile, Starknet, an Ethereum layer-2, reached "Stage 1" decentralization — a key milestone toward full autonomy. It now leads ZK-rollups with $629M TVL, though it still trails far behind Base’s $14.7B and 33% market share.
✅ Support and Resistance Levels
Support level is now located at 2,300.00.
Now, the resistance level is located at 2,695.00.
ETHUSD.P trade ideas

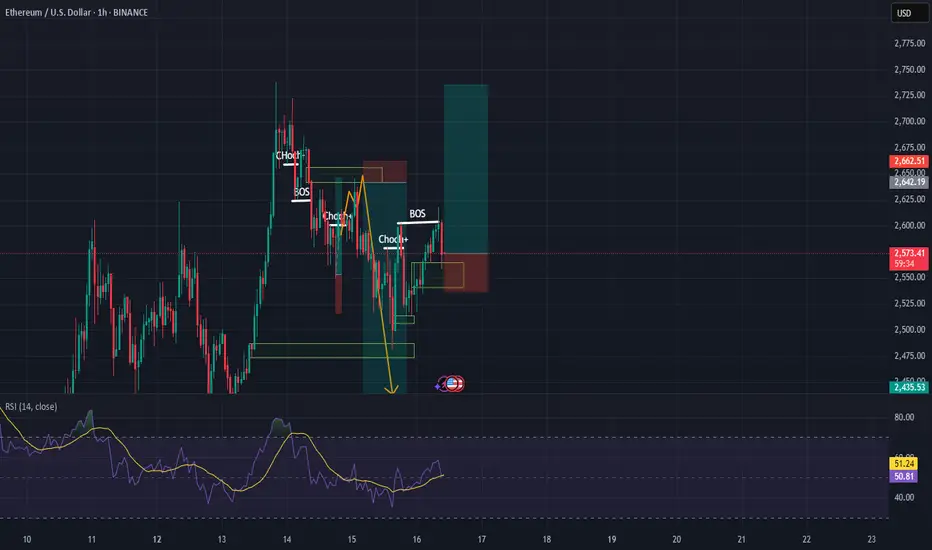
ETH - Ethereum 15 Min Chart Opinions?ETH - Ethereum 15 Min Chart Opinions?
Not for financial advise
Not recommendations to buy sell any securities, stocks, FX or cryptos.
Do your own research for your own entertainment!
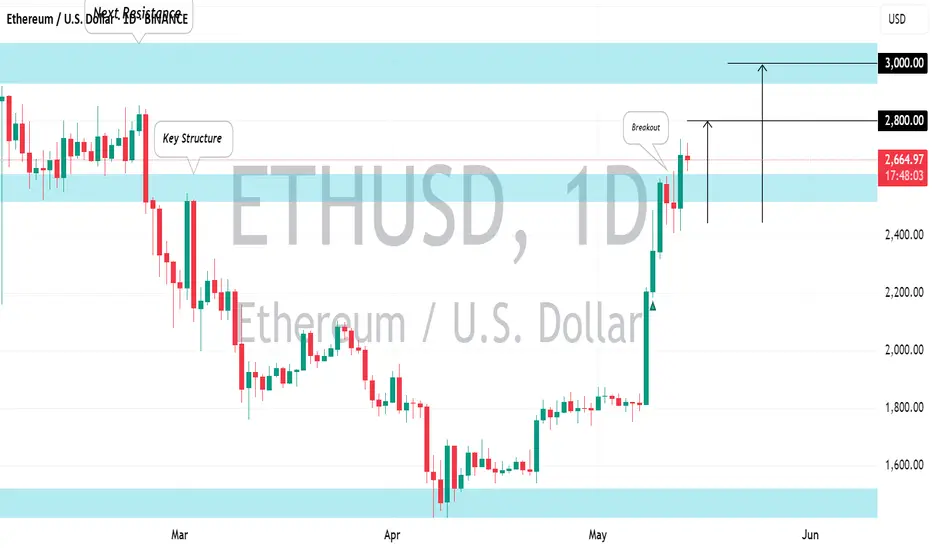
is ETH aiming for higher price?is ETH aiming for higher price? looking from market structure of ETH, ETH is now ready for another massive move on the higher price. Is this a indication of bulls coming back at the market? ETH should pass 2600 area if ETH like to target 2800 or even 3000 area

next wave is approaching for EthereumStochastic RSI has reset on different tf's. Bullish div on 4H btw

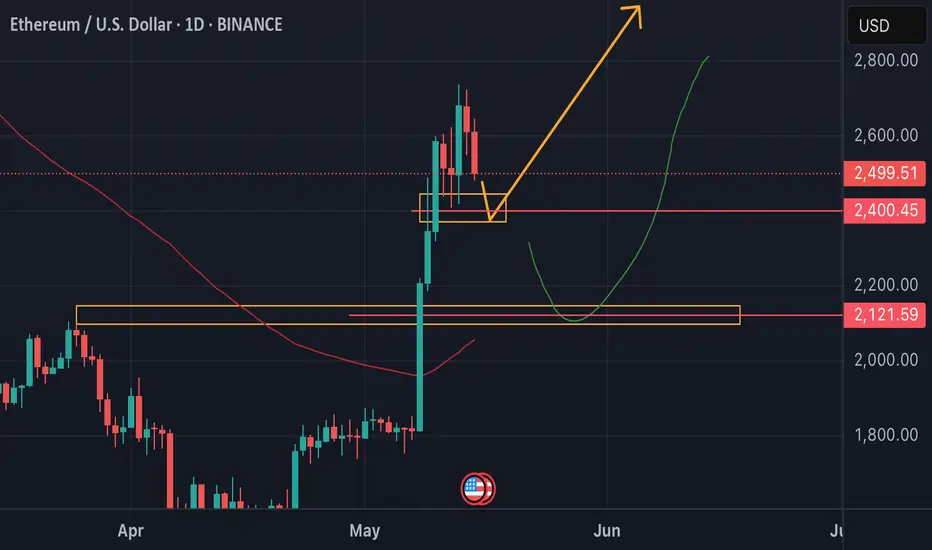
ETH ANALYSE We have two key levels to watch on ETH:
- Either the price reacts upwards on the $2401 level in H4,
- Or it falls further and reacts at the $2,121 Daily level.
Either way, the fall should not last too long.
EthereumETHUSD
- Fair Value Gap
- Bearish Channel as an corrective pattern in Short Time Frame
- Completed " 12345 " Impulsive Waves
- Break of Structure
- Change of Characteristcis

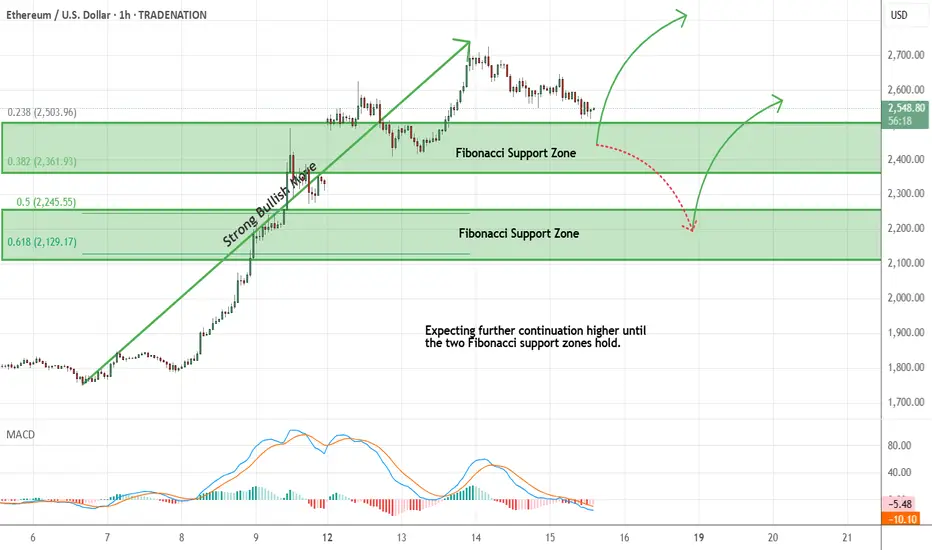
Ethereum - Short Term Buy IdeaH1 - Strong bullish move.
No opposite signs.
Currently it looks like a pullback is happening.
Expecting further continuation higher until the two Fibonacci support zones hold.
If you enjoy this idea, don’t forget to LIKE 👍, FOLLOW ✅, SHARE 🙌, and COMMENT ✍! Drop your thoughts and charts below to keep the discussion going. Your support helps keep this content free and reach more people! 🚀
--------------------------------------------------------------------------------------------------------------------
Disclosure: I am part of Trade Nation's Influencer program and receive a monthly fee for using their TradingView charts in my analysis.
Etherium..... Resisting at 50 % Fib RT.Though in an upward mood, the 50 % Fib RT seems a tuff nut to crack.
Expecting it to hold the 38.2 % Fib RT level of 2424, where the 200 DEMA too holds.
Lets see. Woukd love to add more at 2424 levels, with a strict SL if it daily closes below 2400.
Lots to learn from the markets.....

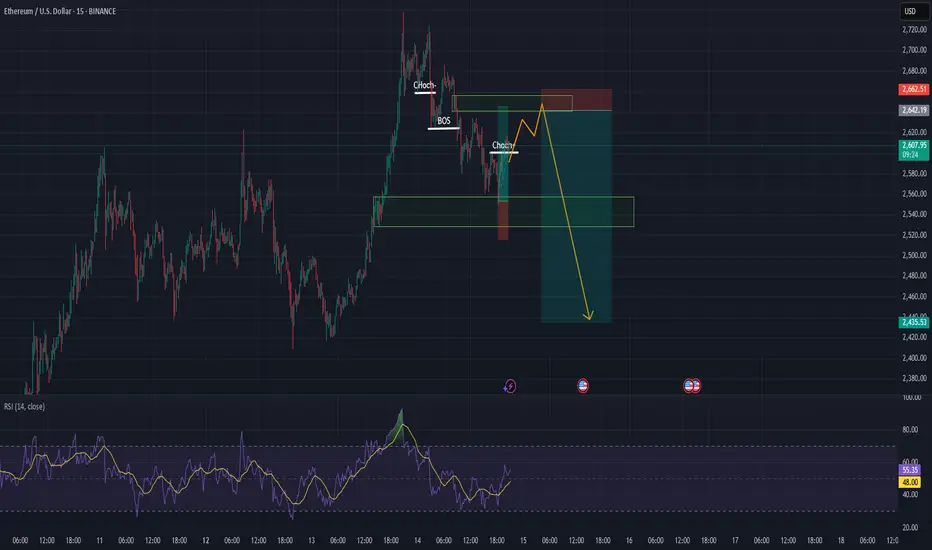
ETHUSD: First red day, day 2 on the backsideHello traders and welcome back on my profile, here is Gianni, and I hope you can enjoy this detailed analysis on ETHUSD.
As always, I don't use technical analysis for market prediction, because predicting is 50/50, but I use it to calculate my risk reward in case I would position myself in the market.
My general thesis for the day is pretty short, and following, the logic behind this thesis.
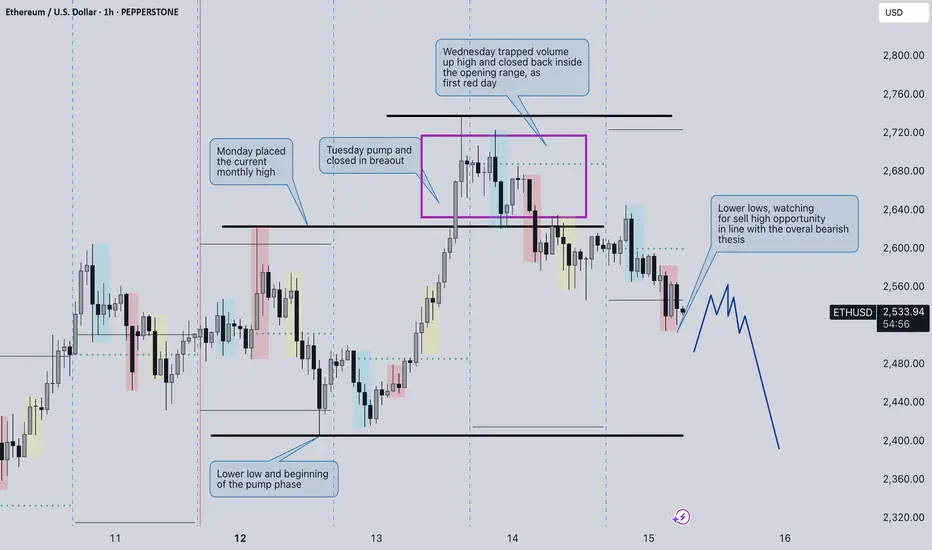
Monday, opening range of the week, established the current monthly high, breaking into the low of Friday (lower low) at the end of the day. Other time frames/big players might be in play and potentially the week can setup for a pump and dump.
Tuesday performed a strong pumping day, breaking through the Monday high and expanding the range higher, closing as well in breakout long.
Wednesday the market pretty much consolidated for the whole day, coming back inside the opening range high, and closing as first red day.
First red day is only a bearish signal, it doesn't mean that the market will drop certainly, but it gives you a signal the potentially long might be trapped in the wrong direction, increasing the chances of reversal, the day later or few more days later.
Today, Thursday, the market kept breaking lower, and it looks like coiling into the yesterday low of day, definitely a sign of weakness which I will keep in consideration.
8:30am and 8:40am NYT major red news are on schedule, I would not touch this market before that time, avoiding any possibility to be stuck in the trade.
How would I take this trade?
Simply I will be looking for any sell high opportunity after the news, reinforced with bearish price action, as triple tops, double tops and any kind of reversal patterns into the most recent high in place.
What about a long view?
Actually I'm not interested today, it can go higher, it can retest the weekly high, it can consolidate, it can do EVERYTHING, I don't care, my only focus is aligning my bearish thesis with a bearish setup.
I won't take in consideration any long opportunity for the day.
Overall, the market strongly pumped up during the previous week, I do not expect any crazy move, I do not think that this market trapped volume enough for a huge bearish collapse.
The potential opportunity of today, if presented, will be targeting the current weekly low (Monday low).
Stay tuned for further update during the NY session
Pectra Breakout to Unleash a New All-Time High? Ethereum’s Breakout Moment – Pectra to Unleash a New All-Time High?
Post with Emojis:
💎🚀 Ethereum’s Breakout Moment – Pectra to Unleash a New All-Time High? 🚀💎
Hey Traders!
Ethereum is standing at the gates of its next legendary move! With price holding strong above $2,531 and the Pectra upgrade just around the corner, all the stars are aligning for what could become one of the biggest rallies since The Merge. Are you ready for the breakout of the year?
📊 Key Levels to Watch:
📍 Support: $2,531 – Bulls holding the line perfectly.
🚀 Breakout Levels: $2,805 – $2,848 – The historic ‘Clashing Rocks’ resistance zone.
🎯 Immediate Targets: $3,200 – $3,500 🚀
🏆 Ultra Bullish Target: $4,000+ All-Time High Breakout Incoming!
📚 Why This Is NOT Just Another Pump:
🔧 Pectra Upgrade is a Game Changer:
💡 Smarter Wallets: No more annoying popups—seamless transactions!
⚡ Frictionless UX: Say goodbye to endless “approve + confirm” loops.
📉 Cheaper Transactions: Blobs scaling kicks in—lower fees, even in the craziest market conditions!
🌱 Staking Revolutionized: Bigger validator caps, faster deposits, smart contract withdrawals.
🔓 Unlocking $490B in Trapped Value: Capital flows freely—fueling the next bull run!
Ethereum is no longer just an asset—it’s transforming into the most efficient and user-friendly financial platform ever built.
💬 Question for You:
Are you already on board this rocket, or are you still watching from the sidelines? Which level will break first—$2,805 or $3,200?
Remember: When history and technology collide, markets explode. This is that moment.
One Love,
The FXPROFESSOR 💙
ps Trump bringing money from all over the place dominate news: for sure some ends up in Ethereum

ETH - Daily Chart ETH DAILY CHART LOOKS LIKE TURNING DOWN? OPINIONS?
Thanks
Not for financial advice
Not for recommendations to buy sel any Stocks, crypto or FX.
DYOR

ETH - Ethereum Daily Chart No Positions
Not for financial advice
Not for recommendations to buy sel any securities, stocks, crypto or FX.
Just for fun charting hobby stuff
DYOR
ETH sub $1k coming soonCRYPTOCAP:ETH is rejecting resistance here. Unless we can flip it as support, then it looks like new lows are coming.
I think the most likely level to find support is at $753, however I marked off other levels that are important incase we find support there.
You'll want to bid these levels because they'll be the buy of the decade, should we get down there.
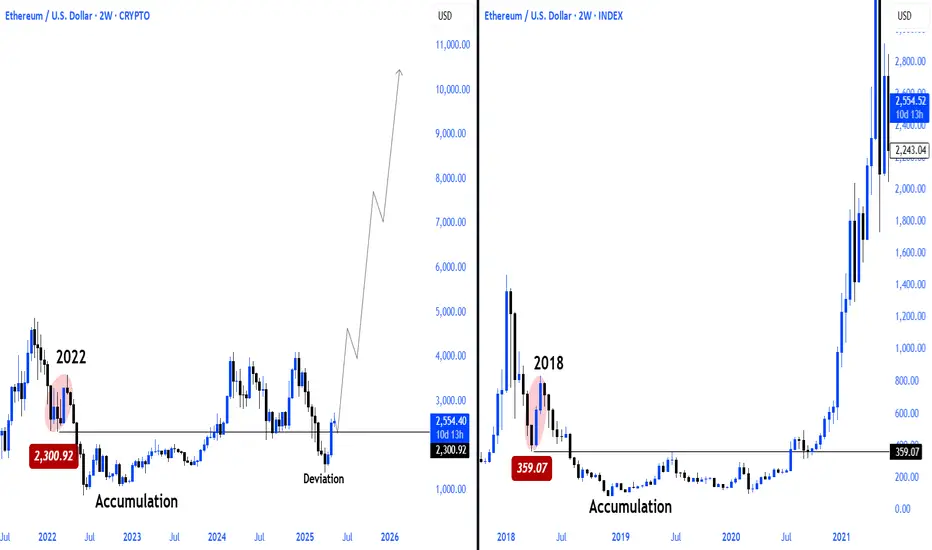
I'm calling for $10,000 per Ethereum.I think Ethereum could reach $10,000 or even $20,000 if we really go parabolic in wave 5.
We are potentially gearing up for the biggest crypto bull market in human history, and Ethereum should be a major player in this move.
As always, stay profitable.
– Dalin Anderson

ETH small short before new highETH small short before new high.
I believe the price will fall and resume rising very soon.
ETH short than longLooking at Ethereum right now, $2760 is showing solid resistance. I’ve taken a short position there, expecting a pullback as momentum fades.
If price drops significantly, I’ve got a buy order waiting at $1870 — a key level from previous structure and a potential bounce zone if the market overreacts.
No emotions, just levels. Manage your risk and let the trade come to you. 👇
Short: $2760
Buy Limit: $1870

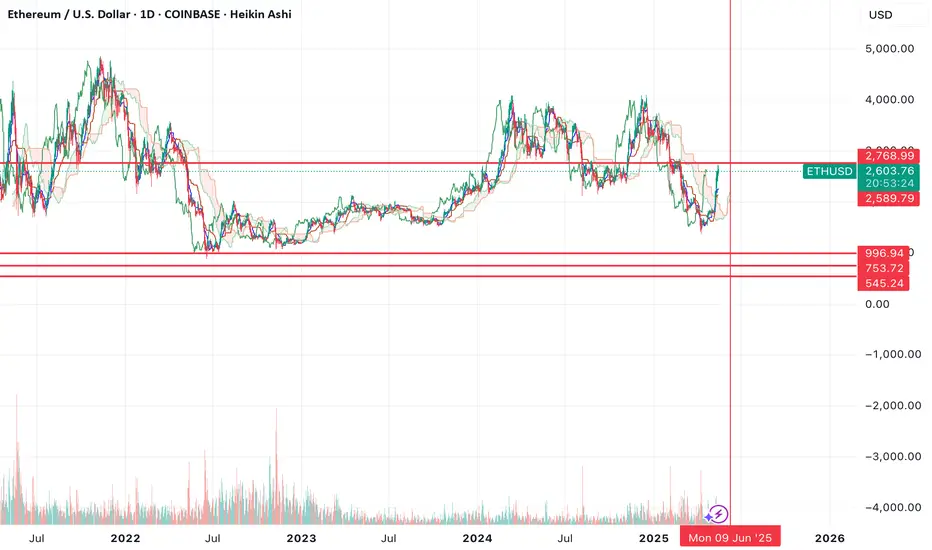
Ethereum - Bull run over Ethereum Weekly Chart Analysis (as of May 14, 2025)
1. Breakdown of M-Pattern:
Ethereum has clearly formed and broken down from a large M-pattern, indicating a bearish double-top structure.
This breakdown suggests weakness and the potential for a deeper correction if critical support levels fail.
2. Retest of Triangle Pattern:
After the breakdown, ETH has retested the lower boundary of a previously broken ascending triangle.
This retest aligns with the $2,746–$2,370 zone, which is now acting as a strong resistance cluster.
3. Current Price Zone – No Trading Zone:
Ethereum is currently trading around $2,587, right in a no-trading zone (highlighted in the chart box).
This zone represents indecision — neither a clear breakout nor breakdown — suggesting traders should wait for confirmation.
4. Bearish Scenario – Pin Zone Break:
A break below $2,370, the key horizontal support (also the neckline of the M-pattern), would likely confirm renewed bearish momentum.
If this level is decisively broken, expect a strong downward move.
5. Downside Targets:
First major support: $1,410 – previous swing low.
Final bearish target (highlighted in purple): $1,000–$1,004 — a psychological and historical support level.
6. Upside Scenario (less probable currently):
ETH would need to reclaim $2,746 and break back into the triangle to invalidate the bearish setup.
Only then could the long-term target of $5,391 be reconsidered.
Conclusion:
Ethereum is in a critical decision zone. While the macro pattern signals bearish continuation, confirmation will come on a break below $2,370. If that happens, a drop toward $1,000 is highly likely. Traders should remain cautious and avoid new positions until a decisive move occurs.

Midweek breakdown 14.5.2025Markets are shaping up for some nice moves across the board.
Implementing an abundance mindset is my main goal for this quarter

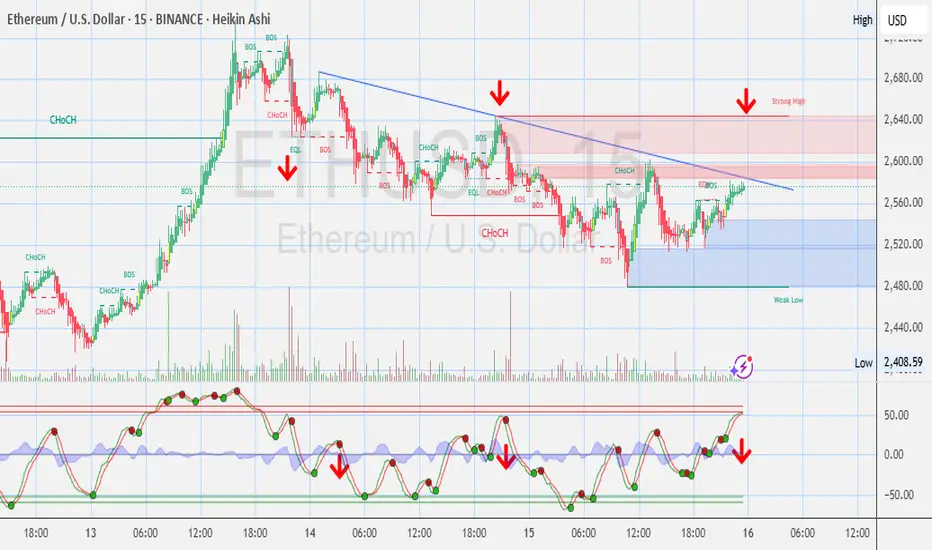
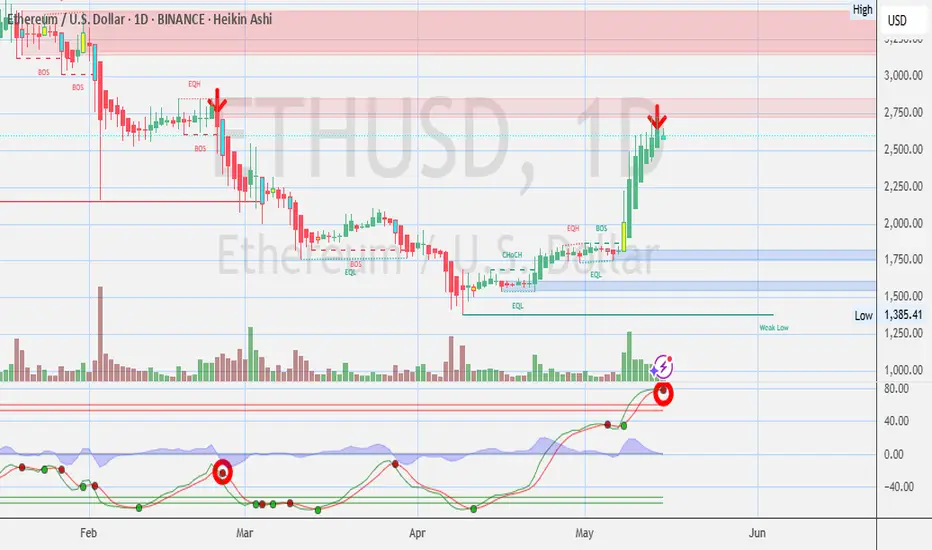
FXAN & Heikin Ashi Trade IdeaBINANCE:ETHUSD
In this video, I’ll be sharing my analysis of ETHUSD, using FXAN's proprietary algo indicators with my unique Heikin Ashi strategy. I’ll walk you through the reasoning behind my trade setup and highlight key areas where I’m anticipating potential opportunities.
I’m always happy to receive any feedback.
Like, share and comment! ❤️
Thank you for watching my videos! 🙏

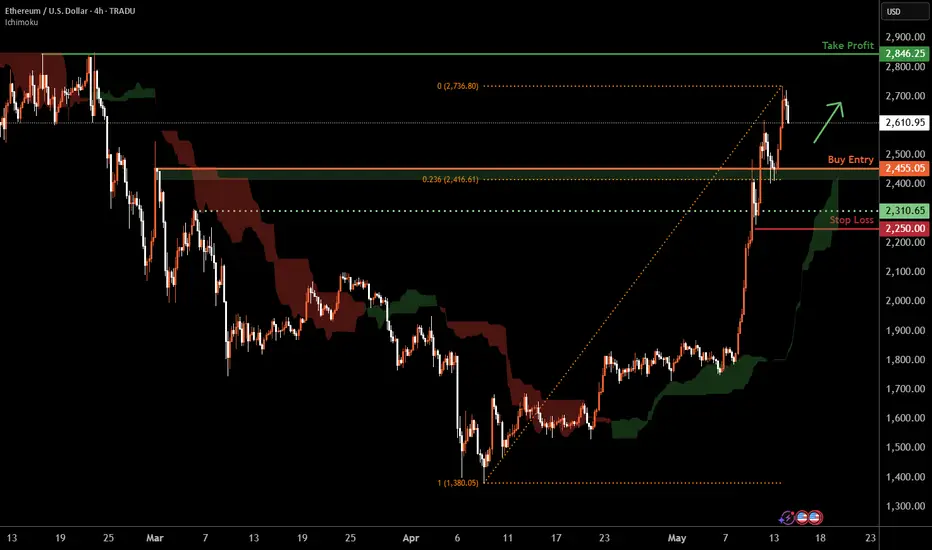
Ethereum H4 | Overlap support at 23.6% Fibonacci retracementEthereum (ETH/USD) is falling towards an overlap support and could potentially bounce off this level to climb higher.
Buy entry is at 2,455.05 which is an overlap support that aligns close to the 23.6% Fibonacci retracement.
Stop loss is at 2,250.00 which is a level that lies underneath an overlap support.
Take profit is at 2,846.25 which is a multi-swing-high resistance.
High Risk Investment Warning
Trading Forex/CFDs on margin carries a high level of risk and may not be suitable for all investors. Leverage can work against you.
Stratos Markets Limited (tradu.com):
CFDs are complex instruments and come with a high risk of losing money rapidly due to leverage. 63% of retail investor accounts lose money when trading CFDs with this provider. You should consider whether you understand how CFDs work and whether you can afford to take the high risk of losing your money.
Stratos Europe Ltd (tradu.com):
CFDs are complex instruments and come with a high risk of losing money rapidly due to leverage. 63% of retail investor accounts lose money when trading CFDs with this provider. You should consider whether you understand how CFDs work and whether you can afford to take the high risk of losing your money.
Stratos Global LLC (tradu.com):
Losses can exceed deposits.
Please be advised that the information presented on TradingView is provided to Tradu (‘Company’, ‘we’) by a third-party provider (‘TFA Global Pte Ltd’). Please be reminded that you are solely responsible for the trading decisions on your account. There is a very high degree of risk involved in trading. Any information and/or content is intended entirely for research, educational and informational purposes only and does not constitute investment or consultation advice or investment strategy. The information is not tailored to the investment needs of any specific person and therefore does not involve a consideration of any of the investment objectives, financial situation or needs of any viewer that may receive it. Kindly also note that past performance is not a reliable indicator of future results. Actual results may differ materially from those anticipated in forward-looking or past performance statements. We assume no liability as to the accuracy or completeness of any of the information and/or content provided herein and the Company cannot be held responsible for any omission, mistake nor for any loss or damage including without limitation to any loss of profit which may arise from reliance on any information supplied by TFA Global Pte Ltd.
The speaker(s) is neither an employee, agent nor representative of Tradu and is therefore acting independently. The opinions given are their own, constitute general market commentary, and do not constitute the opinion or advice of Tradu or any form of personal or investment advice. Tradu neither endorses nor guarantees offerings of third-party speakers, nor is Tradu responsible for the content, veracity or opinions of third-party speakers, presenters or participants.
ETHEREUM (ETHUSD): Retest of $3000 Soon!Ethereum has successfully violated and closed above a significant daily horizontal resistance level.
The bullish momentum appears to be ongoing, and the price is likely to soon test the psychological level of $3000 mark.
Following this test, a breakout is expected, potentially driving prices to new heights.