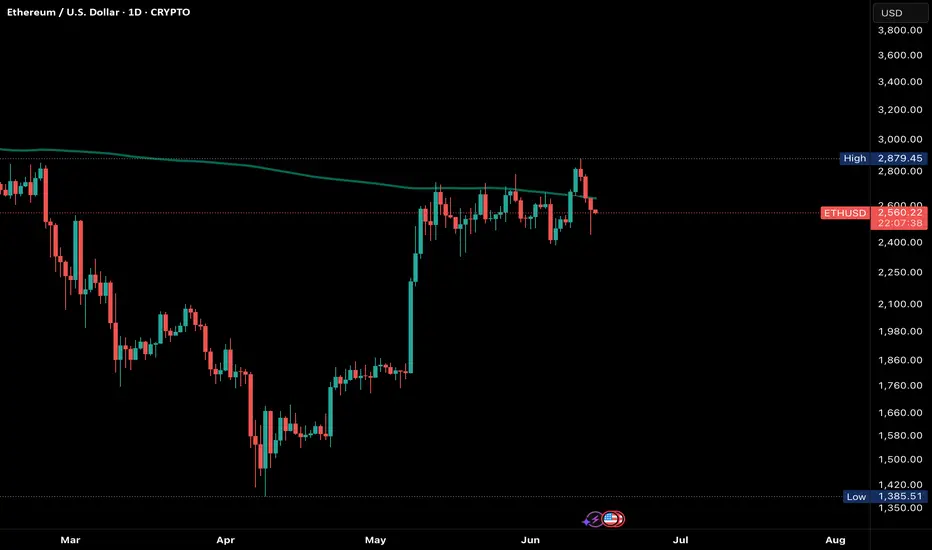
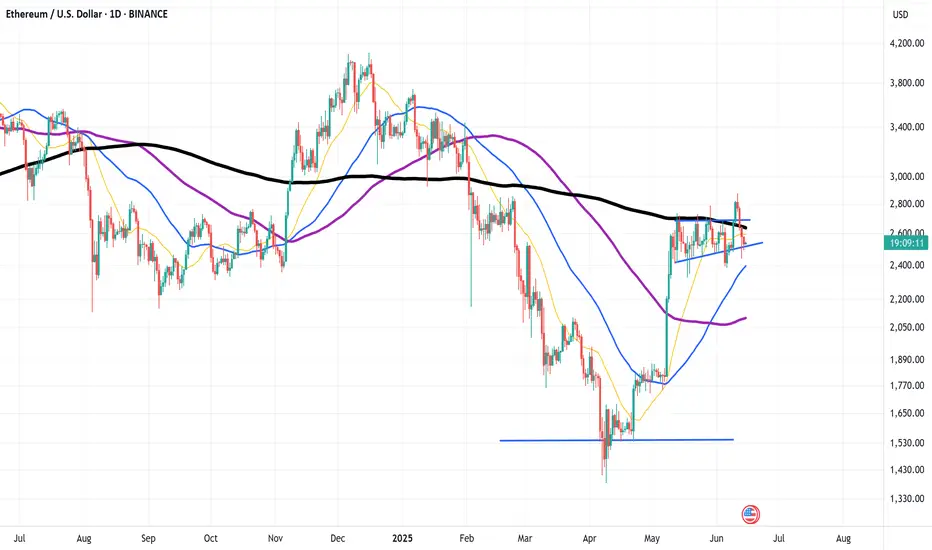
ETH rejecting Daily 200 MA ETH pushed and closed above the daily 200 MA however, it’s most recent closed BELOW. Bullish above, bearish below!
ETHUSD.P trade ideas
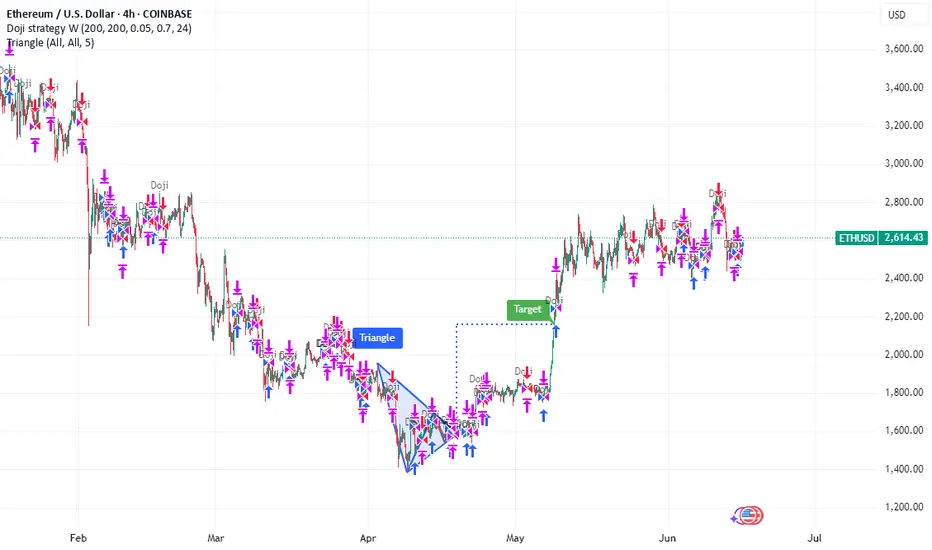
ETH correction set ups big buyAmongst the geopolitical tensions and market uncertainty has ETH just had its big correction before a massive rise in the price?
The 4 hour candle suggests that in the coming days to month it will reach a point at which we will break the trend line in either a bullish reconfimration or a switch to bearish intentions.
I suspect that we will se big price action in the next few days
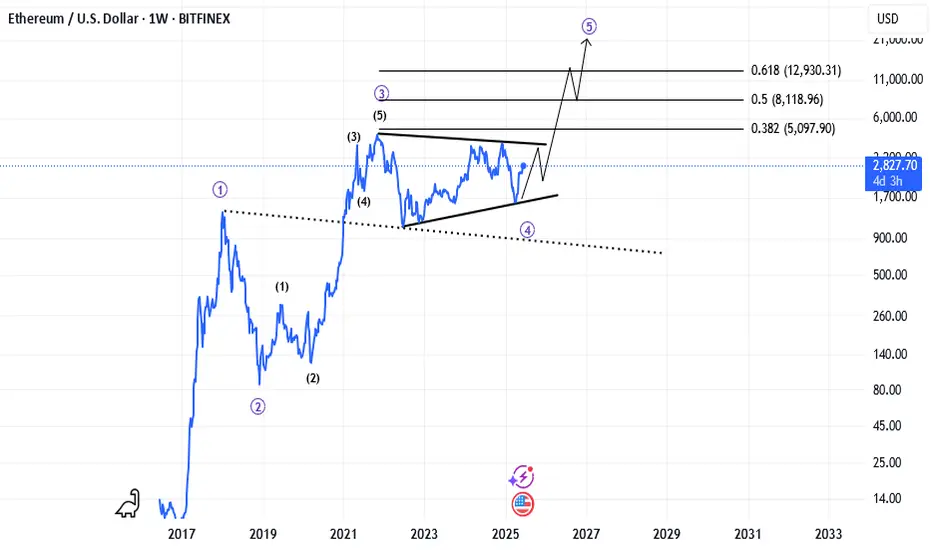
ETH is riding to meet WAVE 5 !hello traders
as you can see wave 4 is formed as an triangle .
we can consider it as an ABC too!
we can expect a niiiice wave 5 as an impulsive wave
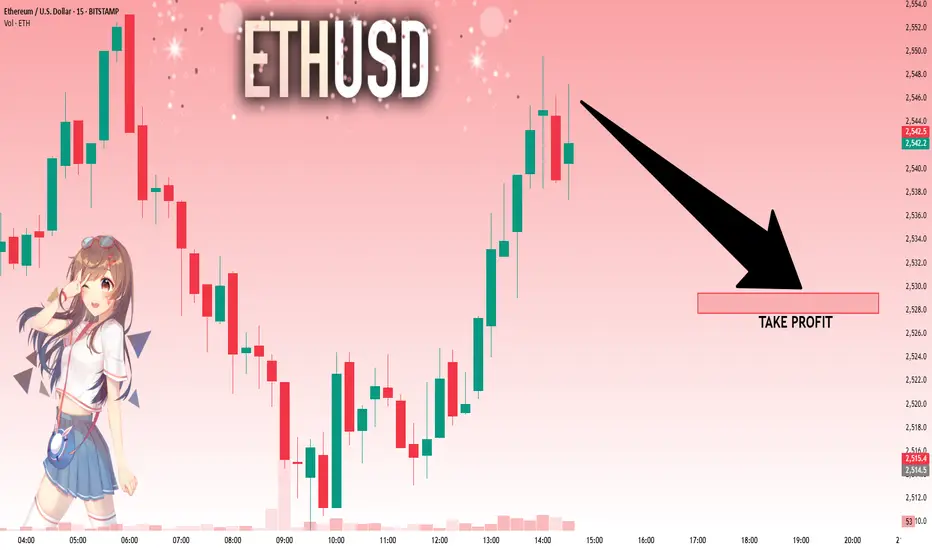
ETHUSD: Next Move Is Down! Short!
My dear friends,
Today we will analyse ETHUSD together☺️
The market is at an inflection zone and price has now reached an area around 2,545.9 where previous reversals or breakouts have occurred.And a price reaction that we are seeing on multiple timeframes here could signal the next move down so we can enter on confirmation, and target the next key level of 2,529.4..Stop-loss is recommended beyond the inflection zone.
❤️Sending you lots of Love and Hugs❤️
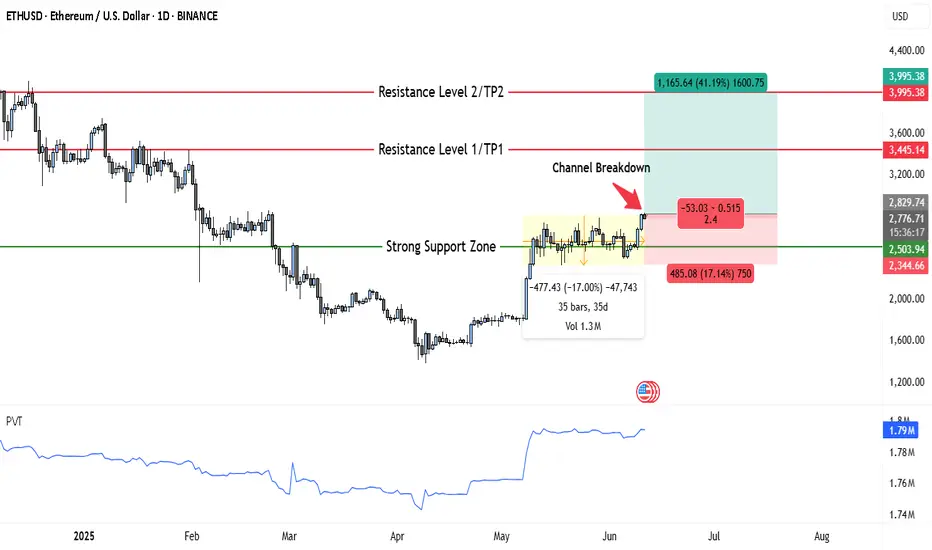
ETH Just Broke Out — Here’s Why $3,445 and $3,995 Are TPsEthereum is showing a strong bullish structure on the daily chart, having recently broken out of a month-long consolidation channel. After spending over 35 days trading in a narrow sideways range between approximately $2,345 and $2,780, ETH has now pushed through the upper boundary of that zone, signaling a shift in momentum.
This breakout from the accumulation zone is significant. The highlighted box on the chart indicates a period of low volatility and tight price compression—often a precursor to a sharp directional move. The breakout candle was decisive and supported by rising volume, as confirmed by the PVT (Price Volume Trend) indicator, which shows a clear uptick in accumulation. This suggests that institutional and smart money may be positioning for further upside.
The reclaimed level around $2,503, previously acting as major support, is now serving as a strong base. If ETH continues to close daily candles above this threshold, the bullish momentum is likely to continue. The immediate resistance lies around $3,445, marking the first target zone (TP1), followed by a more ambitious extension toward $3,995, which aligns with Resistance Level 2 (TP2). These targets represent gains of approximately 21% and 41% from current levels, respectively.
A measured trade setup from the current zone offers a solid risk-reward ratio of 2.4. The stop loss is reasonably placed just below the breakout structure at $2,344. If ETH falls back below this level and closes inside the previous channel, the breakout would be invalidated, and bulls would need to reassess.
This setup aligns with a classic trend continuation pattern—breakout from consolidation, volume confirmation, and a potential retest of the breakout level. As long as price remains above $2,503, bulls remain in control, and the medium-term outlook remains favorable.
In conclusion, Ethereum appears poised for a bullish continuation on the daily timeframe. The channel breakout, rising accumulation pressure, and clean technical structure support the idea that ETH may soon challenge higher resistance zones. However, price must hold above key support to maintain this bias. Traders and investors may view current levels as a favorable risk-entry opportunity with eyes on $3,445 and $3,995 as major profit zones.
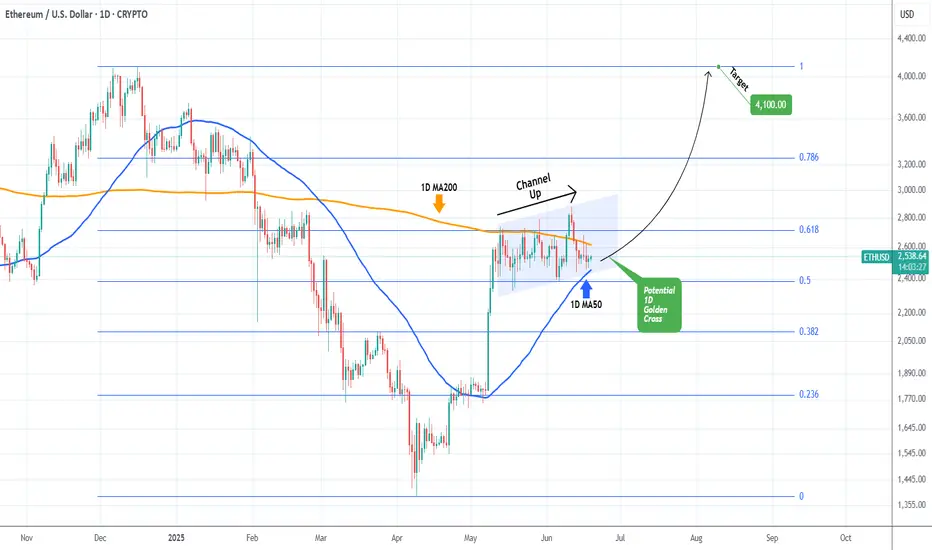
ETHEREUM Battling to hold its 1D MA50.Ethereum (ETHUSD) has been trading within a 5-week Channel Up pattern and in the past 2 days almost tested its 1D MA50 (blue trend-line). So far this is holding, showcasing the strong presence of buyers in that price region, which also happens to be the bottom of that Channel Up.
Ahead of a 1D Golden Cross that may potentially be formed in a week or so, this is the strongest buy signal we get since the April 09 bottom. Given also that the price is trading close to the 0.5 Fibonacci retracement level from the December 16 2024 High, the upside potential is significant. The obvious medium-term Target is that High at 4100.
-------------------------------------------------------------------------------
** Please LIKE 👍, FOLLOW ✅, SHARE 🙌 and COMMENT ✍ if you enjoy this idea! Also share your ideas and charts in the comments section below! This is best way to keep it relevant, support us, keep the content here free and allow the idea to reach as many people as possible. **
-------------------------------------------------------------------------------
💸💸💸💸💸💸
👇 👇 👇 👇 👇 👇
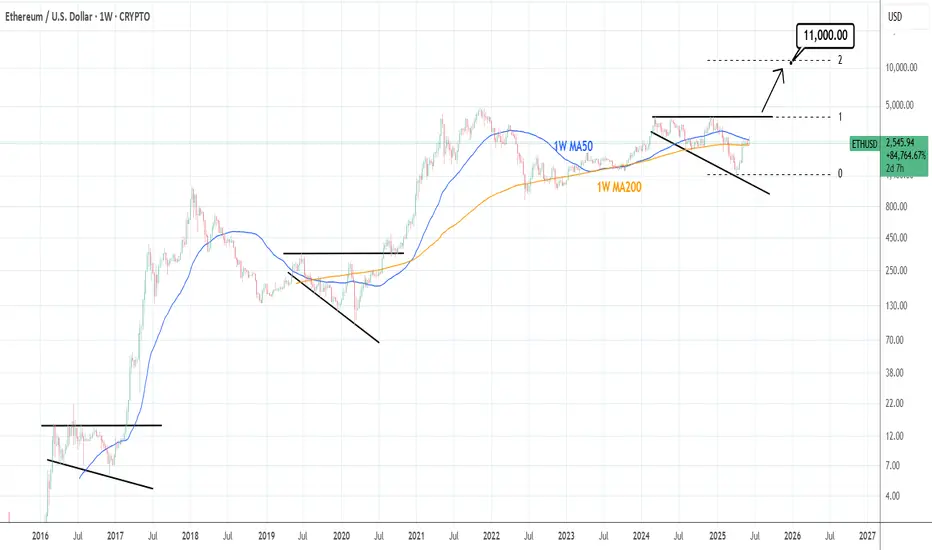
ETHUSD: This pattern always ends with massive rally.Ethereum has turned neutral on its 1D technical outlook (RSI = 50.794, MACD = 85.840, ADX = 26.701) as it's been compressed inside the 1W MA50 and 1W MA200 in the past month. The long term pattern here is a Megaphone - Broadening Wedge. Every Cycle formed one and historically once broken, it led to an enormous rally. We are still expecting the price to approach the top of this pattern on the medium term but if broken, you can aim for the 2.0 Fibonacci extension (TP = 11,000) if you want to pursue some risk.
## If you like our free content follow our profile to get more daily ideas. ##
## Comments and likes are greatly appreciated. ##
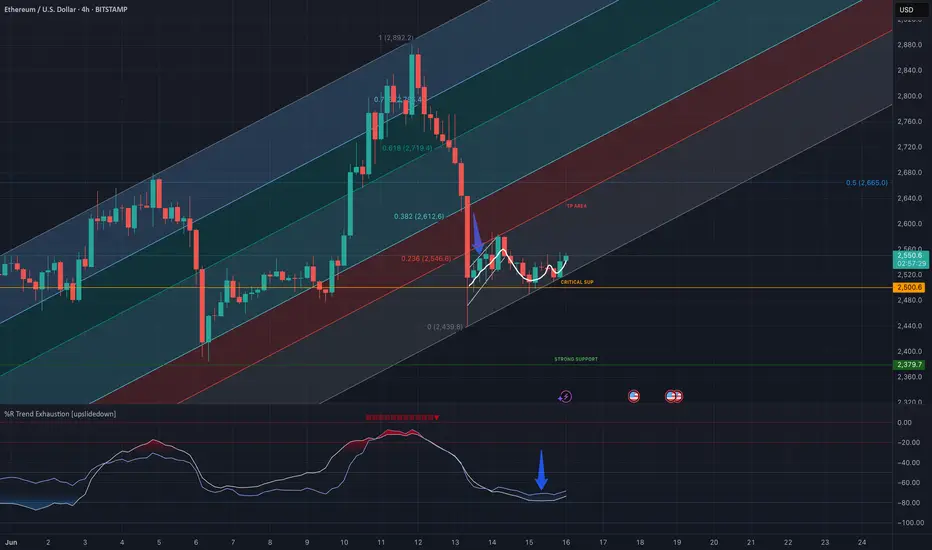
ETH SHOWING RESILIENCE! LONG OPPORTUNITY.After weeks of sideways price action, ETH has displayed multiple signals that regardless of worldwide geopolitical issues, we find ourselves in a great spot to trade the FIB channel, along with a simple trend exhaustion.
This is my personal favourite when it comes to perspective of what is really happening within the crypto space at the moment.
Lets get into the details!
Trading within the FIB if the support levels can hold, we have tested the $2500 support level multiple times, we have also seen a BULLISH FLAG with a break down, into a PERFECT CUP & HANDLE to the upside.
Along with confirmation of the trend exhaustion, we are seeing an uptick of bulls coming into the market and protecting the precious $2500 support line.
As long as ETH remains above $2500 and can continue to trade within the FIB channel, this is a great opportunity to long.
ETH is showing is resilience, lets see how this long trade plays out.
This is my opinion only, do not use this as financial advice. Good luck and lets get some gains! 🚀
Weekly Outlook $ETHI’d prefer to see price drop into the weekly FVG or weekly OB before looking for any new long positions. The $2,800 level has been rejected for 5 consecutive weeks, and in my opinion, we need to grab some liquidity before we can make a push toward $3,100.

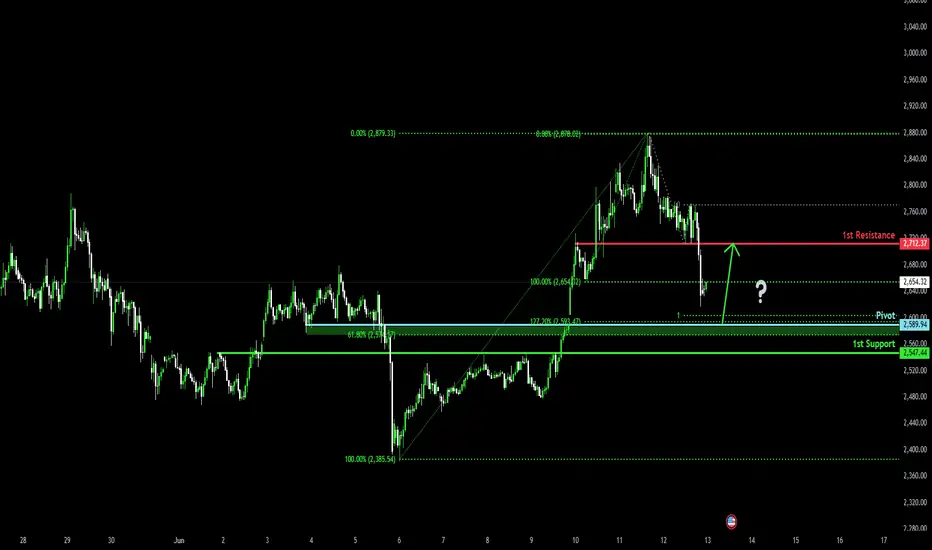
Bullish bounce?Ethereum (ETH/USD) is falling toward the pivot and could bounce to the 1st resistance which has been identified as a pullback resistance.
Pivot: 2,589.94
1st Support: 2,547.44
1st Resistance: 2,712.37
Risk Warning:
Trading Forex and CFDs carries a high level of risk to your capital and you should only trade with money you can afford to lose. Trading Forex and CFDs may not be suitable for all investors, so please ensure that you fully understand the risks involved and seek independent advice if necessary.
Disclaimer:
The above opinions given constitute general market commentary, and do not constitute the opinion or advice of IC Markets or any form of personal or investment advice.
Any opinions, news, research, analyses, prices, other information, or links to third-party sites contained on this website are provided on an "as-is" basis, are intended only to be informative, is not an advice nor a recommendation, nor research, or a record of our trading prices, or an offer of, or solicitation for a transaction in any financial instrument and thus should not be treated as such. The information provided does not involve any specific investment objectives, financial situation and needs of any specific person who may receive it. Please be aware, that past performance is not a reliable indicator of future performance and/or results. Past Performance or Forward-looking scenarios based upon the reasonable beliefs of the third-party provider are not a guarantee of future performance. Actual results may differ materially from those anticipated in forward-looking or past performance statements. IC Markets makes no representation or warranty and assumes no liability as to the accuracy or completeness of the information provided, nor any loss arising from any investment based on a recommendation, forecast or any information supplied by any third-party.
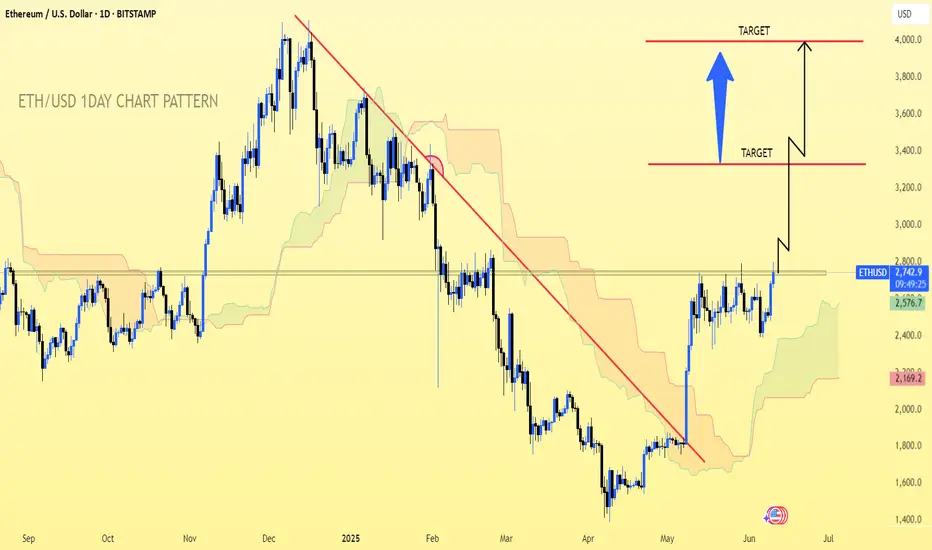
ETH/USD.1D CHART PATTERN.I'm looking at a long trade idea on ETH/USD with the following structure:
Buy Entry: $2,740
Target 1: $3,320
Target 2: $4,000
Here's a breakdown of the trade setup and key considerations:
---
📈 Trade Summary
Parameter Value
Entry $2,740
Target 1 $3,320
Target 2 $4,000
Potential Upside (to T1) ~21.2%
Potential Upside (to T2) ~46%
---
🔍 Technical Considerations
Before entering, consider:
1. Support at $2,740:
Check if this level aligns with major moving averages (e.g., 100/200-day) or prior demand zones.
2. Resistance Zones:
Around $3,320: Watch for profit-taking pressure or horizontal resistance.
$4,000: Likely a strong psychological and technical barrier.
3. Volume Confirmation:
Look for rising volume or breakout candles to confirm momentum.
---
⚠ Risk Management
Stop Loss: Consider placing it below recent support (e.g., ~$2,600 or tighter, depending on strategy).
Position Sizing: Use a % of your portfolio that fits your risk tolerance (e.g., risking 1–2% per trade).
---
✅ Example Risk/Reward (R:R)
To Target 1:
Risking $140 (Stop at $2,600), Gain of $580 → R:R ~4.1:1
To Target 2:
Gain of $1,260 → R:R ~9:1
---
Would you like a chart with technical indicators or help automating alerts on TradingView?
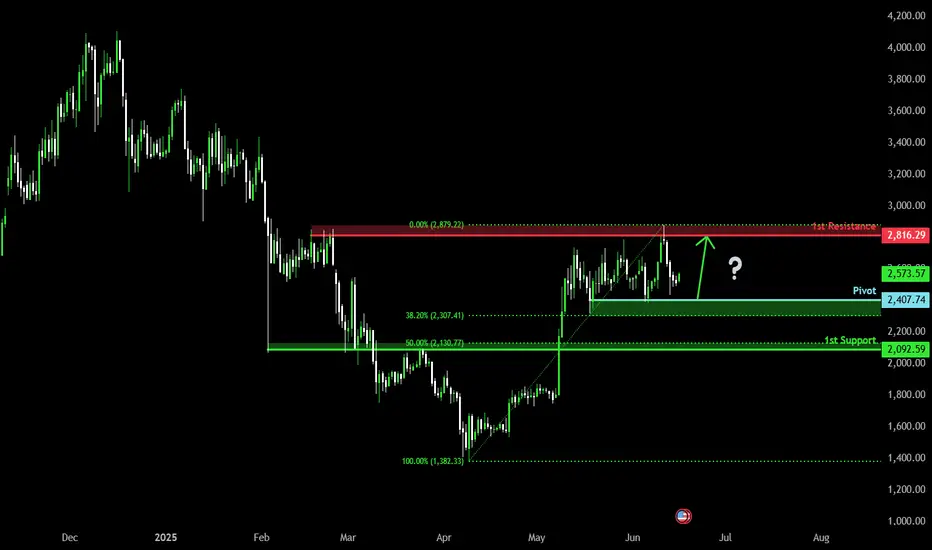
Bullish bounce off pullback support?The Ethereum (ETH/USD) is falling towards the pivot and could bounce to the 1st resistance.
Pivot: 2,407.74
1st Support: 2,092.59
1st Resistance: 2,816.29
Risk Warning:
Trading Forex and CFDs carries a high level of risk to your capital and you should only trade with money you can afford to lose. Trading Forex and CFDs may not be suitable for all investors, so please ensure that you fully understand the risks involved and seek independent advice if necessary.
Disclaimer:
The above opinions given constitute general market commentary, and do not constitute the opinion or advice of IC Markets or any form of personal or investment advice.
Any opinions, news, research, analyses, prices, other information, or links to third-party sites contained on this website are provided on an "as-is" basis, are intended only to be informative, is not an advice nor a recommendation, nor research, or a record of our trading prices, or an offer of, or solicitation for a transaction in any financial instrument and thus should not be treated as such. The information provided does not involve any specific investment objectives, financial situation and needs of any specific person who may receive it. Please be aware, that past performance is not a reliable indicator of future performance and/or results. Past Performance or Forward-looking scenarios based upon the reasonable beliefs of the third-party provider are not a guarantee of future performance. Actual results may differ materially from those anticipated in forward-looking or past performance statements. IC Markets makes no representation or warranty and assumes no liability as to the accuracy or completeness of the information provided, nor any loss arising from any investment based on a recommendation, forecast or any information supplied by any third-party.
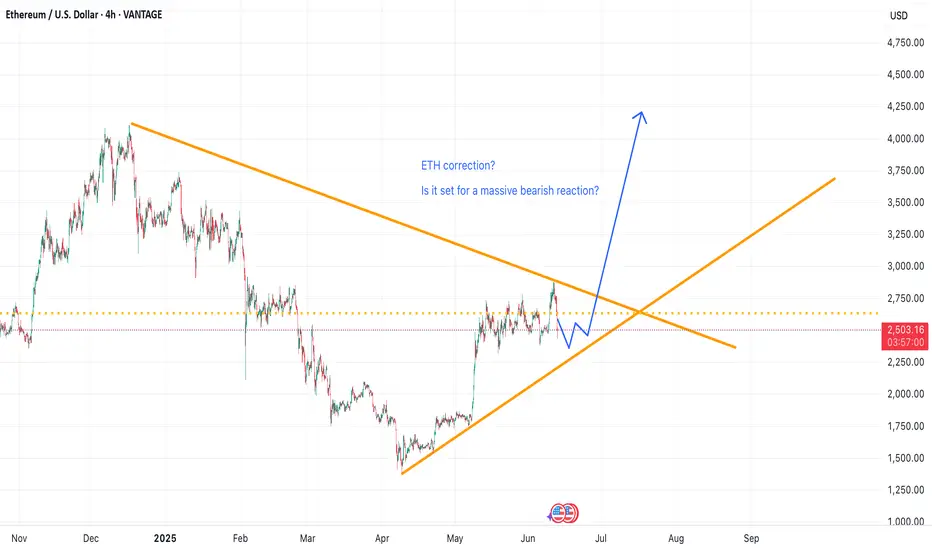
ETH is standing at the edge of the cliffCOINBASE:ETHUSD seems to have stalled between $2,400 and $2,800 without any clear fundamental reason, but from a technical perspective , the explanation is quite straightforward. After breaking down from a massive triangle pattern, ETH bounced back as if nothing had happened. However, the rally has hit a wall right at the former trendline, what used to be solid support is now acting as resistance.
This could be a sign that ETH’s upside momentum is running out. If the price breaks below $2,300 , it would likely confirm that the downtrend is just getting started and could leave ETH in a much weaker position.
Although the double top already played out and hit the 61.8% target (which might have led some to think the worst was over) there’s still a possible move toward the full 100% target, which sits just above $1,000, near the bottom edge of the triangle.
Putting fundamentals aside, this setup makes me lean heavily bearish on ETH if it drops below $2,300 . We are in front of a potential 50% decline in ETH, which is amazing specially if the risk that you are assuming is less than 5%.
On the other hand, if the price breaks above the previous trendline, it would open the door to a new, more bullish scenario with the price heading to 3.500$. Another way to play this, is by buying at 2.400$ area, and setting up a stop loss under 2.150$, the risk benefit is amazing again, so don't worry about the direction of ETH, be aware of the trading opportunities that is giving us in any direction!

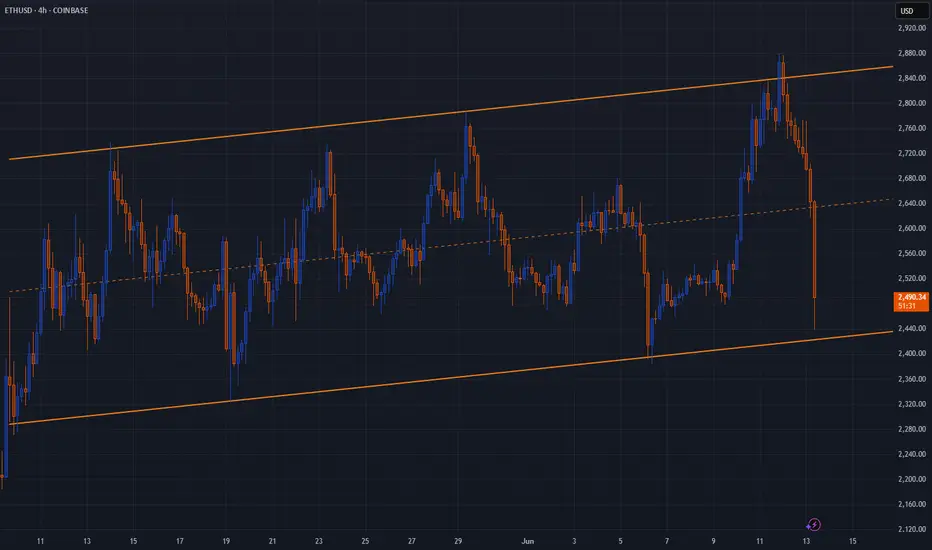
ETH will rebound.What you're looking at is a textbook rising channel, well-respected, clean, and elegant in its symmetry. For weeks, ETH has climbed this structure with rhythmic oscillations between support and resistance, almost as if the market were guided by a ruler and compass. Price action respected both boundaries with admirable discipline, making this a trader’s dream for range-based strategies. Now, that structure is being tested sharply.
The most recent candle shows a strong drop from the upper boundary straight to the lower. It didn't drift down gently but fell with force. Yet despite that intensity, price has landed precisely on the lower boundary of the channel. This is often where markets pause and reset. If the structure remains intact, and history offers any guide, this could mark the beginning of a fresh upward leg. The drop may have been more about clearing excess than breaking trend.
There is reason to believe in the bounce. The channel has been reliable, and deep tests like this often come before a recovery, not a collapse. If price begins to stabilize here, even modestly, it would suggest that the market still respects this structure. The next few candles will matter, but for now, the channel is holding. And when a structure like this holds after such a flush, it can produce some of the strongest moves back to the top.
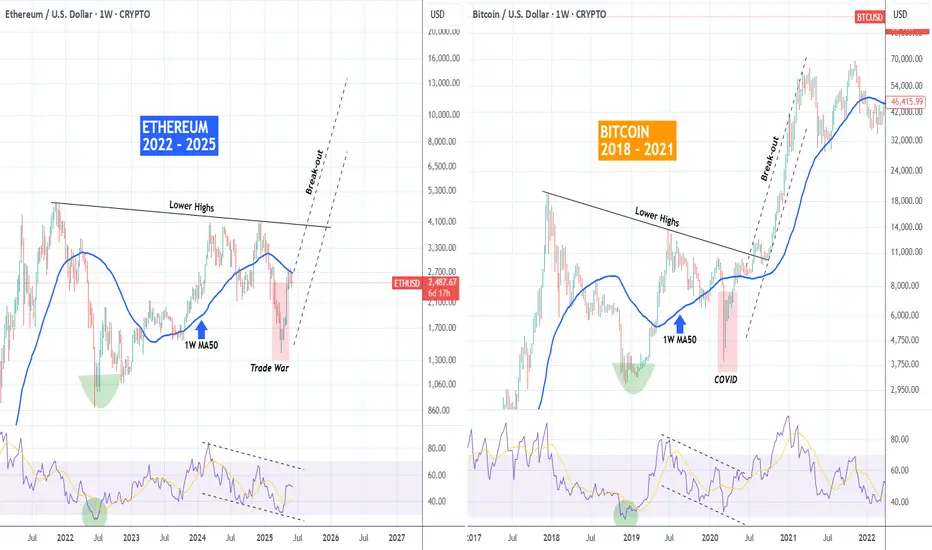
ETHEREUM is repeating BITCOIN's 2018-2021 Cycle!Ethereum (ETHUSD) has found itself on a very strong rally since the April 07 bottom, which resembles the V-shaped recovery of Bitcoin on the March 09 2020 bottom. In fact BTC's whole 2018 - 2021 Bull Cycle resembles ETH's 2022 - 2025 Cycle so far.
So far ETH is struggling to break above its 1W MA50 (blue trend-line) but the most important Resistance of the Cycle is the ATH Lower Highs trend-line. When that broke for Bitcoin, a parabolic rally started. Do you think we will see such a break-out on ETH too by the end of the year?
-------------------------------------------------------------------------------
** Please LIKE 👍, FOLLOW ✅, SHARE 🙌 and COMMENT ✍ if you enjoy this idea! Also share your ideas and charts in the comments section below! This is best way to keep it relevant, support us, keep the content here free and allow the idea to reach as many people as possible. **
-------------------------------------------------------------------------------
💸💸💸💸💸💸
👇 👇 👇 👇 👇 👇
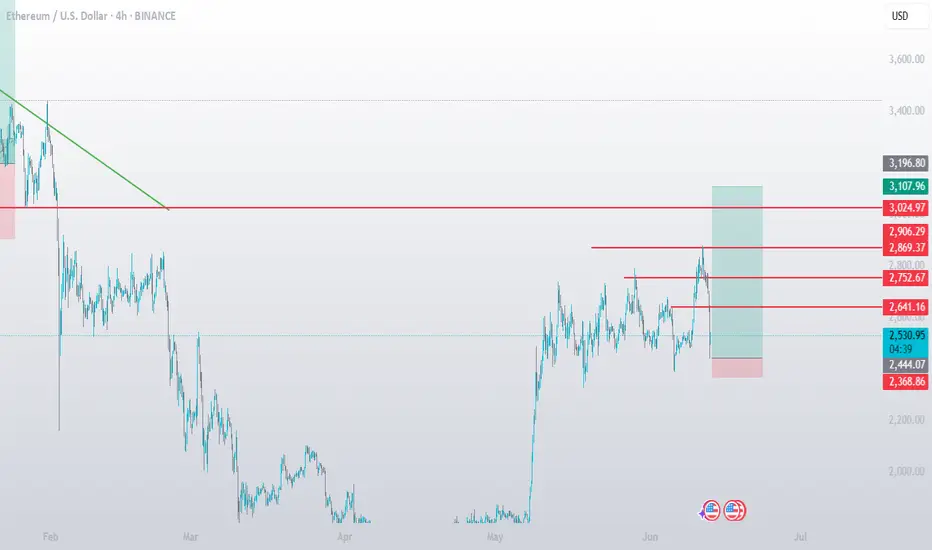
$eth long 🧠 Trade Idea
Ethereum has pulled back sharply after testing resistance at the $2,869–$2,906 zone. The current price around $2,527 shows signs of stabilizing just above previous demand ($2,444–$2,368), offering a potential long opportunity with clearly defined risk and multiple upside targets.
🎯 Trade Setup
Entry: $2,527.41 (market)
Stop Loss: $2,368.86 (below recent demand wick)
Take Profit Targets:
TP1: $2,641.16 (initial reaction level)
TP2: $2,752.67 (local high)
TP3: $2,869.37 (supply zone)
TP4: $3,024.97 (major resistance)
Extended TP: $3,107.96–$3,196.80 (macro trendline retest)
#ETH/USDT#ETH
The price is moving within a descending channel on the 1-hour frame, adhering well to it, and is heading toward a strong breakout and retest.
We are experiencing a rebound from the lower boundary of the descending channel, which is support at 2460.
We are experiencing a downtrend on the RSI indicator, which is about to break and retest, supporting the upward trend.
We are heading toward stability above the 100 moving average.
Entry price: 2540
First target: 2582
Second target: 2646
Third target: 2717

ETH is accumulating on a continuous patternETH is accumulating on a continious pattern and I just opened a postition at botten edge of this bottom,
I'' stop loss if the pirce action of ETH destroyed the bottom edge to go down strongly.
#Eth/usd retest on daily timeframe Price break the privious high with a good volume. And make retest on the privious high. If price give a pullback than you make a long trade on this
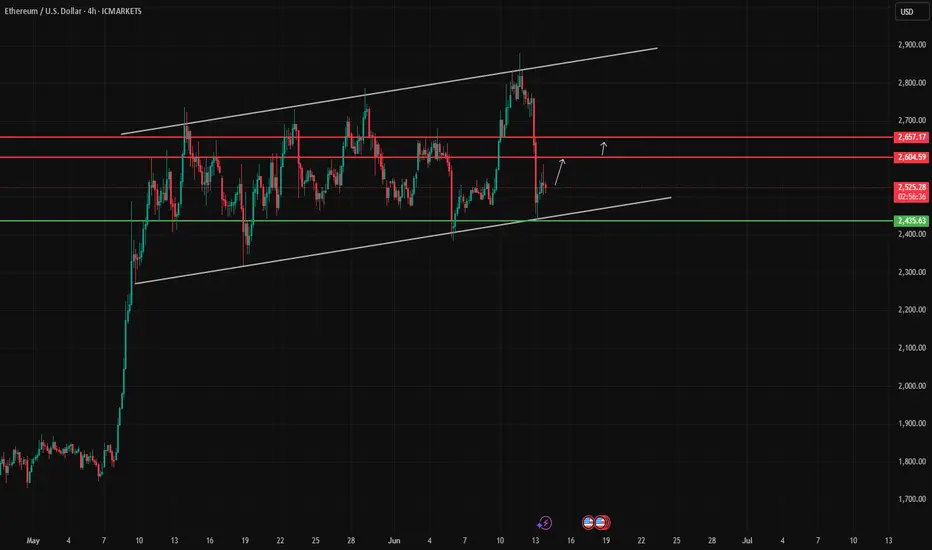
Ethereum / US Dollar (ETH/USD)ETH/USD is trading within a broad ascending channel on the 4H timeframe. The price has recently rebounded from the lower boundary of the channel around 2435.63 and is now attempting a recovery. If this rebound holds, the next bullish targets lie at 2604 and 2657. A break below 2430 would invalidate the bullish setup and could lead to deeper downside pressure.
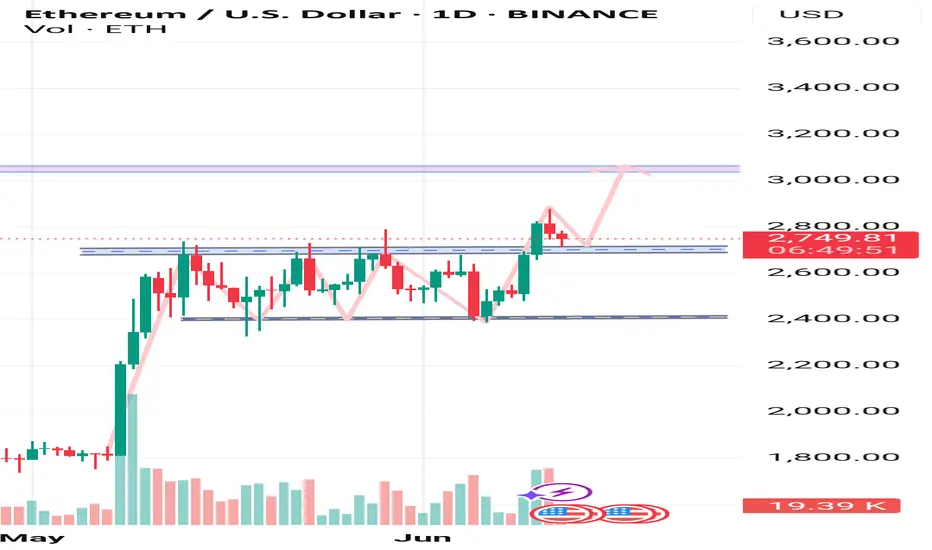
Reaccumulation Before Breakout? Idea Summary:
Ethereum is currently in a consolidation phase after testing the $2,700–$2,750 zone. Using Fibonacci retracement and extension levels, I anticipate a potential bullish continuation pattern forming above key support zones, with eyes on higher targets.
🔍 Technical Analysis:
Current price: ~$2,540
Key Fib retracement levels:
0.786 – ~$2,347 → holding as immediate support
0.618 – ~$2,222
0.5 – ~$2,064
0.382 – ~$1,906
Resistance zone: ~$2,734 (Fib 1.0)
Main breakout target:
1.618 extension – $3,563
2.618 extension – $4,904 (longer-term projection)
Price action suggests a potential bullish structure forming – a possible inverse head & shoulders or ascending triangle pattern.
Bullish Scenario:
If ETH holds above $2,300–$2,350 and breaks above the $2,730 resistance, we could see a surge toward the $3,560 level (1.618 Fib extension), with the possibility of entering a parabolic leg toward $4,900+ in the longer run.
Bearish Scenario:
If ETH fails to hold above the 0.786 level ($2,347), the next downside supports are:
$2,222 (0.618)
$2,064 (0.5)
These levels could offer new long entries depending on reaction.
Conclusion:
Ethereum is forming a solid base for the next move. As long as bulls protect the $2,300 zone, the chart favors upside continuation. A break above $2,750 would confirm strength and may trigger a powerful bullish extension.

Ethereum’s 19-Day ETF Inflow Streak: What Really HappenedEthereum’s 19-Day ETF Inflow Streak: What Really Happened to Price, Structure, and Sentiment
Table of Contents
1. Executive Summary
2. ETF Backdrop: How the 19-Day Inflow Wave Took Shape
3. Chronology of Price: Day-by-Day Performance
4. Weekly Chart Anatomy: The “Pre-Tower Top” Signal Explained
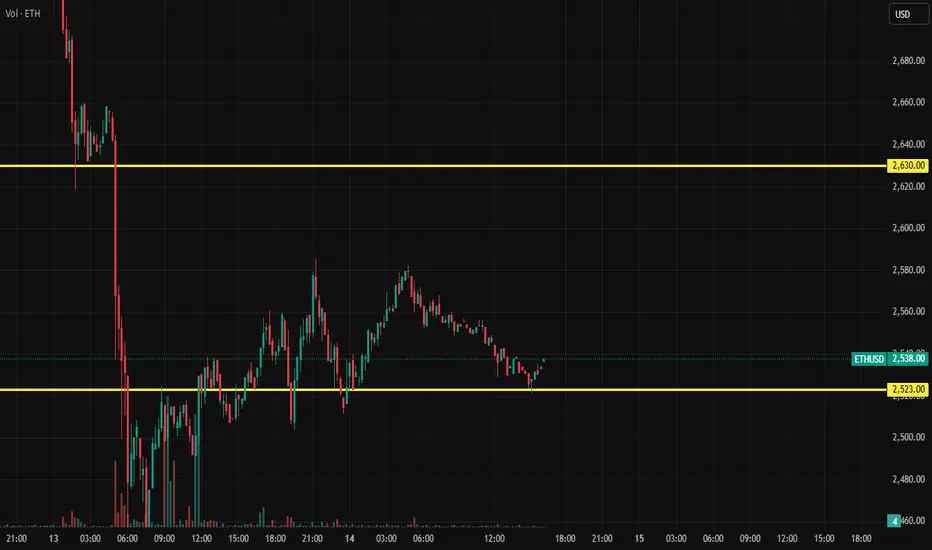
5. Intraday Technicals: From $2,450 Low to the $2,620 Hurdle
6. On-Chain & Derivatives Lens: Funding, OI, CEX Balances
7. Fundamental Undercurrents: Dencun Afterglow, L2 Fees, Staking Yields
8. Risks & Catalysts: ETH vs. Macro, vs. BTC Dominance, vs. SEC Noise
9. Playbooks for Traders and Long-Term Allocators
10. Conclusion: A Pause, Not a Peak—If Key Levels Hold
________________________________________
1. Executive Summary
• Ethereum received 19 consecutive days of net inflows into spot-linked exchange-traded products (ETPs) totaling $1.37 billion, the longest positive streak since the 2021 bull-run.
• Over the same period ETH/USD rose 18.4 %, printing a local high at $2,750, but has since pulled back to $2,575 amid broad crypto risk-off and Middle-East tensions.
• The latest weekly candle morphs into a “pre-tower top” pattern—two tall green candles followed by a small-bodied doji—often a harbinger of heavy distribution if confirmed by another red week.
• Short-term structure improved Monday: price pierced a contracting-triangle ceiling at $2,550, reclaimed the 100-hour SMA, and now eyes $2,620 as the gatekeeper to renewed upside.
• Funding rates flipped neutral, exchange reserves hit a 7-year low, and staking deposits outpace withdrawals 1.7 : 1—on-chain signs that the sell-off is more leverage shakeout than top formation.
________________________________________
2. ETF Backdrop: How the 19-Day Inflow Wave Took Shape
2.1. The Players
Unlike Bitcoin’s mammoth U.S. spot ETFs, Ethereum’s inflow streak drew from Europe and Canada, where physically backed ETPs have traded since 2021. The three biggest contributors:
Product Country 19-Day Net Flow AUM Growth
21Shares Ethereum ETP (AETH) Switzerland +$502 m +38 %
CI Galaxy Ethereum ETF (ETHX) Canada +$458 m +29 %
WisdomTree Physical Ethereum EU +$227 m +24 %
Rumors of an SEC approval window “after the U.S. election” sparked pre-positioning; asset managers figured it was cheaper to accumulate now than chase later once liquidity explodes on Wall Street.
2.2. Flow Mechanics
When an ETP issues new shares, it must buy spot ETH or tap an AP that can supply coins—direct demand unmatched by equivalent selling pressure. Over the 19-day window, the net 396 k ETH of creation equaled 57 % of all new issuance from block rewards post-Dencun, creating a measurable supply squeeze.
2.3. Historical Context
The only longer stretch was January–February 2021 (27 days), which culminated in ETH exploding from $1,400 to $2,000. The key difference today: market cap is six times larger, so identical inflows exert a milder percentage impact, explaining why price “only” added ~18 %.
________________________________________
3. Chronology of Price: Day-by-Day Performance
Day Date ETF Net Flow Price Close % Δ vs. Prior Day
1 Mar 18 +$58 m $2,110 —
5 Mar 22 +$73 m $2,265 +7.3 %
10 Mar 27 +$94 m $2,430 +2.4 %
15 Apr 1 +$125 m $2,690 +3.8 %
19 Apr 5 +$81 m $2,750 +0.9 %
Across the stretch, realized volatility rose from 32 % to 46 %, but skew stayed positive, showing call demand outpaced puts until the very end, when geopolitical headlines flipped sentiment.
________________________________________
4. Weekly Chart Anatomy: The “Pre-Tower Top” Signal Explained
4.1. What Is a Tower Top?
In candlestick lore, a tower top comprises:
1. A tall green candle (strong breakout)
2. Another tall green candle (exhaustion)
3. A narrow doji or spinning top (equilibrium)
4. A large red candle (breakdown confirmation)
We currently have the first three pieces: the last two weeks of March delivered back-to-back 10 % advances; the first week of April closed as a +0.6 % doji. The pattern is not confirmed until a decisive red week engulfs the doji body (< $2,540).
4.2. Indicators
• RSI (weekly): 59 → ticking down from 68 high; still shy of overbought.
• MACD histogram: Positive but flattening.
• Bollinger bands: Price mid-point of upper band, room for one more expansion.
Conclusion: the candle warns of fatigue, but momentum hasn’t rolled over—yet.
________________________________________
5. Intraday Technicals: From $2,450 Low to the $2,620 Hurdle
5.1. Hourly Chart (Kraken Feed)
• Triangle Breakout: Price sliced through descending trend-line at $2,550, tagging $2,590.
• Moving Averages: ETH trades marginally above the 100-hour SMA ($2,575) but below the 200-hour ($2,610).
• Fibonacci Zones: $2,620 aligns with 0.5 retrace of the $2,750→$2,450 fall—classic reversal pivot.
A clean hourly close >$2,620 opens the door to $2,680 (0.618 Fib) and psychological $2,700. Failure rejects to $2,520 support cluster.
5.2. Order-Book Heat Map
Coinbase Pro data shows 1,300 ETH ask wall at $2,620 and a thinner 890 ETH bid at $2,520. Liquidity skew favors dip-buying, but bulls need market orders >1 k ETH to smash the ask block.
________________________________________
6. On-Chain & Derivatives Lens
6.1. Exchange Reserves
Centralized exchanges now hold 12.9 million ETH, lowest since July 2017. The 19-day ETF harvest accelerated an already extant down-trend of roughly 60 k ETH/week outflows, mostly into staking contracts and L2 bridges.
6.2. Staking Flows
• Beacon deposit contract: +188 k in April’s first week.
• Withdrawal queue: 11 k ETH—tiny relative to deposits.
• Effective deposit APR after Dencun: 3.2 %, still beating U.S. 2-year T-notes post-tax for many investors.
6.3. Perpetual Funding & OI
• Funding normalized to 0.007 %/8 h (≈ 3.2 % APR), down from 9 % at March highs—spec longs flushed.
• Open Interest shed $420 m in the two-day dip—liquidations, not fresh shorts, drove the wash-out.
6.4. Options Skew
• 25-delta risk reversal (1-month): flipped to –4 % (puts pricier than calls) for first time since January—hedging demand but nowhere near panic-level (–12 % in 2022 bear).
________________________________________
7. Fundamental Undercurrents
7.1. Dencun Afterglow & L2 Fees
Proto-danksharding (EIP-4844) slashed L2 data costs by 85 %, pushing average Arbitrum and Optimism transaction fees under $0.02. Cheaper blockspace fuels on-chain activity:
Metric Pre-Dencun Post-Dencun Δ
Daily L2 Txns 2.4 m 4.1 m +71 %
Bridged ETH to L2s 6.8 m 7.9 m +16 %
More usage → more gas burned → structural tailwind to ETH as a fee-burn asset.
7.2. DeFi TVL
Total value locked rebounded to $61 billion, led by EigenLayer and restaking hype. ETH comprises 68 % of TVL collateral—every lending loop pins additional demand.
7.3. Competing Narratives
• Solana season siphoned retail mind-share; SOL/ETH ratio popped 42 % YTD.
• Bitcoin L2s (Stacks, Rootstock) attempt to mirror Ethereum’s smart-contract moat, but dev tooling remains nascent.
•
Net: Ethereum retains developer supremacy (70 % of new GitHub commits among smart-contract chains) and therefore garners institutional comfort.
________________________________________
8. Risks & Catalysts
Factor Bearish Angle Bullish Rebuttal
Macro Sticky U.S. CPI halts Fed cuts → higher real yields weigh on non-yielders ETH staking yield + MEV is real cash-flow; Dencun lowers L2 costs → adoption offset
SEC Spot ETF Delay past Jan 2026 or outright denial kills U.S. inflow dream 19-day streak proves ex-U.S. capital is hungry; approval >0 is all it takes for supply shock
BTC Dominance Halving FOMO may keep Bitcoin’s share >55 %, starve ETH rotation Historical pattern: ETH rips 6-10 weeks post-halving as beta plays catch-up
Tower-Top Pattern Weekly confirmation could spark drop to $2,200 support Pattern fails if bulls recapture $2,750 quickly, turning doji into bullish flag
________________________________________
9. Playbooks for Traders and Long-Term Allocators
9.1. Short-Term Momentum (0–7 days)
• Bias: Range-trade $2,520–$2,620 until breakout.
• Instruments: ETH-perp on Bybit/Deribit, 3× leveraged tokens for reduced funding bleed.
• Trigger: 15-minute candle above $2,620 with ≥ $50 m aggregated CVD buys.
• Stop: $2,560 (triangle retest).
• Target: $2,680 then $2,700.
9.2. Swing (1–8 weeks)
• Bias: Accumulate dips as long as weekly stays >$2,350 (0.382 Fib of Oct→Mar leg).
• Tools: 1-month $2,500-$2,800 call spreads; spot with 25 % collar protection.
• Catalysts: SEC commentary May 23, FOMC June 18.
9.3. Position (6–18 months)
• Bias: Dollar-cost average into staking nodes; carry 4 % ETH on portfolio NAV.
• Thesis: EIP-4844 usage boom + probable U.S. ETF = $4–5 k fair value by 2026.
• Risk Control: Hedge 25 % notional via BTC-perp short if BTC.D >58 %.
________________________________________
10. Conclusion: A Pause, Not a Peak—If Key Levels Hold
The 19-day ETF inflow streak proves that institutional demand for Ethereum exists even without a U.S. spot vehicle. Price responded vigorously but not parabolically, reflecting the asset’s growing market-cap gravity. The nascent “pre-tower-top” weekly candle warns of exhaustion; confirmation, however, requires another bearish week that cracks $2,540 support.
Short-term order-flow shows willing dip buyers, staking metrics scream supply sink, and the macro backdrop—while shaky—fails to dent ETH’s relative value proposition versus fiat yields. Translation: Ethereum is vulnerable to headline-driven squalls but structurally sound.
If bulls recapture $2,620, the path to retest $2,750 and ultimately $3,000 reopens. Lose $2,450 and the tower top will complete, sending ETH toward $2,200 where ETF inflow buyers likely reload. For now, the balance of evidence favors consolidation with an upward skew—tower construction, perhaps, but no wrecking ball yet.