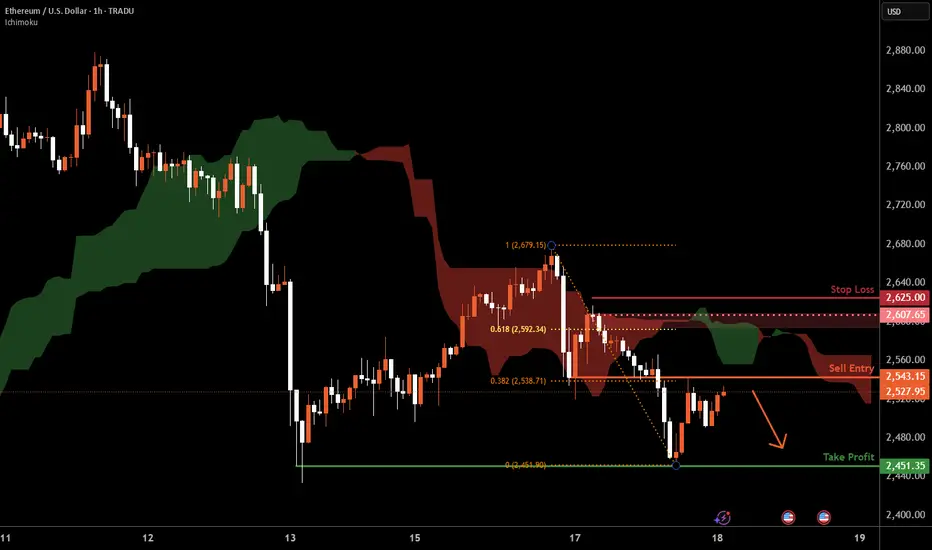
Ethereum H1 | Potential bearish reversalEthereum (ETH/USD) is rising towards a pullback resistance and could potentially reverse off this level to drop lower.
Sell entry is at 2,543.15 which is a pullback resistance that aligns with the 38.2% Fibonacci retracement.
Stop loss is at 2,625.00 which is a level that sits above the 61.8% Fibonacci retracement and a swing-high resistance.
Take profit is at 2,451.35 which is a multi-swing-low support.
High Risk Investment Warning
Trading Forex/CFDs on margin carries a high level of risk and may not be suitable for all investors. Leverage can work against you.
Stratos Markets Limited (tradu.com ):
CFDs are complex instruments and come with a high risk of losing money rapidly due to leverage. 63% of retail investor accounts lose money when trading CFDs with this provider. You should consider whether you understand how CFDs work and whether you can afford to take the high risk of losing your money.
Stratos Europe Ltd (tradu.com ):
CFDs are complex instruments and come with a high risk of losing money rapidly due to leverage. 63% of retail investor accounts lose money when trading CFDs with this provider. You should consider whether you understand how CFDs work and whether you can afford to take the high risk of losing your money.
Stratos Global LLC (tradu.com ):
Losses can exceed deposits.
Please be advised that the information presented on TradingView is provided to Tradu (‘Company’, ‘we’) by a third-party provider (‘TFA Global Pte Ltd’). Please be reminded that you are solely responsible for the trading decisions on your account. There is a very high degree of risk involved in trading. Any information and/or content is intended entirely for research, educational and informational purposes only and does not constitute investment or consultation advice or investment strategy. The information is not tailored to the investment needs of any specific person and therefore does not involve a consideration of any of the investment objectives, financial situation or needs of any viewer that may receive it. Kindly also note that past performance is not a reliable indicator of future results. Actual results may differ materially from those anticipated in forward-looking or past performance statements. We assume no liability as to the accuracy or completeness of any of the information and/or content provided herein and the Company cannot be held responsible for any omission, mistake nor for any loss or damage including without limitation to any loss of profit which may arise from reliance on any information supplied by TFA Global Pte Ltd.
The speaker(s) is neither an employee, agent nor representative of Tradu and is therefore acting independently. The opinions given are their own, constitute general market commentary, and do not constitute the opinion or advice of Tradu or any form of personal or investment advice. Tradu neither endorses nor guarantees offerings of third-party speakers, nor is Tradu responsible for the content, veracity or opinions of third-party speakers, presenters or participants.
ETHUSD.P trade ideas
Retest Flag and Continue Breakout $3500I think this pullback mainly driven by middle east uncertainty is a great gift to buy the pullback on BITSTAMP:ETHUSD
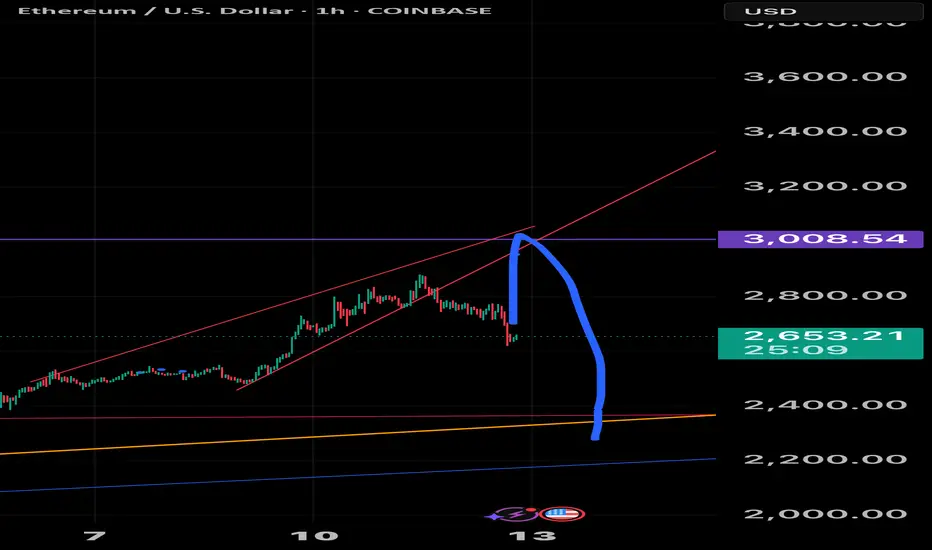
ETH $700 SWING SHORT MUST SEENext Prediction
$2600 to $3000
$3009 to $2300
⸻
Since the full Wedge failed to play out fully so now if we go up and inside the wedge has a higher higher giving us a huge swing
Target:
$2,300 is the full measured move if the rising wedge pattern plays out cleanly and fully resolves.
ETHUSD bullish continuation. I'm buying!!ETHUSD is bullish and this purge is an opportunity to buy lower. I've been calling this ETHUSD since 1600. Add more buys now. We are pushing for that ATH.
Ya gaize


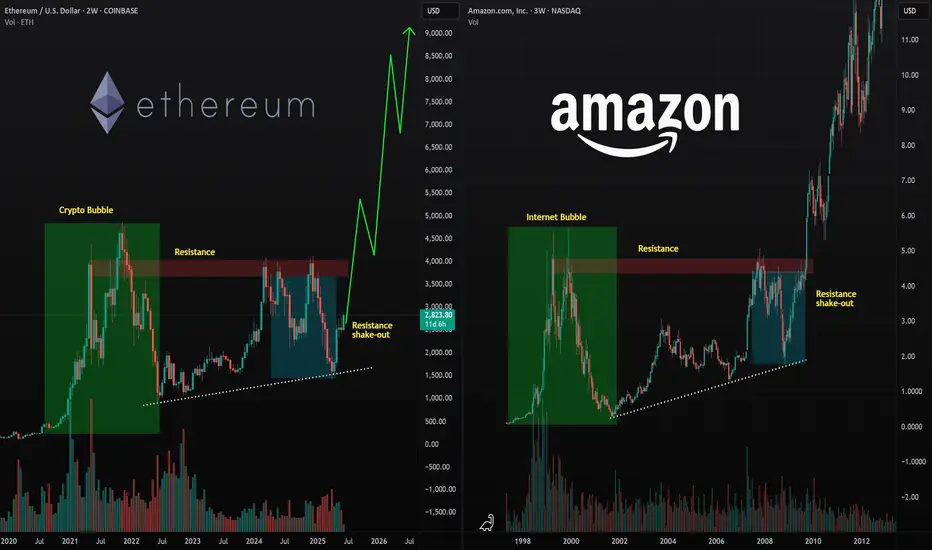
Ethereum Looks Identical to Early-Day AmazonToday I look at Ethereum versus early-day Amazon and the similarities between the internet bubble and the 2021 crypto bubble. Everyone talks about how the internet bubble popped, but few people talk about what came afterward. There was a strong recovery in the markets, and the internet was mass adopted by the public—along with the technology of home computers.
I believe we are heading into a mass adoption phase for crypto. We've had a bubble-and-pop scenario, and now that major institutions are investing in crypto, we are set up for mass adoption—very similar to what happened with home computing and the internet as a technology. I see Ethereum as being the "Amazon" of this new wave, and Bitcoin as being the "Apple." Big things are coming in these markets.
As always, stay profitable.
– Dalin Anderson
Ethereum bulls are enjoying the momentAfter violating the upper side of the range, MARKETSCOM:ETHEREUM is now aiming for the 3000 zone. Will the buyers have enough steam to drag it there? Let's have a look.
CRYPTO:ETHUSD
Let us know what you think in the comments below.
Thank you.
77.3% of retail investor accounts lose money when trading CFDs with this provider. You should consider whether you understand how CFDs work and whether you can afford to take the high risk of losing your money. Past performance is not necessarily indicative of future results. The value of investments may fall as well as rise and the investor may not get back the amount initially invested. This content is not intended for nor applicable to residents of the UK. Cryptocurrency CFDs and spread bets are restricted in the UK for all retail clients.

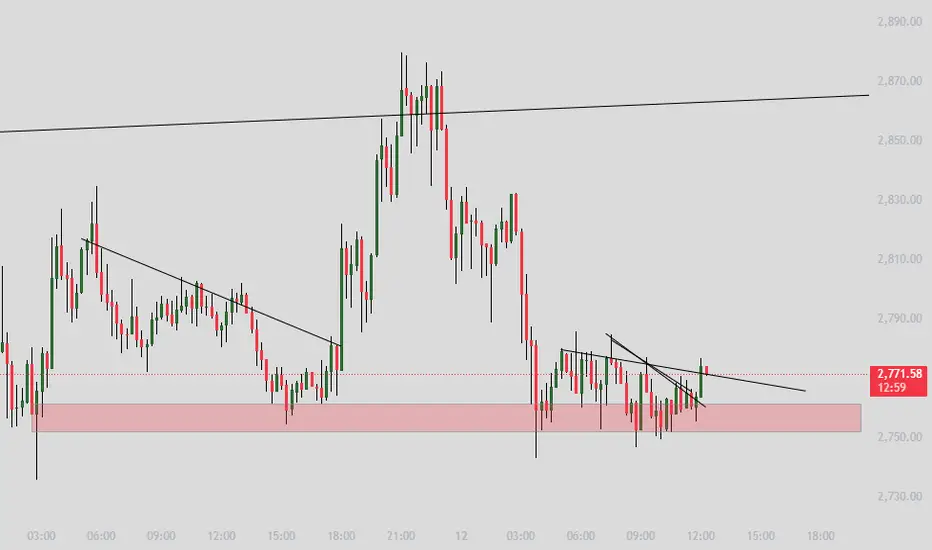
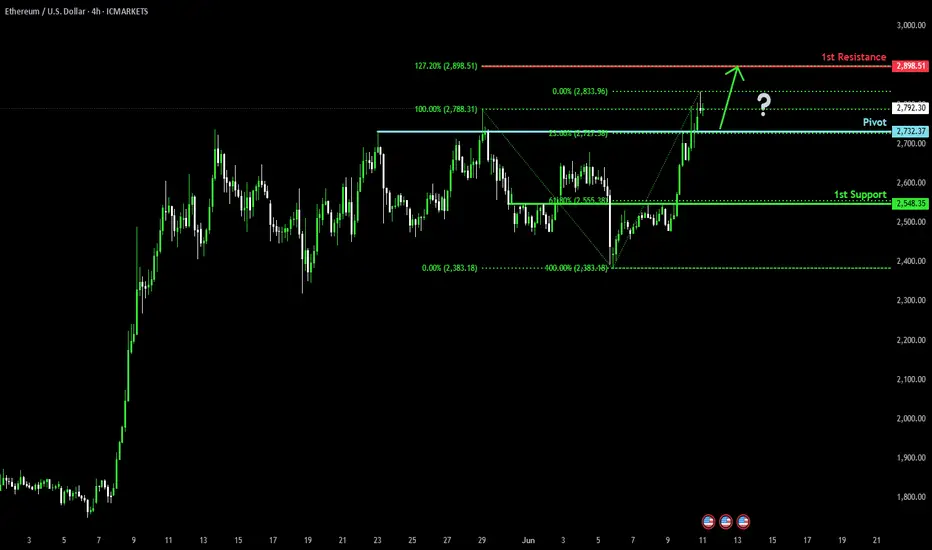
Bullish continuation?Ethereum (ETH/USD) is falling towards the pivot and could bounce to the 1st resistance.
Pivot: 2,732.37
1st Support: 2,548.35
1st Resistance: 2,898.51
Risk Warning:
Trading Forex and CFDs carries a high level of risk to your capital and you should only trade with money you can afford to lose. Trading Forex and CFDs may not be suitable for all investors, so please ensure that you fully understand the risks involved and seek independent advice if necessary.
Disclaimer:
The above opinions given constitute general market commentary, and do not constitute the opinion or advice of IC Markets or any form of personal or investment advice.
Any opinions, news, research, analyses, prices, other information, or links to third-party sites contained on this website are provided on an "as-is" basis, are intended only to be informative, is not an advice nor a recommendation, nor research, or a record of our trading prices, or an offer of, or solicitation for a transaction in any financial instrument and thus should not be treated as such. The information provided does not involve any specific investment objectives, financial situation and needs of any specific person who may receive it. Please be aware, that past performance is not a reliable indicator of future performance and/or results. Past Performance or Forward-looking scenarios based upon the reasonable beliefs of the third-party provider are not a guarantee of future performance. Actual results may differ materially from those anticipated in forward-looking or past performance statements. IC Markets makes no representation or warranty and assumes no liability as to the accuracy or completeness of the information provided, nor any loss arising from any investment based on a recommendation, forecast or any information supplied by any third-party.
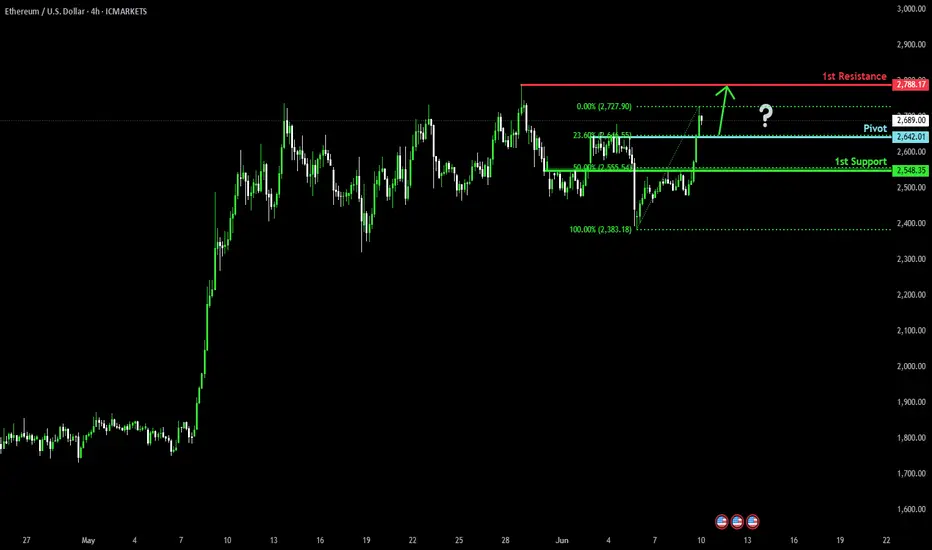
Bullish continuation?Ethereum (ETH/USD) is falling towards the pivot and could bounce to the 1st resistance.
Pivot: 2,364.01
1st Support: 2,548.35
1st Resistance: 2,788.17
Risk Warning:
Trading Forex and CFDs carries a high level of risk to your capital and you should only trade with money you can afford to lose. Trading Forex and CFDs may not be suitable for all investors, so please ensure that you fully understand the risks involved and seek independent advice if necessary.
Disclaimer:
The above opinions given constitute general market commentary, and do not constitute the opinion or advice of IC Markets or any form of personal or investment advice.
Any opinions, news, research, analyses, prices, other information, or links to third-party sites contained on this website are provided on an "as-is" basis, are intended only to be informative, is not an advice nor a recommendation, nor research, or a record of our trading prices, or an offer of, or solicitation for a transaction in any financial instrument and thus should not be treated as such. The information provided does not involve any specific investment objectives, financial situation and needs of any specific person who may receive it. Please be aware, that past performance is not a reliable indicator of future performance and/or results. Past Performance or Forward-looking scenarios based upon the reasonable beliefs of the third-party provider are not a guarantee of future performance. Actual results may differ materially from those anticipated in forward-looking or past performance statements. IC Markets makes no representation or warranty and assumes no liability as to the accuracy or completeness of the information provided, nor any loss arising from any investment based on a recommendation, forecast or any information supplied by any third-party.
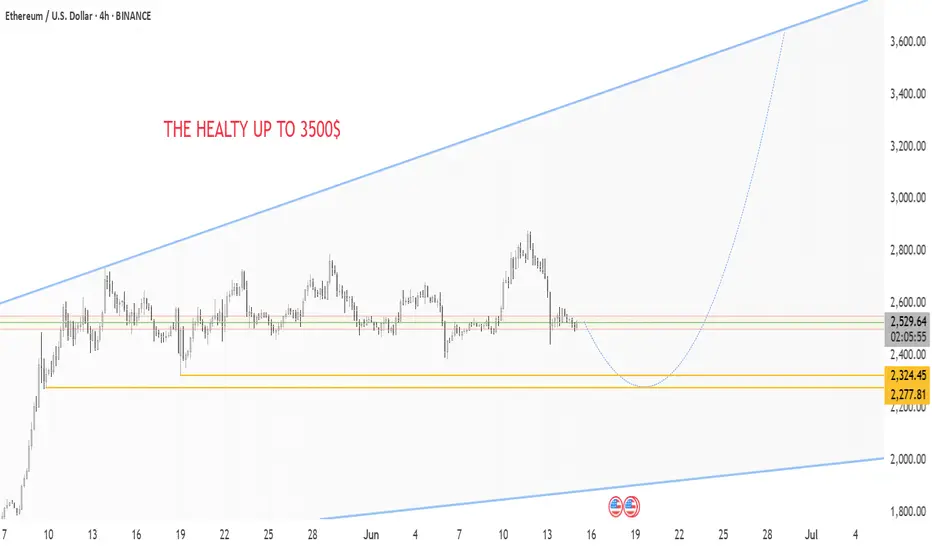
ETH/USD: The Great Ethereum Bounce is HERE!🚀 THE MOON MISSION (Resistance Zone)
HEALTY TARGET: $3,500 - Your text says it all!
Upper Trendline: Acting as launch pad
Psychological Resistance: $3,000 round number
🟢 CURRENT LAUNCH PAD
Price: $2,529.15 - Breaking above key resistance
Previous Resistance: $2,324.45 - Now turned support
Support Zone: $2,277.81 - Strong foundation
🔴 DANGER ZONE (Abort Mission)
Critical Support: Lower trendline around $2,000
Major Support: $2,277.81 level must hold
💡BUY ZONE: $2,100 - $2,180 🎯
⚠️STOP LOSS: $1999 (Previous resistance) ⚠️
TAKE PROFIT 1: $2,650 (Take 50% profits) 🔥
TAKE PROFIT 2: $3,300 (Let winners run!) 🔥
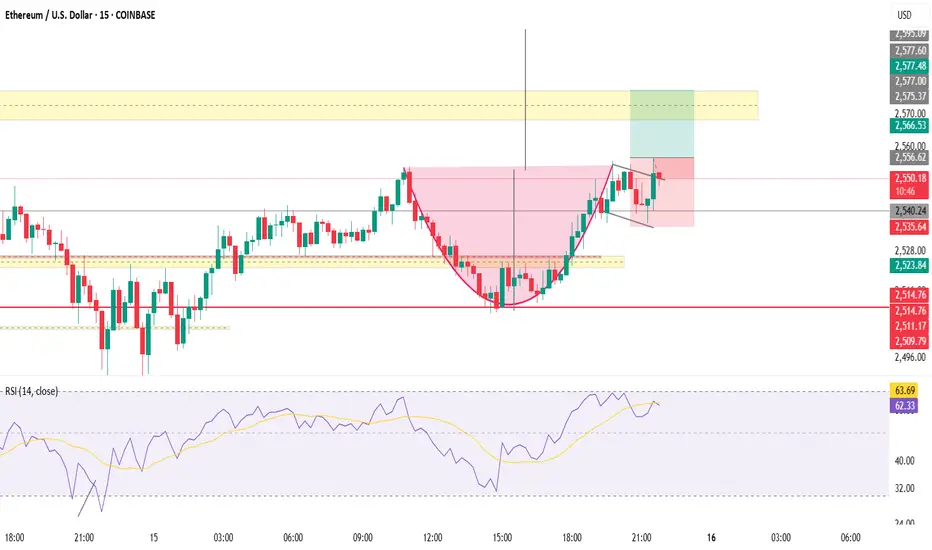
EHTUSD15 min TF
Buy on next breakout
Cup and Handle Format
Risk Reward mentioned in chart with TP SL EP
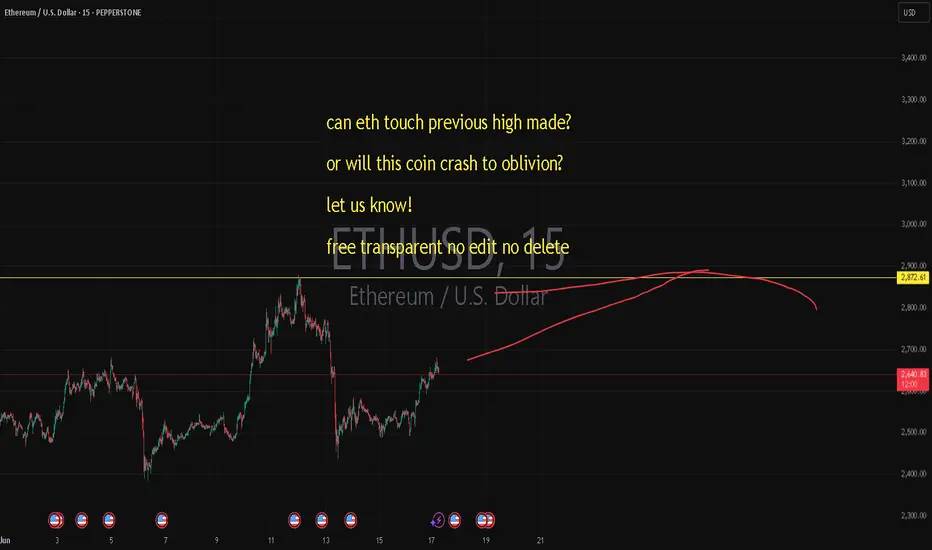
can eth touch previous high made? or will this coin crash?can eth touch previous high made?
or will this coin crash to oblivion?
let us know!
free transparent no edit no delete
🐉We value full transparency. All wins and fails fully publicized, zero edit, zero delete, zero fakes.🐉
🐉Check out our socials for some nice insights.🐉
information created and published doesn't constitute investment advice!
NOT financial advice
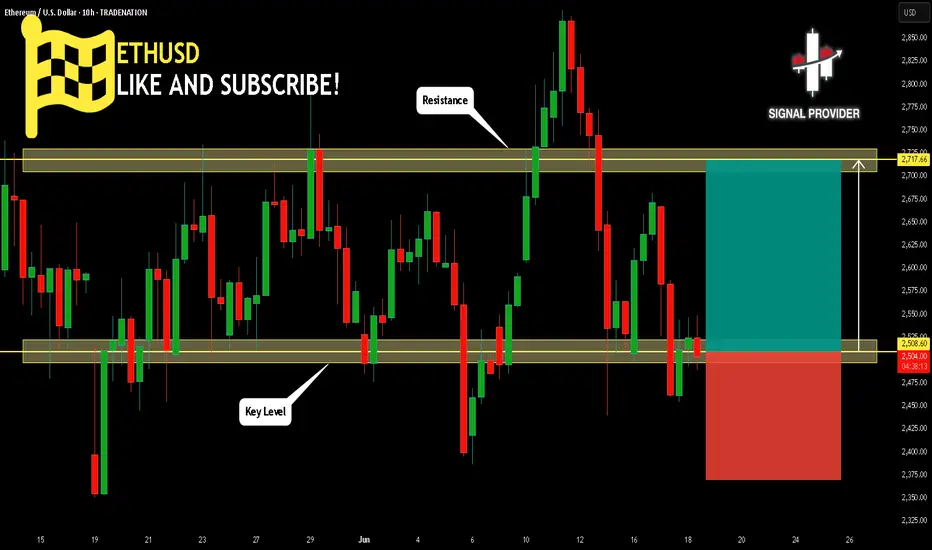
ETHUSD Is Very Bullish! Buy!
Take a look at our analysis for ETHUSD.
Time Frame: 10h
Current Trend: Bullish
Sentiment: Oversold (based on 7-period RSI)
Forecast: Bullish
The market is on a crucial zone of demand 2,508.60.
The oversold market condition in a combination with key structure gives us a relatively strong bullish signal with goal 2,717.66 level.
P.S
Please, note that an oversold/overbought condition can last for a long time, and therefore being oversold/overbought doesn't mean a price rally will come soon, or at all.
Disclosure: I am part of Trade Nation's Influencer program and receive a monthly fee for using their TradingView charts in my analysis.
Like and subscribe and comment my ideas if you enjoy them!
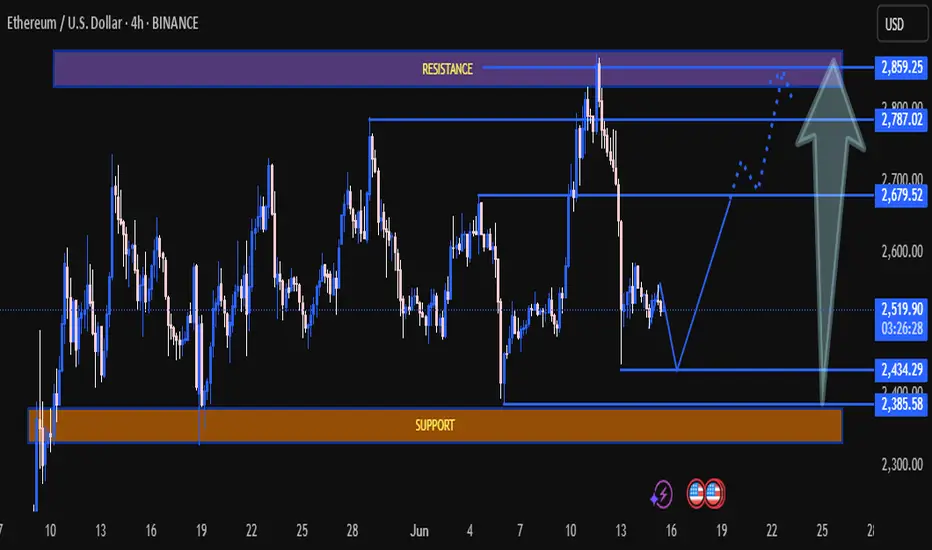
Ethereum (ETH/USD) 4H Analysis – Preparing for a Major Bullish 🚀 Ethereum (ETH/USD) 4H Analysis – Preparing for a Major Bullish Move! 📈⚡
📊 Chart Overview:
Ethereum is currently forming a bullish structure on the 4H timeframe, setting up for a potential strong rebound from the key support zone between $2,385 – $2,434. The chart projects a two-leg correction followed by a rally toward $2,787 – $2,859 resistance, suggesting bullish momentum is building. 🔄💥
🔍 Key Technical Insights:
🟧 Major Support Zone ($2,385–$2,434)
This orange support block has been tested multiple times and is holding well. It’s a strong demand area where buyers are likely to step in again.
🔵 Current Price Action:
ETH is hovering around $2,519, with a possible dip toward the lower support zone before triggering a bounce. The bullish projection path (dotted line) suggests price may establish a higher low and begin a fresh uptrend. 📉➡️📈
🟪 Strong Resistance Ahead ($2,787–$2,859)
A large resistance cluster lies ahead, where previous rejections occurred. This zone will be critical — a clean break above could lead to significant upside continuation.
📐 Structure Overview:
Mid-range level: $2,679 (key pivot point)
Short-term resistance: $2,679
Target zone: $2,787–$2,859
Potential retracement base: $2,434–$2,385
📈 Projection Arrow:
Chart suggests a dip then a rally with potential bullish breakout — traders watching for a bullish confirmation pattern (double bottom, bullish engulfing, or breakout candle).
🧠 Conclusion:
ETH is nearing a buy zone for swing traders! A strong bounce from $2,434–$2,385 could offer a lucrative long opportunity toward the $2,850 region. A break above that resistance could open the door to a new bullish leg. 🚀📊
📌 Trade Setup Idea:
🔹 Entry: $2,440–$2,500
🎯 Target: $2,787 → $2,859
🛡️ SL: Below $2,385
Et herino getting rejected - bigger correction likely- several strong wicks to the upside
- yellow stripe signal on the 2D time-frame (comments)
- Bitcoin looking like it wants lower as well
Best case scenario for ETH here would be a correction that leads to a HIGHER LOW above 2000$. Potential surge above 3000$ and 4000$ later this year.

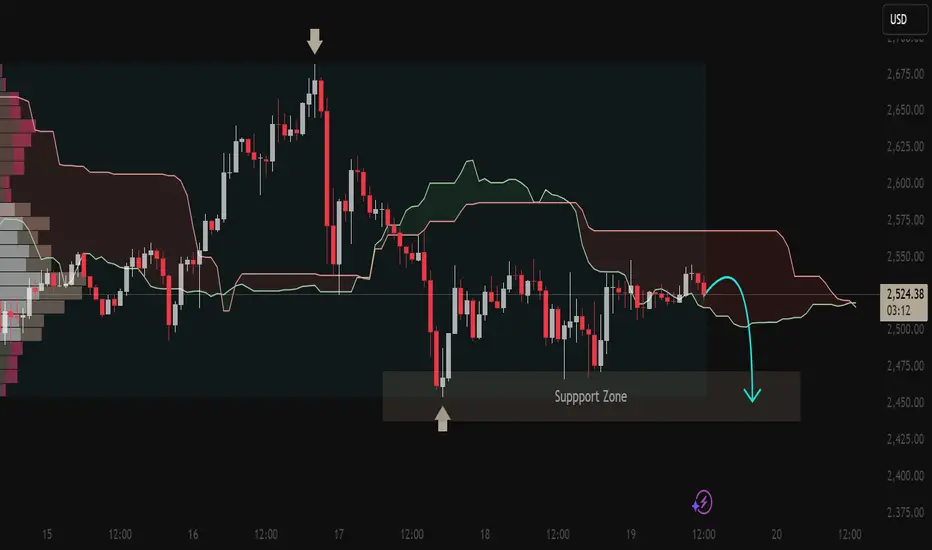
ETH/USD Technical Analysis📉 ETH/USD Technical Analysis
📅 Published: June 19, 2025
🔍 Platform: TradingView | Analyst: MQL_CodedPips
🔹 Market Context:
The market structure shows a clear shift from bullish to bearish momentum after rejecting a key resistance area. The price action is now consolidating below the Ichimoku Cloud — a signal of weakness and potential continuation to the downside.
🔸 Key Technical Highlights:
Rejection from Resistance:
Price formed a clear top with a long upper wick, confirming seller dominance.
Marked rejection aligns with a previous high and overbought condition.
Bearish Ichimoku Setup:
Price is trading below the Kumo Cloud, indicating bearish sentiment.
Bearish Tenkan-Kijun crossover occurred earlier, reinforcing downside pressure.
Support Zone Reaction:
A strong bounce was seen from the marked support zone, showing short-term buyer interest.
However, price has failed to reclaim above the cloud, suggesting limited bullish strength.
Volume Profile Indication:
High volume node on the left suggests strong historical activity in that zone, but failure to hold could result in a sharp move down.
Forecast Path (Illustrated):
The chart projects a potential bearish move, targeting a retest of the support zone.
If that zone fails, a breakdown toward the $2,450–$2,425 area becomes likely.
🧭 Conclusion:
ETH/USD is showing signs of distribution after a failed breakout, now leaning bearish under key technical indicators. A confirmed breakdown below the support zone would validate the short-term bearish scenario.
Outlook:
🔻 Bearish bias while price remains below the Kumo Cloud.
📌 Watch for price action at support zone for either a bounce or breakdown.
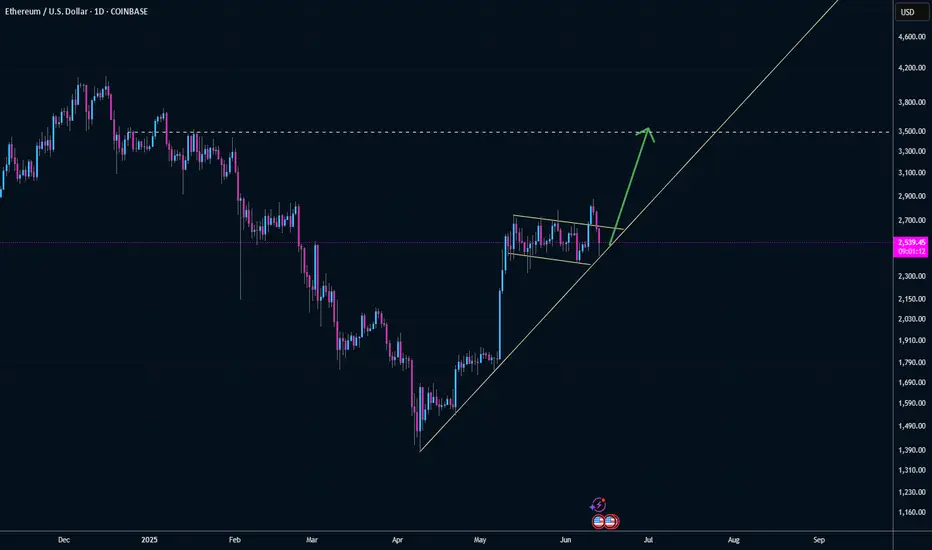
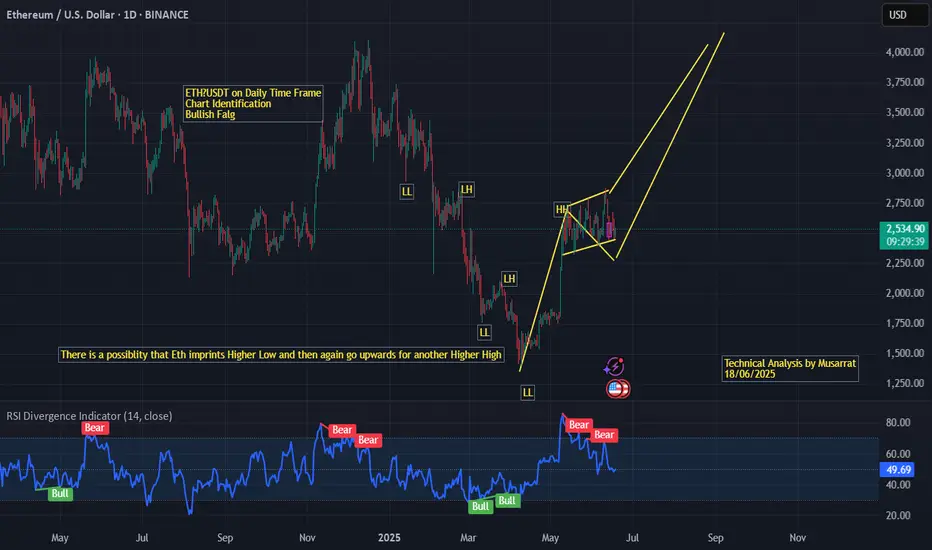
ETH/USDT Daily Timeframe – Bullish Flag Pattern IdentifiedThe chart shows Ethereum forming a bullish flag pattern after a strong upward rally, indicating potential continuation of the bullish trend. The recent price structure reflects a consolidation phase in a downward-sloping flag, following a significant impulsive move.
Key highlights:
The sequence of Higher Highs (HH) and Higher Lows (HL) suggests a shift in trend structure.
The current flag pattern aligns with the textbook characteristics of a bullish continuation setup.
RSI shows previous bullish divergence, supporting the case for upward momentum resumption.
🔸 Outlook: If ETH prints another higher low and breaks above the flag resistance, it may surge toward a new higher high in the $3,000–$3,500 zone.
$ETHAs stablecoins gain real-world adoption, CRYPTOCAP:ETH demand might explode.
Why? Most stablecoins are backed or run on Ethereum.
People can spend stablecoins while keeping ETH locked not sold.
This creates real utility for ETH… and tightens its supply.
#Ethereum #ETH #Stablecoins #DeFi #Crypto
ETHUSD is moving within the 2390.00 - 2880.00 range 👀 Possible scenario:
The crypto market fell on June 17, with only 10 of the top 100 coins in the green. Total market cap dropped 2.1% to $3.45T, while trading volume surged to $118B. Ethereum (ETH) slipped 1.7% to around $2,550, retreating from an intraday high of $2,672. ETH is now attempting to reclaim the $2,610 level.
Fundamentals remain strong: U.S. spot Ether ETFs continue to accumulate ETH, with BlackRock’s ETHA holding nearly $650M. Staking yields, tokenized real-world assets, and DeFi infrastructure are also driving momentum.
However, June has historically been bearish for ETH. Data from CryptoRank shows it’s Ethereum’s second-worst month on average, with only three green Junes in 10 years. Analysts warn a drop below $2,500 could send ETH to $2,000 — but many still expect a rally to $3,500–$6,000 in the long term.
✅Support and Resistance Levels
Support level is now located at 2,390.00.
Now, the resistance level is located at 2880.00.
ETH 06/15ETH is not bullish. It’s delayed. Strength isn’t absence of collapse — it’s the pause before it. Exit. Re-enter at 2,200. Obey structure, not emotions.

ETH PERPETUAL TRADE, Sold From $2695ETH PERPETUAL TRADE
ETH SELL SETUP
Currently $2695
Sold From $2695
(Trading plan If ETH go up to $2750
will add more shorts)
Expecting target $2630 OR DOWN
In the event of an early exit,
this analysis will be updated.
Its not a Financial advice

ETH/USDT – Bullish Setup UnfoldingEthereum has broken a key market structure, confirming bullish momentum. After the structure break, we saw a clean retest on our order flow level, signaling strong buyer interest.
Current Outlook:
📈 ETH is showing solid bullish continuation signs
📊 Higher highs and higher lows forming
🔁 Retest confirmation adds confluence
📍Key levels:
💡 My Strategy: Adding to long positions. As long as ETH holds above the retest zone, upside potential remains strong. I’m targeting the next major resistance zone.