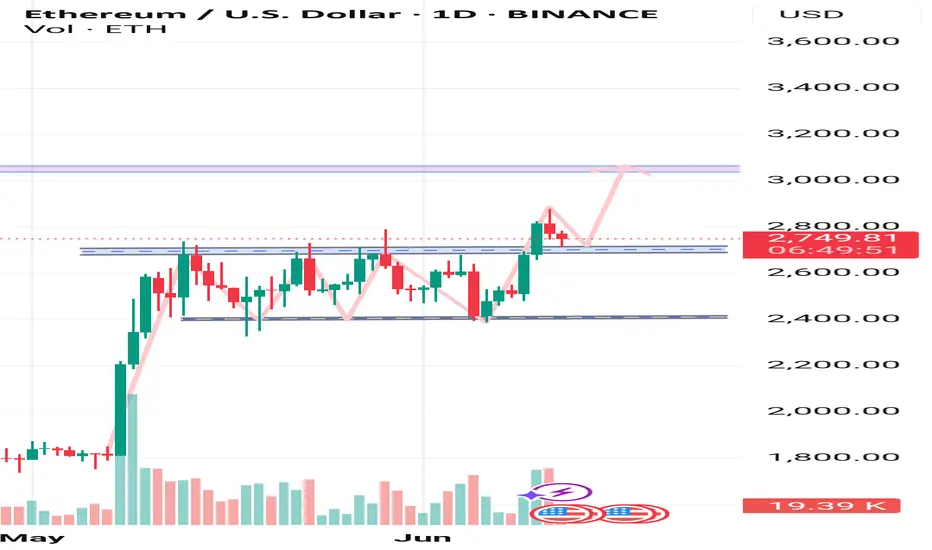
ETHUSD broke the Resistance level 2800.00 👀 Possible scenario:
Ethereum overtook Bitcoin in derivatives trading, hitting $110B — a 38% jump — compared to Bitcoin’s $84.7B. ETH price climbed 4% to $2,820, its highest since February. Key growth drivers include strong inflows into US spot ETH ETFs ($890M over 16 days), rising DeFi activity (TVL up 32% to $118.8B), and positive SEC signals. The Pectra update boosted scalability and reduced costs. OpenSea also saw peak user activity since 2023.
With ETF staking approval, ETH could reach $5,500–6,700 by year-end, and $10,000–20,000 by 2030. Crypto analyst suggests ETH may mirror Bitcoin’s 2021 rally. If ETH breaks the $4,200 and reclaims the 1-week MA50, it could stage a massive run — possibly topping $10K by 2026, or even $15K in a parabolic scenario.
✅ Support and Resistance Levels
Support level is now located at 2,390.00.
Now, the resistance level is located at 2,850.00.
ETHUSD.P trade ideas
ETH HIT THE LIKE TO MANIFEST THISETH/USD is teasing the breakout zone again... 👀
Are we finally ready for liftoff, or is it another fakeout? 🚀🔄
The chart’s looking spicy, and the energy feels right. 🌌
Hit that like to manifest the pump — we’re in this together. 💎🙏
Let’s speak green candles into existence! 📈✨
#ETH #Ethereum #CryptoVibes #ManifestMoneyMoves #ETHUSD #ToTheMoon"
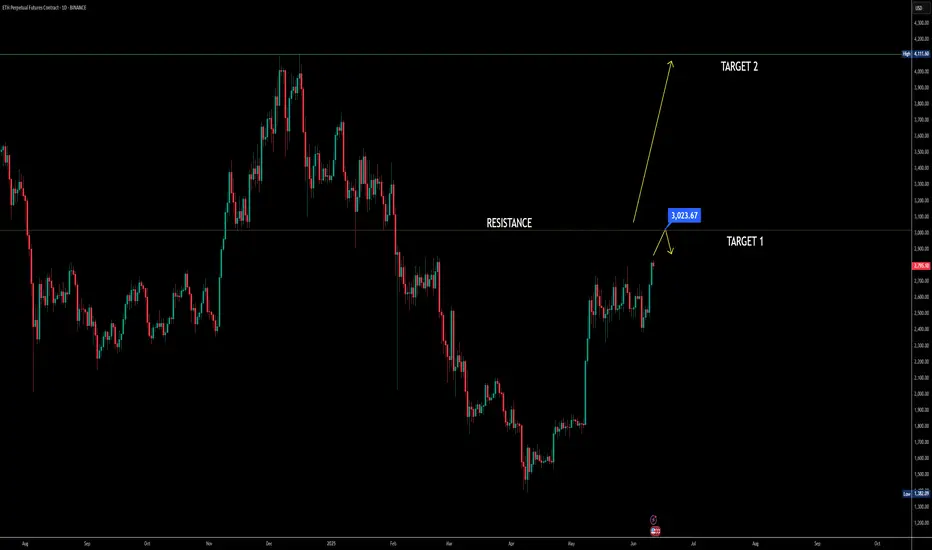
$Eth Breaks Key Resistance! Is $4100 Coming Next? Ethereum has officially broken above its previous resistance at $2900 and is now aiming for the critical $3000 psychological level. Here's a step-by-step breakdown of what to expect next, including MACD, RSI signals, and CPI data impact.
🔹 Step 1: Breakout Confirmation
Ethereum has successfully broken above the $2900 resistance level — this area is now acting as immediate support.
🔹 Step 2: Next Short-Term Target – $3000
ETH is expected to hit the round number resistance at $3000, which is the next major level to watch. This is the first price target.
🔹 Step 3: MACD & Stochastic RSI Support Bullish Move
MACD is crossing to the bullish side, showing increasing momentum.
Stochastic RSI is also favoring bullish continuation — indicating a likely move to $3000 and beyond.
🔹 Step 4: Possible Rejection Zones
If ETH faces rejection near $3000 or $3500, especially if Bitcoin shows weakness or stalls, expect a pullback.
🔹 Step 5: Target 2 – $4100 if Breakout Continues
If ETH convincingly breaks above $3000 and sustains momentum, $4100 becomes the next major target. This level aligns with the previous high and potential macro continuation.
🔹 Step 6: Watch CPI Data Impact
A positive CPI reading will strengthen bullish sentiment and help ETH push toward $4100.
A negative CPI surprise might trigger a reversal — but even in that case, a short-term hit of $3000 remains likely.
Key Levels to Watch:
Support: $2900, $2800
Resistance: $3000 (Target 1), $3500 (Interim), $4100 (Target 2)
Ethereum's price structure looks bullish above $2900, supported by technical indicators and macro optimism. The $3000 level is within reach, and if momentum continues, $4100 is the next upside target. Keep an eye on BTC behavior and CPI release for confirmation or reversal signals.
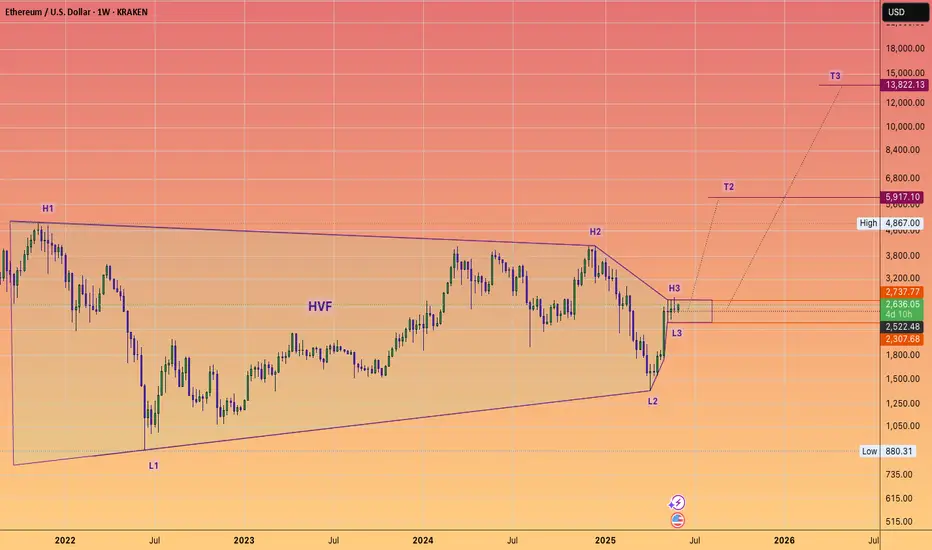
ETH will 5X from HERE! Hit the Like to manifest this.I'm serious hit the like to turn this #HVF into a reality.
I have been monitoring this pattern build out for years now.
BUT we are on the verge on triggering this pattern any day now, and triggering a massive Altcoin run which sucks in capital from all parts of the globe.
@TheCryptoSniper
ETH updateDo you understand breakout n retest? Well this is how market brakes out this is how to see if a trend breakout,I don't not have any reason to sell this pair because it's already shift and breakout from temporary selling trend soo the best n easy way to follow it now is to do what, to counter pull back n manage to move with the trend,I do not believing in explanations or telling peoples many thing,simple analysis few explanations right directions we win n let looser make noise,do not believe in explanations more than what you see.

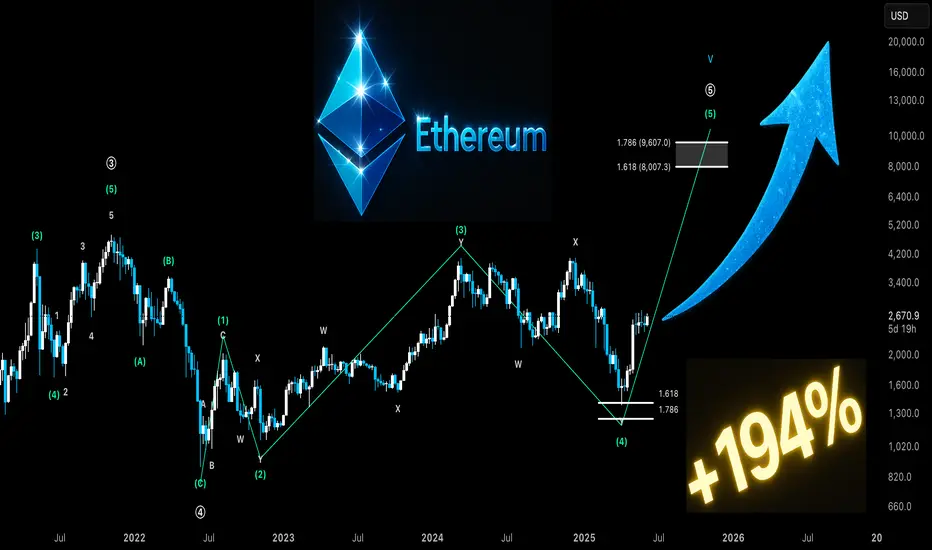
ETH: Ethereum’s Next Big Move! Stablecoin SuperCycle Part 2Ethereum has been moving in 3 wave corrective structures this entire bull market, possibly in an ending diagonal structure. Wave 4 (Green) most likely unfolded as a WXY Double Zig bottoming at the 1.618-1.786 trend based fib extension. Focusing on Wave 5 (Green), a common target of Wave 5 (Green) is the 1.618 to 1.786 fibbonaci retracement between $8,007 and $9,607.
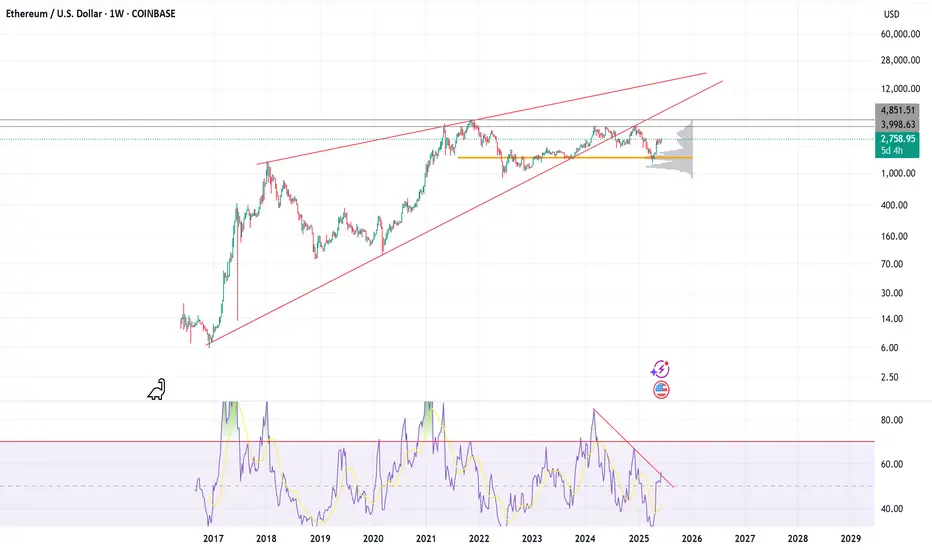
Weekly RSI Breakout Could Signal Ethereum's Bullish ContinuationEthereum (ETH) is approaching a major technical inflection point on the weekly chart. The price continues to respect a long-term ascending channel that has defined its macro trend since early market cycles. ETH is now testing the upper boundary of this channel, coinciding with macro resistance around the $3,000 area.
Meanwhile, the weekly RSI is also nearing a crucial descending trendline that has historically marked momentum exhaustion. A breakout above this RSI resistance would indicate a shift in underlying market strength, and could trigger bullish continuation toward $3,500–$4,000.
However, failure to break this RSI resistance — especially combined with the current bearish divergence between price and RSI — may signal an upcoming correction or a phase of consolidation before any major breakout occurs.
🔍 Key Technical Highlights:
Price nearing upper channel resistance
Bearish divergence present on the RSI
Weekly RSI testing descending trendline
Volume profile shows thin liquidity above current levels
Conclusion:
ETH is at a decision point. A confirmed RSI breakout could validate further upside, while rejection from this level may lead to a short- to mid-term pullback. Monitor RSI closely on the weekly chart — it may dictate Ethereum's next major move.
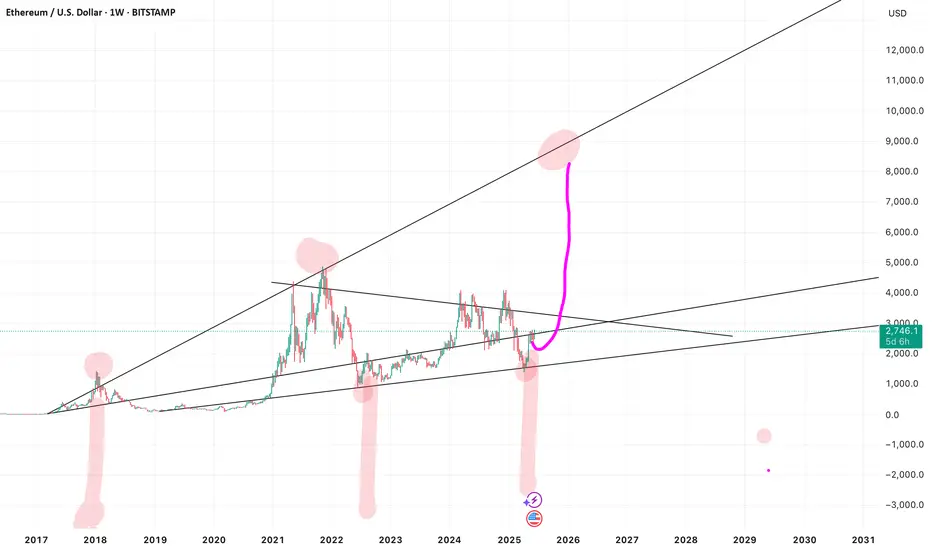
ETH Has Followed an 8+ Year Macro Chart — Why Wouldn’t It Again?Ethereum has respected this long-term trend structure for over 8 years.
Each major breakout, consolidation, and correction aligns almost perfectly with this macro pattern. Every time the crowd calls it dead, it coils, breaks out, and shocks everyone.
We’re now sitting at a familiar inflection point — just like in 2016 and again in 2020.
So ask yourself:
Why wouldn’t history repeat?
Why wouldn’t ETH make its next move from here?
Markets may change, but human behavior doesn’t. And this chart? It’s been whispering the same story for nearly a decade.
Don’t fade the cycle. 🔄
Ethereum sooner or later + $10kEthereum overdue major run will be there sooner or later and my expectation of + $10k for the local peak has not changed

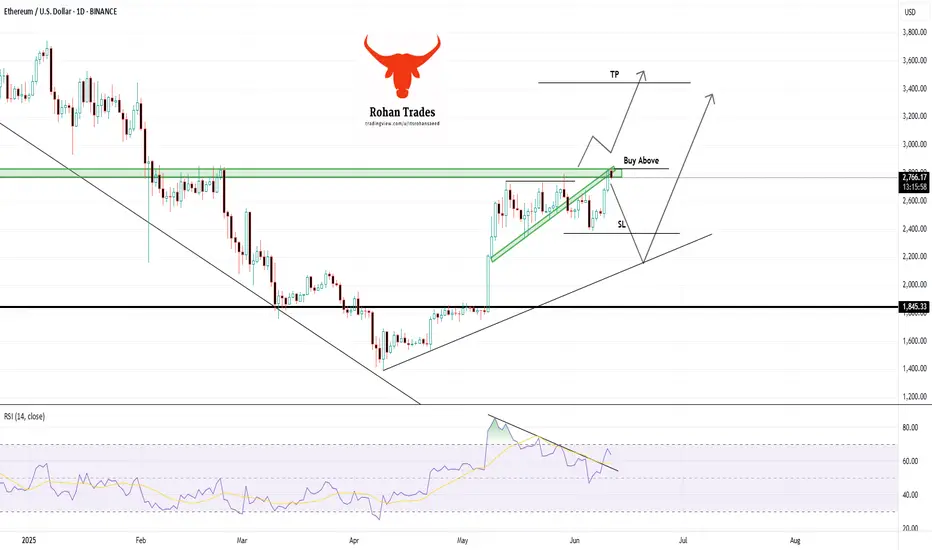
ETH/USDT – Bullish Setup UnfoldingEthereum has broken a key market structure, confirming bullish momentum. After the structure break, we saw a clean retest on our order flow level, signaling strong buyer interest.
Current Outlook:
📈 ETH is showing solid bullish continuation signs
📊 Higher highs and higher lows forming
🔁 Retest confirmation adds confluence
📍Key levels:
💡 My Strategy: Adding to long positions. As long as ETH holds above the retest zone, upside potential remains strong. I’m targeting the next major resistance zone.

#Eth/usd retest on daily timeframe Price break the privious high with a good volume. And make retest on the privious high. If price give a pullback than you make a long trade on this
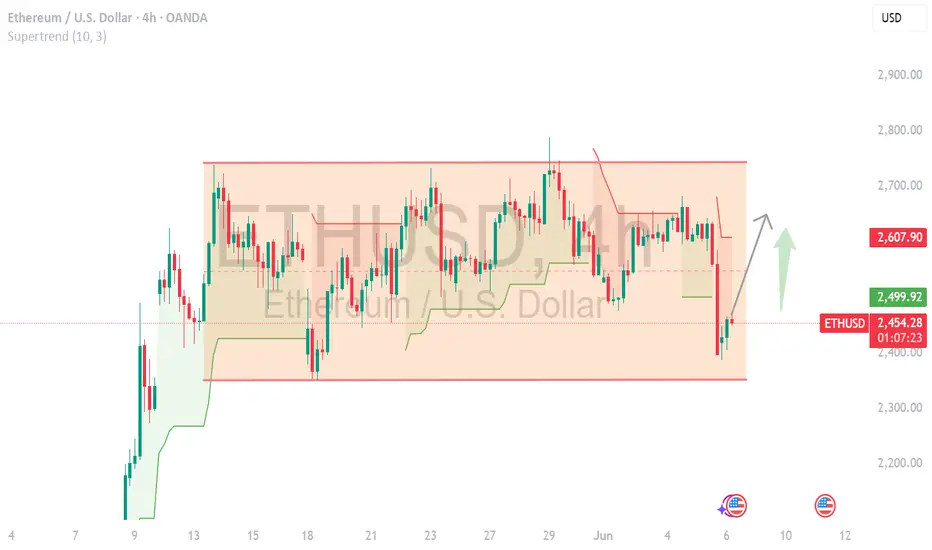
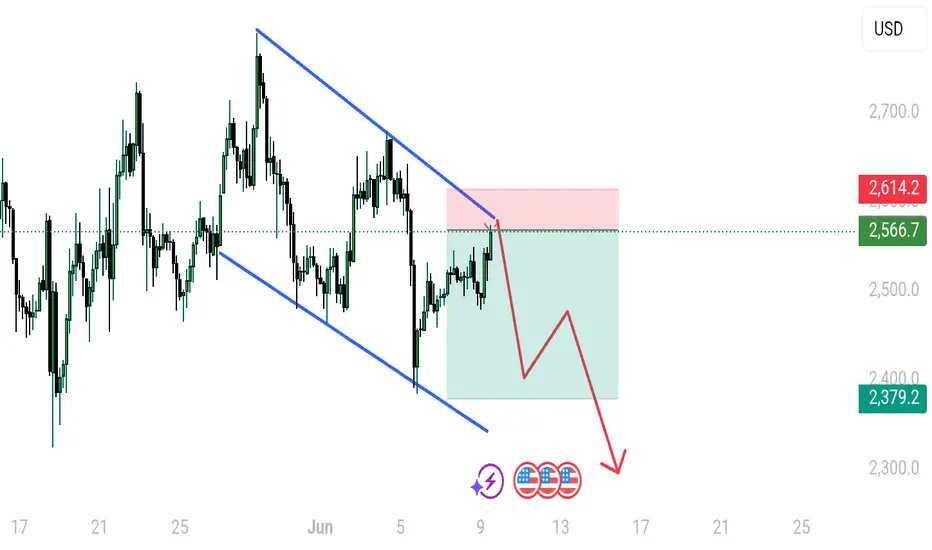
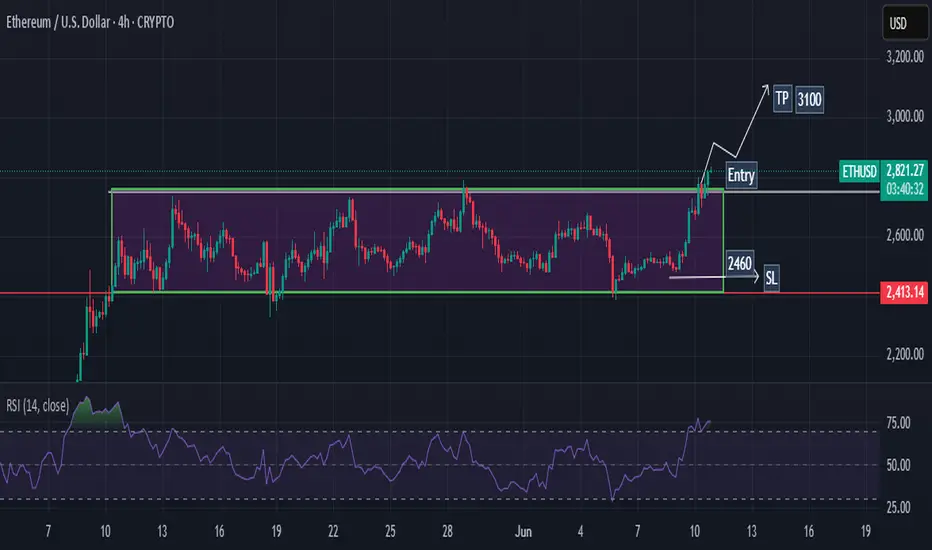
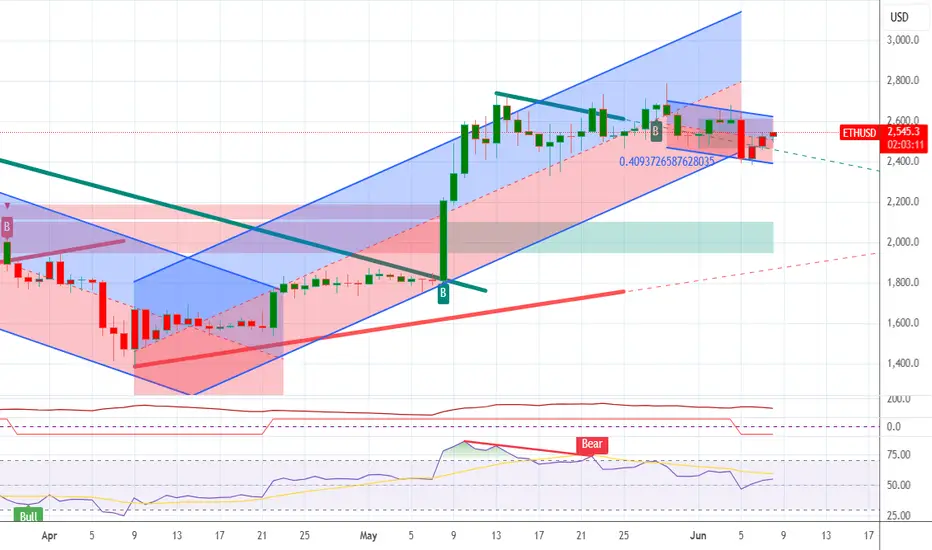
ETHUSD next move ETHUSD – 4H Chart Analysis
Structure: Downward Parallel Channel
Market Behavior: Price is respecting both support and resistance levels within the channel
Current Position: Price is testing the upper boundary / resistance zone
📉 Sell Bias – Potential rejection from resistance zone
Entry: 2559
Stop Loss: 2614
Target: 2379
ETHUSDT. Horizontal and Trendline ResistanceStrong weekly horizontal and trendline resistance
breakout is pending and closing with strong volumes
Bearish divergence on 1W TF is still intact
Watch 2800 level closely and beware of bull traps
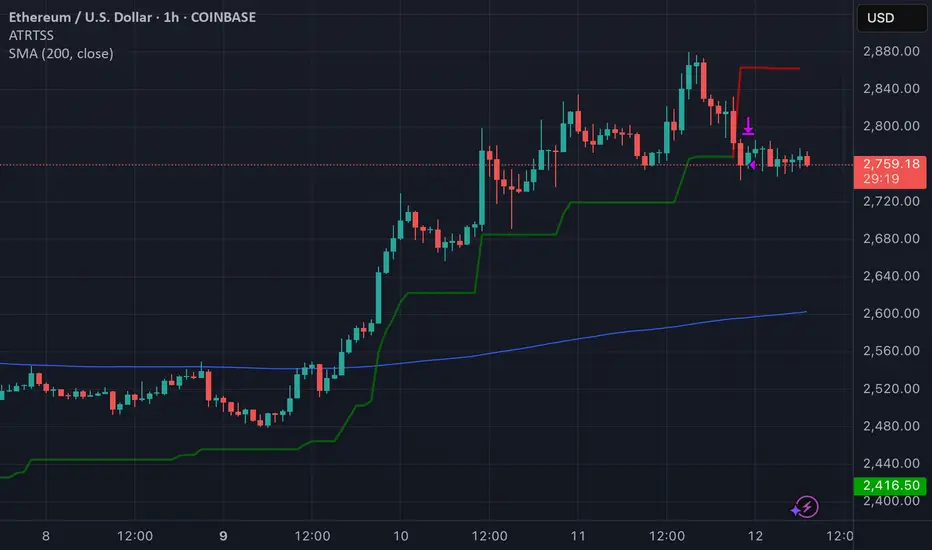
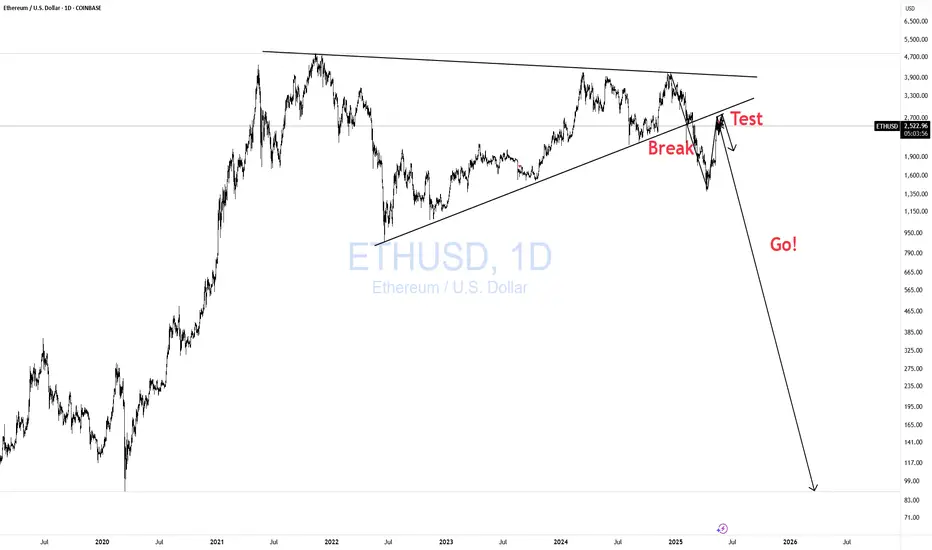
ETHUSD Break- Test- GO!!! Nothing Changed!I have to repost this bc TV only gives me limited updates before it forces "target reached." Here is my previous post.
Nothing has changed. Just as I expected. If anything, it looks even more bearish now. As always, wait for the hook!
Click Boost, and follow Let's get top 5,000!
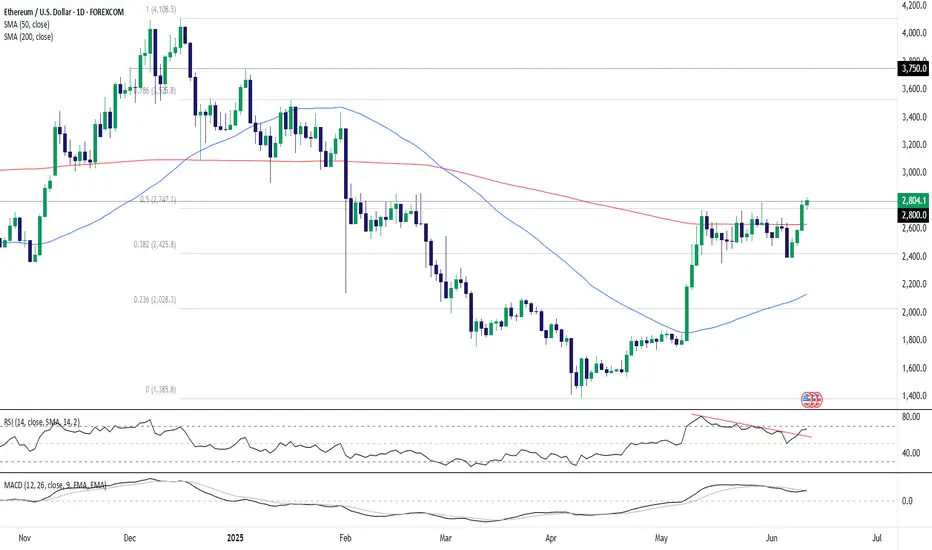
ETH Bulls Back in Play Above $2800ETH/USD has pushed above $2800, a key level it has done significant work either side of going back to 2022. Having broken above the important 200-day moving average earlier this week, and with indicators like RSI (14) and MACD pointing to growing topside momentum, a close above $2800 may encourage other bulls to join in the run higher.
If the price can hold $2800, longs could be established above the level with a stop below for protection. The price action around $2800 during February reinforces the need to see the breakout stick before entering the trade.
$3000 screens as a potential target, as does $3525—the 78.6% retracement of the December–April bear move. Beyond, $3750 was tagged on multiple occasions late last year, making it another possibility before the record highs come into view.
If the price is unable to stick the $2800 break, the setup would be invalidated.
Good luck!
DS
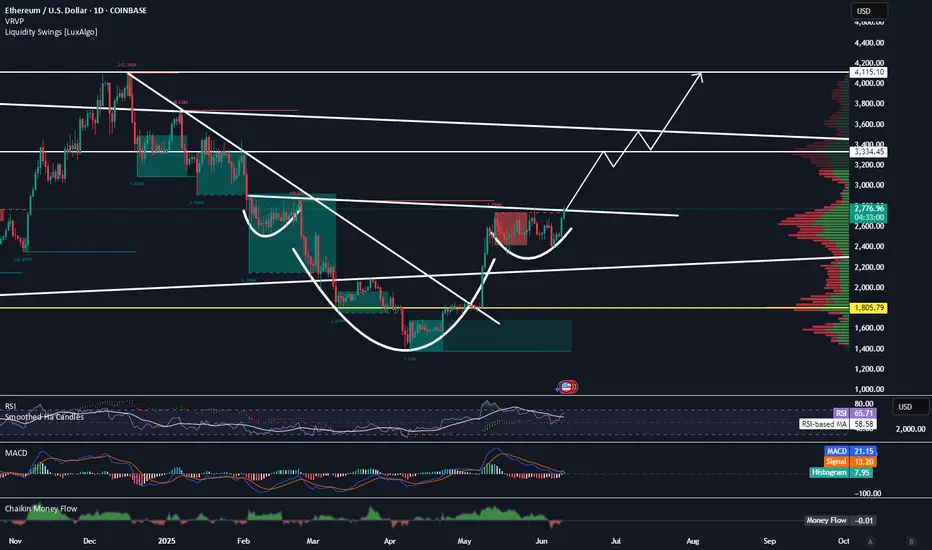
Ethereum Is About to Start Making Its Move to $4100Trading Fam,
Lot's of good patterns occurring on the crypto charts recently, Ethereum is no exception. Here you can see a valid inverse head and shoulders pattern has formed. 85% of the time, these patterns play out.
If we do break that neckline to the upside, I would suggest that $4100 will come fairly quickly. We do have a few resistance areas ahead of us where I expect some pause. But this will only give the market enough time to recognize they may be missing the rocket ride and hop in.
If we don't break that neckline this week, we could pull back for another week. But I think by the end of June our neckline will break and we'll be on our way.
Best,
Stew
Weekly trading plan for EthereumEthereum continues its growth and has already updated the local top at $2,791. Above the current price is an important resistance zone and after its breakdown it will be possible to see the price above 3k
Write a comment with your coins & hit the like button and I will make an analysis for you
The author's opinion may differ from yours,
Consider your risks.
Wish you successful trades ! mura

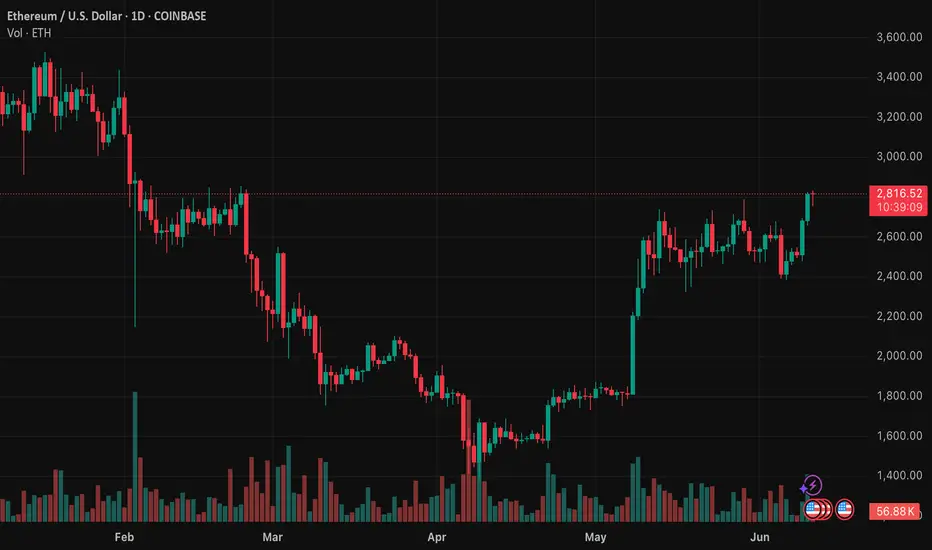
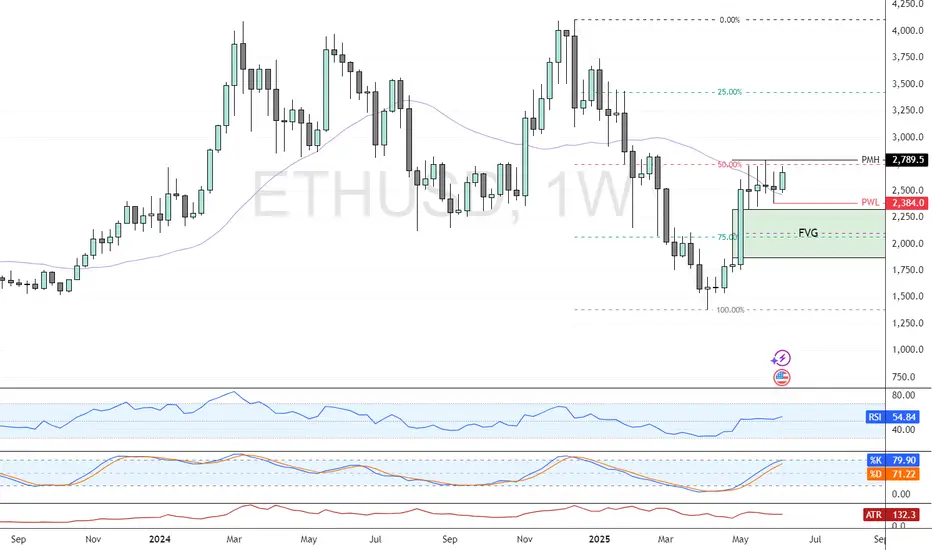
Ethereum Near Monthly HighFenzoFx—Ethereum trades near $2,790, aligning with its monthly high and the 50.0% retracement level. A wide Fair Value Gap could act as a price magnet, while bearish candlestick wicks signal selling pressure.
Stochastic at 79 nears overbought territory, suggesting a potential bearish wave if $2,790 resistance holds. A drop below $2,100 could align with the Fair Value Gap.
The bearish outlook is invalidated if ETH closes above $2,790.
>>> Trade ETH swap free at FenzoFx.
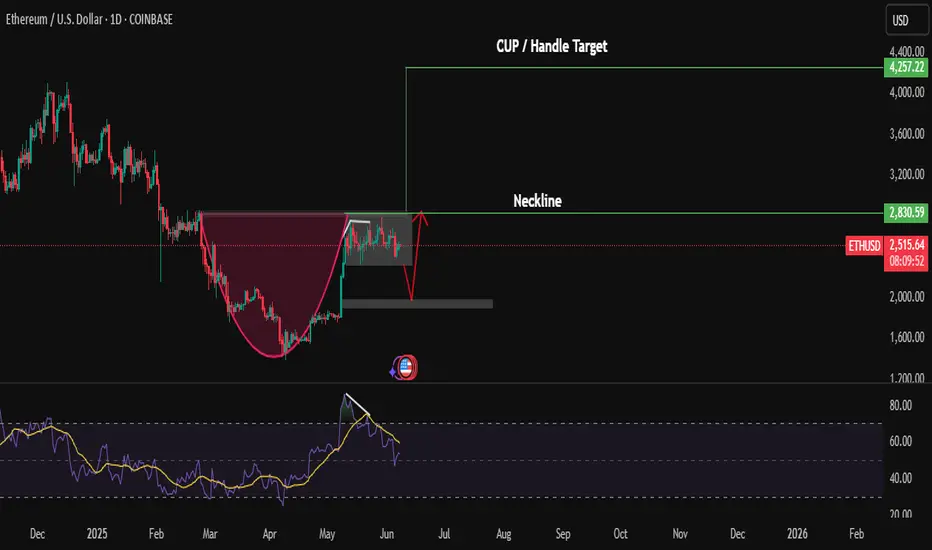
ETHUSD ETHUSD DTF analysis
cup/handle pattern formed
Bearish divergence formed also price moving in a consolidation box
wait for the breakout of neckline if breaks price will go up otherwise will come for retracement
then can take entry
wait and watch condition for new buying
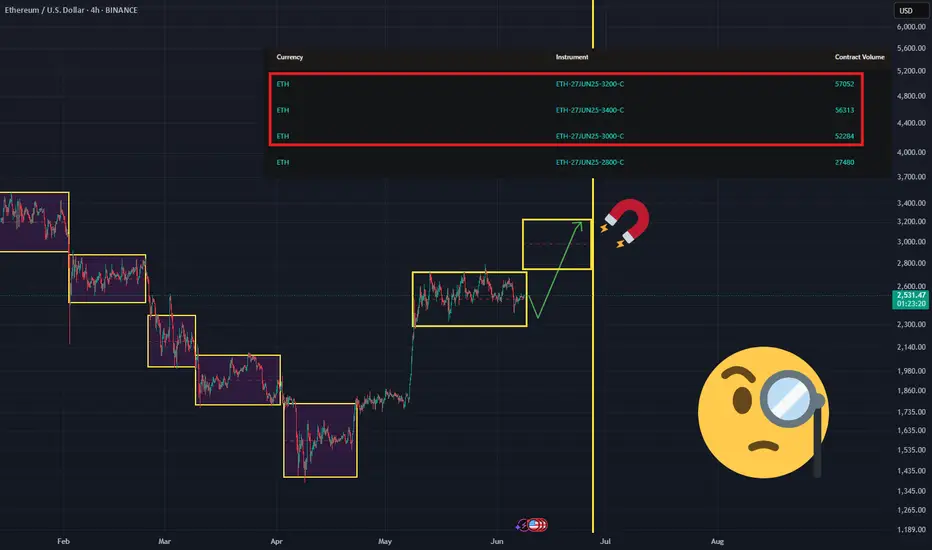
Once It Starts, It Might Be Too Late to Jump InHey guys, vacation’s over — time to get back behind the screen and into the reports. Naturally, I kicked things off with a deep dive into ETH options activity , because that’s where the real market whispers come from.
Here’s what stood out:
Over the past week, the biggest trading volume and open interest inflow came at strikes $3000–$3200–$3400 (see screenshot). Most of the action was in standalone calls , though a portion showed up as call spreads — meaning some players are betting on a controlled rally, not just blind bullishness.
The June 27, 2025 expiry remains the clear leader in open interest — still the date everyone’s watching.
With implied volatility at 67.9% , ETH has about a 68% probability (1σ) of reaching $2,950 by expiry — just 18 days away .
Key Takeaways:
$3000–$3200 looks totally within reach.
$3400 , though? Less than 15% chance based on current levels.
The sentiment among options traders is clearly bullish — they’re positioning for a breakout up from the sideways range, roughly by the full width of the pattern.