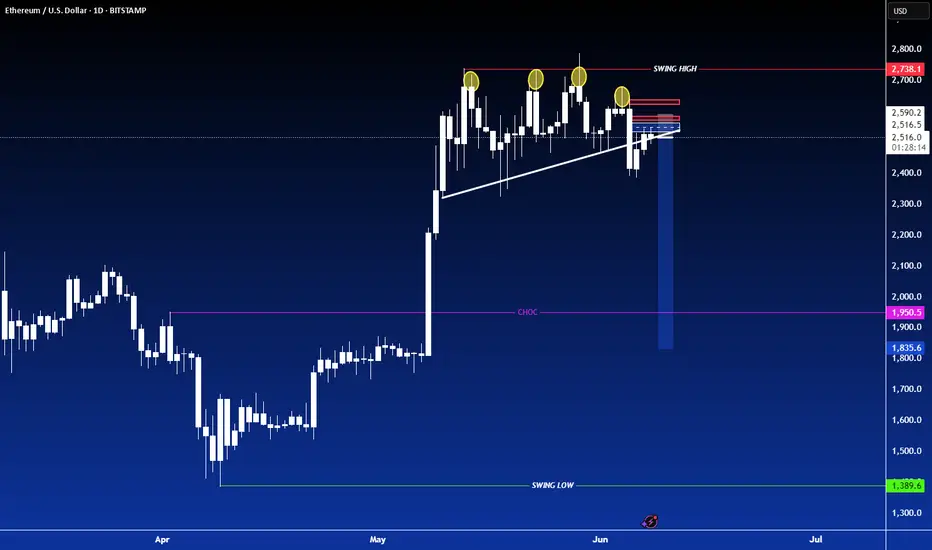
Ethereum set for breakout? Watch this 27-day patternEthereum is forming a 27-day pattern that could trigger a major breakout. After last week's failed move in Bitcoin, Ethereum now sits at a critical level. A breakout above 2741 could signal the start of a big rally, especially if US deregulation news lands. Could this be the beginning of a big move? Watch the full analysis and share your thoughts in the comments.
This content is not directed to residents of the EU or UK. Any opinions, news, research, analyses, prices or other information contained on this website is provided as general market commentary and does not constitute investment advice. ThinkMarkets will not accept liability for any loss or damage including, without limitation, to any loss of profit which may arise directly or indirectly from use of or reliance on such information.
ETHUSD.P trade ideas

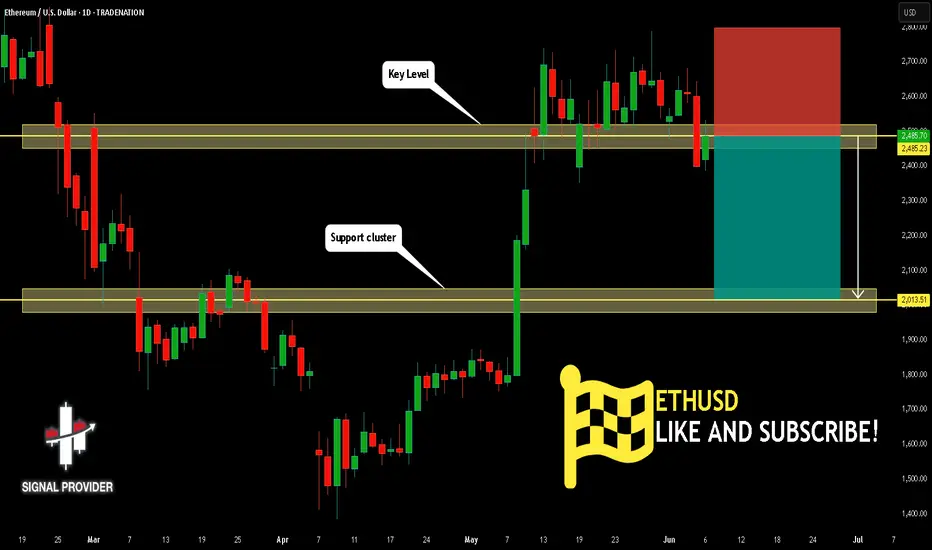
ETHUSD Is Going Down! Sell!
Here is our detailed technical review for ETHUSD.
Time Frame: 1D
Current Trend: Bearish
Sentiment: Overbought (based on 7-period RSI)
Forecast: Bearish
The market is trading around a solid horizontal structure 2,485.23.
The above observations make me that the market will inevitably achieve 2,013.51 level.
P.S
We determine oversold/overbought condition with RSI indicator.
When it drops below 30 - the market is considered to be oversold.
When it bounces above 70 - the market is considered to be overbought.
Disclosure: I am part of Trade Nation's Influencer program and receive a monthly fee for using their TradingView charts in my analysis.
Like and subscribe and comment my ideas if you enjoy them!
ETH: USD & Stablecoins are ALLIES | Stablecoin SuperCycle Part 2Video Timestamps:
0:00 U.S. Dollar & Stablecoins are now BEST FRIENDS
3:28 Ethereum DOMINATES Stablecoin Market!
4:00 Ethereum Risk & Regression Analysis
5:58 Hong Kong to use Chainlink protocol in CBDC pilot project
7:34 Ethereum Elliott Wave Count + Fibbonaci Work + Bull Market Price Targets

15 R:R setup for EthereumWe assume that this marks the beginning of a new uptrend for BTC. This setup offers an easy 15:1 risk-to-reward ratio.
Entry: 2534
Stop Loss: 2373.33
Target: 5000
This is for educational purposes only.
High-Probability ETH Swing Trade Setup with 3.5:1 Risk-Reward Ethereum Swing Trade Setup with a 3.5 Risk-Reward Ratio —
Entry at $2,756
Stop Loss at $2,604
Target at $3,300.
This is for educational purposes only.

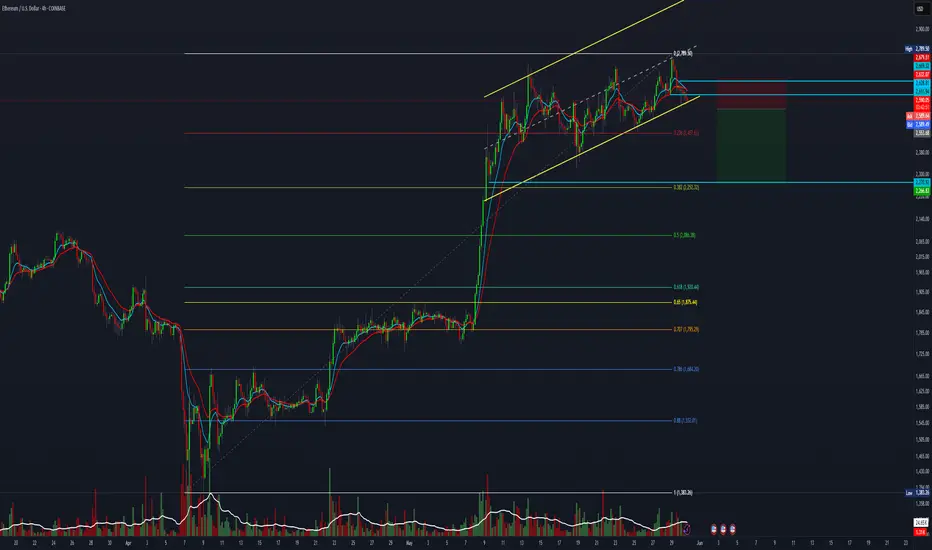
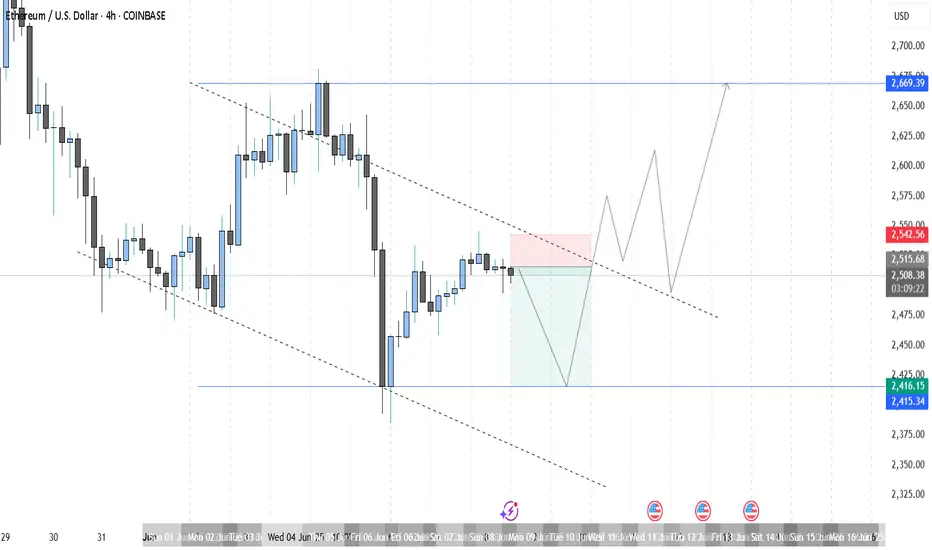
Ethereum Swing Trade: Short Setup with 2.2 R:R PotentialEthereum is approaching a potential breakdown from its current channel. A short swing trade setup with a 2.2 risk-to-reward ratio is forming. Wait for a confirmed break below the channel before entering.
Entry: $2,553
Stop Loss: $2,680
Target: $2,266
This is for educational purposes only.
Bitcoin dominance continues its upward movementBitcoin dominance continues its upward movement. We can expect some relief starting next week.Bitcoin can break and hold above the $108,000 level.Bitcoin target this week is $120000

SHORT ON ETHEREUM ETH/USDEthereum has created a lower high after a triple top and is currently looking very bearish.
Huge imbalance to the downside to be filled.
I will be selling eth to the next demand level looking to catch over 500-600 points.
ETHEREUM is stacking up to fly! BINANCE:ETHUSDT ETHEREUM got a lot going for it right now. It's the backbone of a huge chunk of the crypto world, especially with all the DeFi and NFT stuff happening. Plus, there's always talk about big upgrades that could make it even better.
Right now, Ethereum's trading around $2,500, but some experts expect that it could climb way higher, maybe even past $8,000, if everything goes right.
That aside, I personally think $5,000 is achievable and to happen soon. It clearly broke out of the months long downtrend channel and with momentum. There's a lot of hate for ETH just for being expensive. But, let's be real, is not the 2nd biggest player in the market for nothing.
Let me know what you think? Open to counter ideas!
BINANCE:ETHUSDT

Eth Pull back, looking for longs.
Retesting the 0.05 Fib aligned with the 200EMA, Short to support and look for longs on sweep of support.
ETHUSD SELLSETHUSD is travelling in a bullish channel however, I am expecting price to sweep low before possibly moving up. 2416 is the sell target
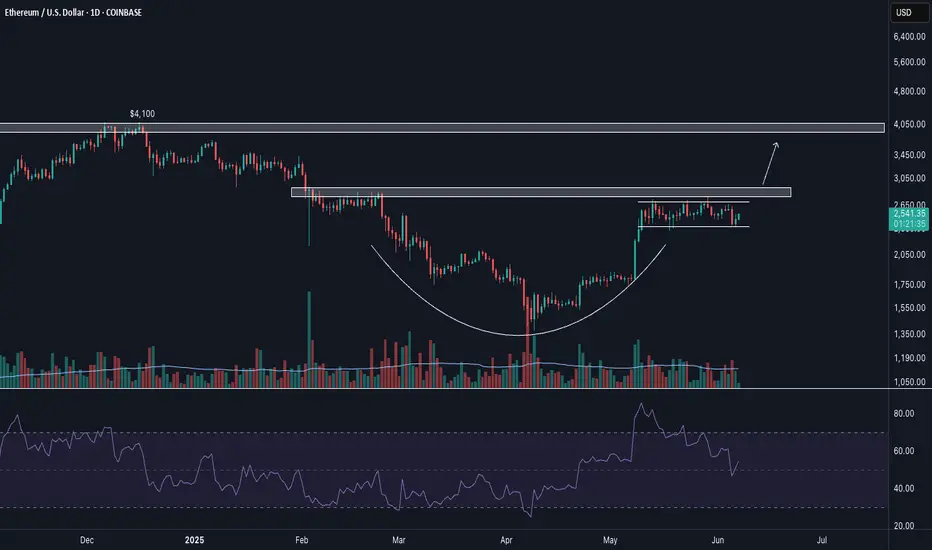
Cup w/ HandleFour week handle forming. Looks ready to go for a breakout for the ATHs shortly. RSI reset
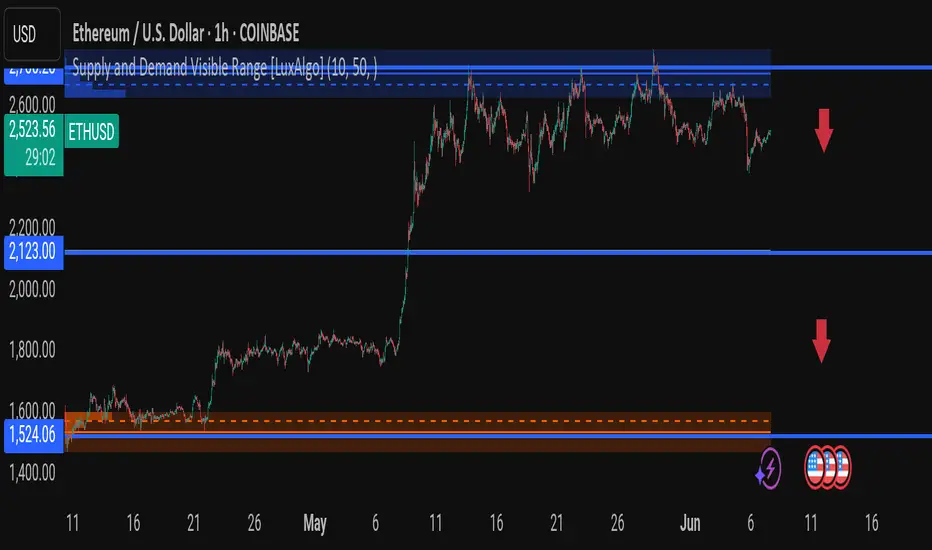
ETHUSD 1H – Supply Zone Rejection! Will Ethereum Retest $2,100 Ethereum is currently trading at $2,524, just below the critical supply zone between $2,560 – $2,600, where price has been repeatedly rejected. The bulls are showing signs of exhaustion – is a deeper correction on the horizon?
🔵 Major Technical Zones:
🔹 Resistance (Sell Zone): $2,560 – $2,600
🔹 Mid Support: $2,123
🔹 Key Demand Zone: $1,524 – $1,600 (High-Volume Buy Area)
📉 Bearish Scenario (Likely if rejection holds):
A failure to break above $2,600 could lead to a breakdown toward $2,123.
If $2,123 doesn’t hold, $1,524 is the next target — a zone with historical demand and a previous breakout base.
🧠 Volume Profile Insight:
Notice how volume increases around $1,524, indicating strong buyer interest in this zone. The space between $2,100 and $1,524 is thin — expect fast movement if $2,100 cracks.
📆 Key Dates:
Economic events marked on the chart (June 11–16) could act as catalysts for volatility.
---
💬 Do you think ETH will break above the supply or is this the calm before the drop? Share your analysis below!
#Ethereum #ETHUSD #CryptoAnalysis #PriceAction #SupplyDemand #LuxAlgo #SmartMoney #TradingView
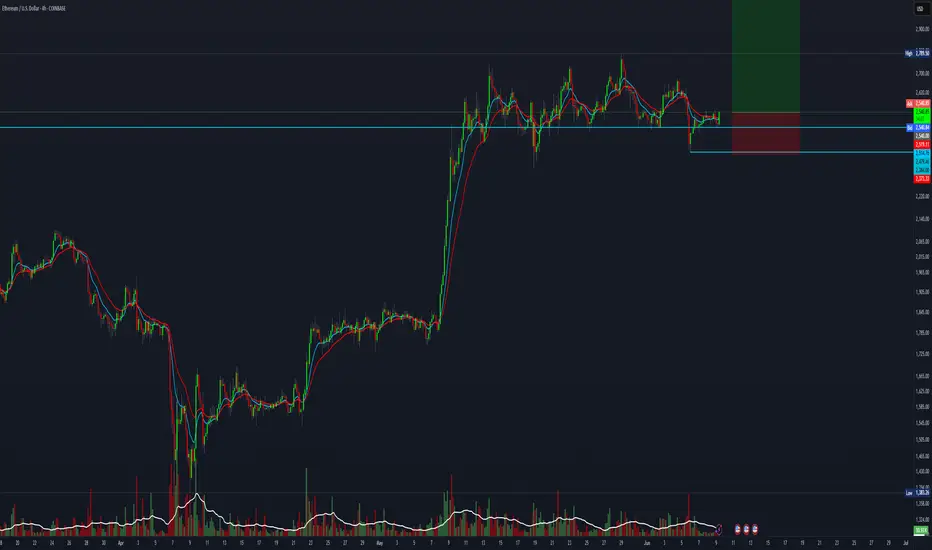
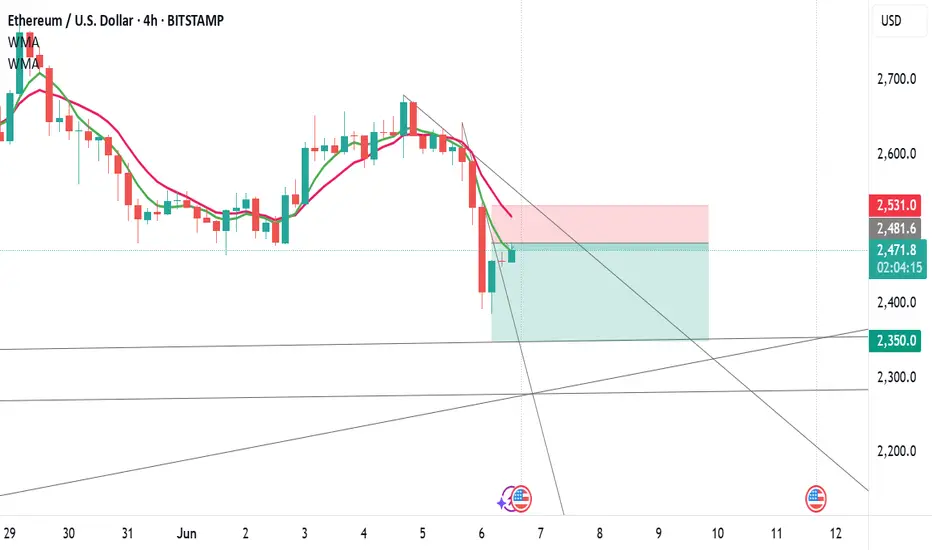
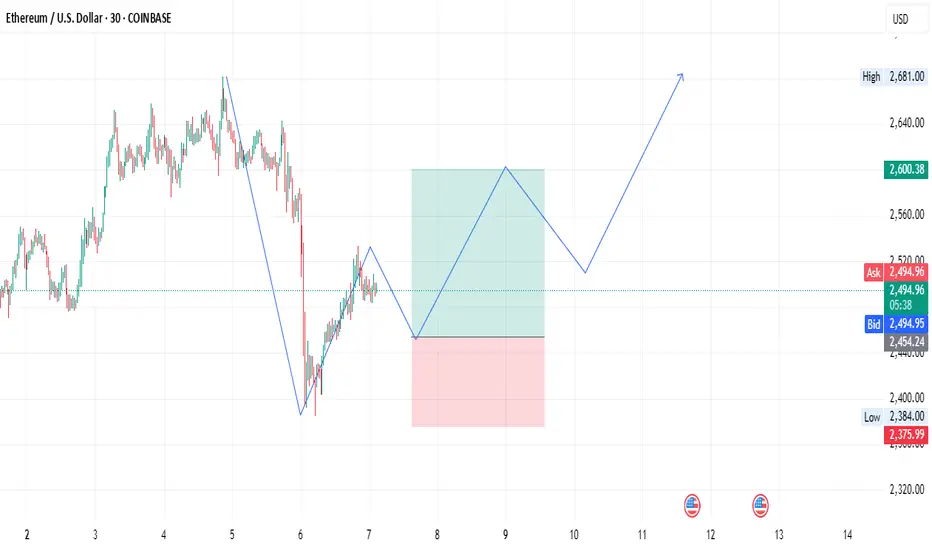
ETH/USD Long Setup – Bullish Reversal in Play📅 Date: June 7, 2025
⏱ Timeframe: 30-Minute (COINBASE)
📊 Pair: Ethereum / U.S. Dollar (ETH/USD)
💡 Trade Idea Summary:
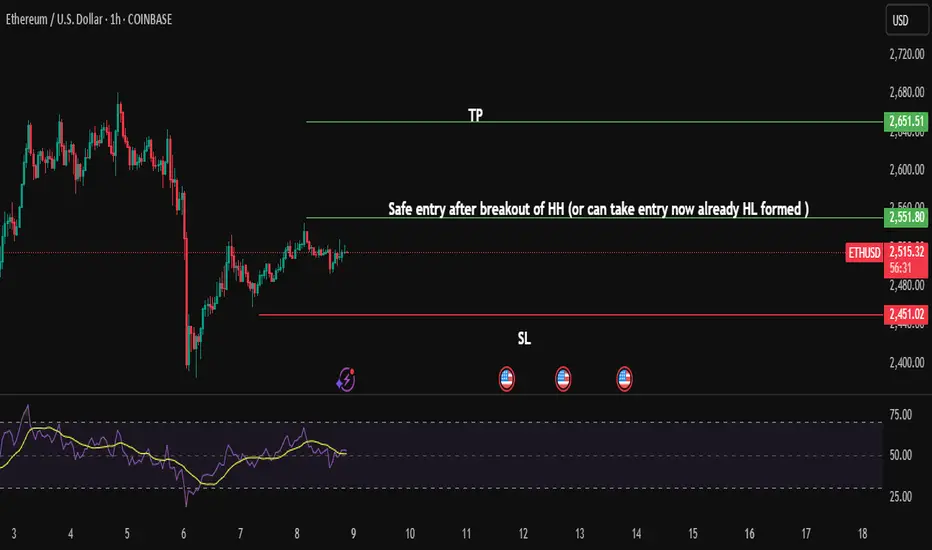
Ethereum is showing signs of a bullish reversal after a strong corrective move. Price has formed a potential higher low structure and is preparing for a bullish continuation.
🔹 Entry: $2,454
🎯 Target: $2,600
🛡️ Stop Loss: $2,376
⚖️ Risk-Reward Ratio: ~1.9:1
📈 Technical View:
Recent downtrend appears exhausted with a clear bounce from the $2,384 zone.
Break of lower highs indicates shift in momentum.
Expecting a short-term dip to retest the higher low before continuation towards $2,600.
Ideal for swing traders or short-term bullish setups.
📌 Trade Management Tips:
Watch for bullish confirmation near $2,454 before full entry.
Trail stop if price breaks above $2,520 for risk reduction.
Avoid the trade if price closes below $2,376 on the 30m chart.
🔔 Disclaimer: Not financial advice. Always do your own research and manage risk appropriately.
eth thoughtsIm looking at charts and just randomly trying to see thing that may line up with a theory that the cycle maybe over.
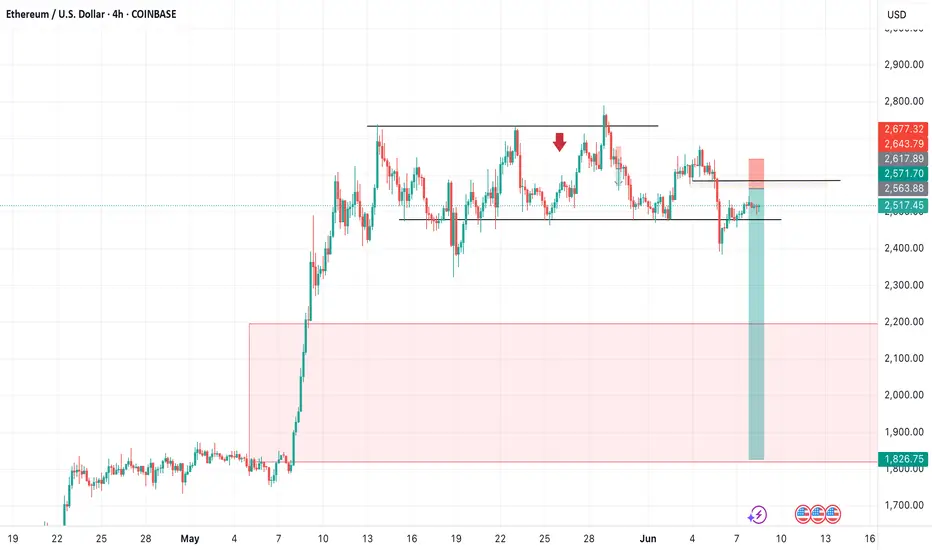
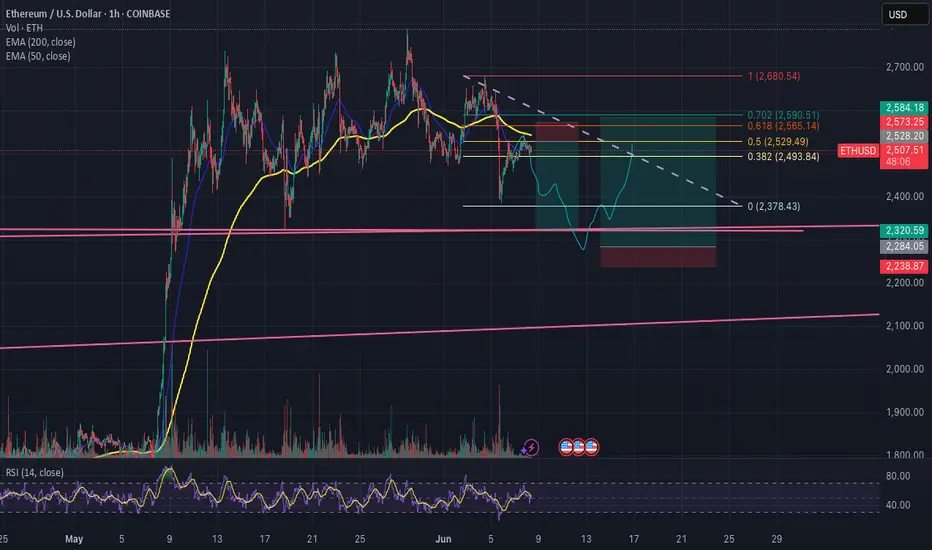
ETHUSD Breakdown Alert – Potential for Strong Bearish Move BelowEthereum (ETHUSD) is showing signs of weakness after multiple rejections from the resistance near 2553. The price is now consolidating just above the critical support zone around 2400, highlighted by the pink shaded area. This zone has historically acted as a strong demand area, but with repeated testing, its strength appears to be fading.
A breakdown below this zone may trigger a significant bearish move, targeting deeper levels in the coming sessions.
---
🔍 Technical Analysis:
Price Structure: ETH has been in a sideways consolidation phase between 2553 and 2400. Each bounce from support has shown diminishing bullish strength.
Volume: Declining buy volume near resistance, and increasing sell pressure near the support area, indicate potential for a breakdown.
Momentum: Lower highs and weak bullish candles suggest bears are gradually gaining control.
Trend Outlook: Bearish bias remains as long as price stays below 2553, with a strong breakdown likely below 2400.
---
📌 Key Levels:
Major Resistance: 2553
Immediate Support: 2400 (Critical Zone)
Bearish Targets:
TP1: 2215.1
TP2: 1967.4
TP3: 1775.3
---
⚠️ Trade Plan:
Sell Setup: Wait for a 4H candle to close below 2400 for confirmation.
Stop Loss: Above 2553 (resistance zone).
Risk Management: Use proper lot sizing and risk-to-reward ratio of at least 1:2.
Note: Avoid early entries without confirmation to prevent false breakouts.

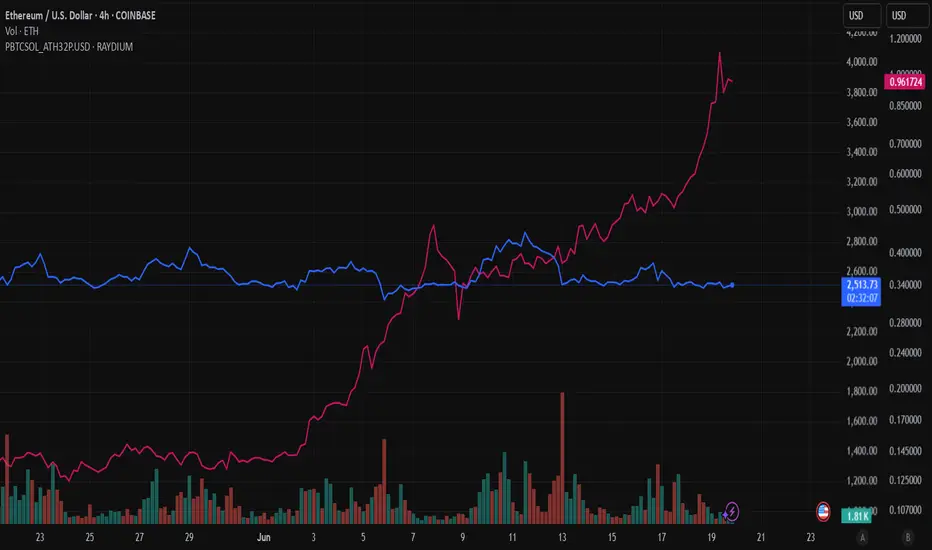
PBTC vs ETHA visual comparison of Purple Bitcoin (PBTC) and Ethereum (ETH) trends, powered by the Purple Bitcoin Compare Bot.
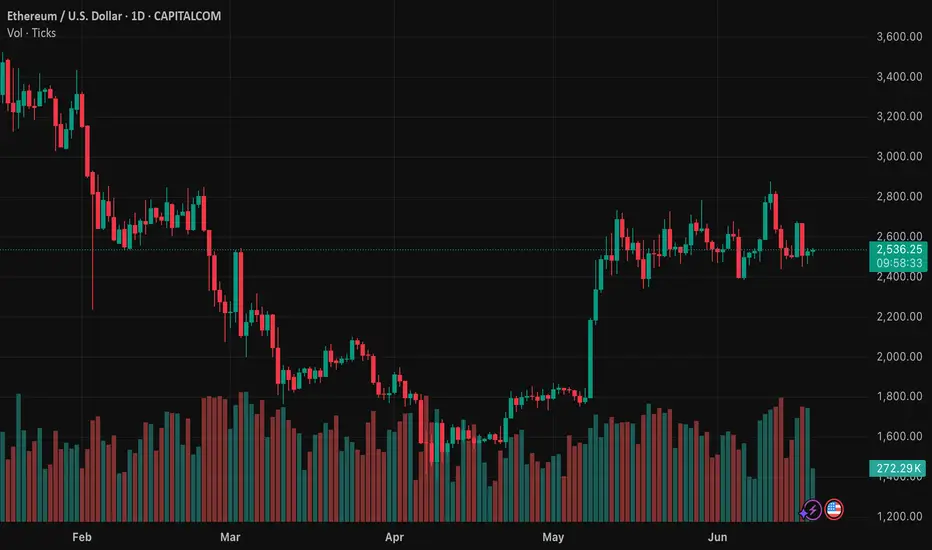
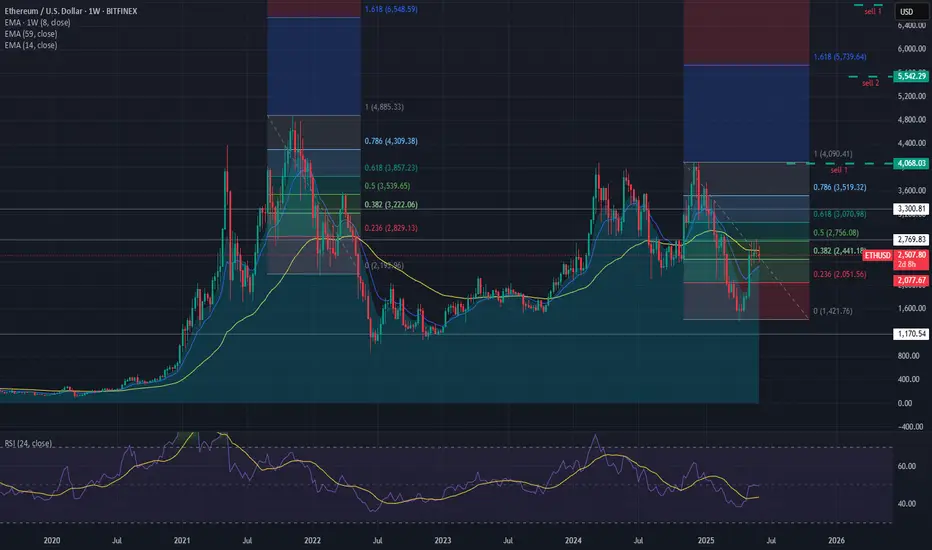
Detailed technical analysis of the ETH/USD chart🧭 General Context (1D, Long-Term):
The chart covers the period from approximately September 2023 to June 2025.
ETH/USD has gone through a complete cycle: growth → decline → correction → potential consolidation/accumulation.
🔹 Market Structure (Price Action)
🔸 Trends:
November 2023 – March 2024: strong uptrend, ETH reaches highs around $4,000+
March 2024 – February 2025: clear downtrend ending with a local low around $1,600
February 2025 – May 2025: dynamic rebound – probable trend change (new higher low + higher high)
May – June 2025: currently consolidating between ~$2,400–2,800
📉 Key Support and Resistance Levels
Type Level Notes
🔴 Resistance ~2,800 – 2,900 Local high, many candles with shadows rejected from above
🟡 Resistance ~3,200 – 3,400 Beginning of strong declines from 2024
🟢 Support ~2,300 – 2,400 Local lows in June 2025
🟢 Strong support ~1,600 – 1,800 Final market low of March 2025 (possible accumulation phase)
📊 Technical indicators
✅ Stochastic RSI (at the bottom of the chart):
Currently in the oversold zone (~0–20) → may signal a potential bottom / buying opportunity
Red-blue lines are starting to wrap upwards → possible rebound
Recent crossovers of the indicator corresponded to local price movements
🔍 Technical formations
⚠️ Possible formations:
Double Bottom: February–March 2025 → classic trend reversal formation
Rising Channel: from March 2025 to present – prices are moving in a slightly rising channel
Current consolidation may be a bull flag (continuation after the increase)
📌 Summary – scenarios
🟢 Bullish scenario:
Breakout of resistance ~2,800 → possible test of levels 3,200 – 3,400 USD
Confirmation of a higher low → continuation of the uptrend
Stochastic RSI in the oversold zone → potential for an uptrend
🔴 Bearish scenario:
Drop below 2,300 USD → possible return to the area of 1,800–1,600 USD
Breakout of the structure of higher lows
Confirmation that the increase was only a correction
🧠 Final conclusions
Currently, ETH/USD is in a key decision zone: after a strong rebound, the market is resting.
Stochastic RSI suggests a potential upside impulse, but requires confirmation by a breakout of resistance.
For traders: 2,800 (resistance) and 2,300 (support) are worth watching.
For investors: 1,600–1,800 could be considered a long-term accumulation zone.

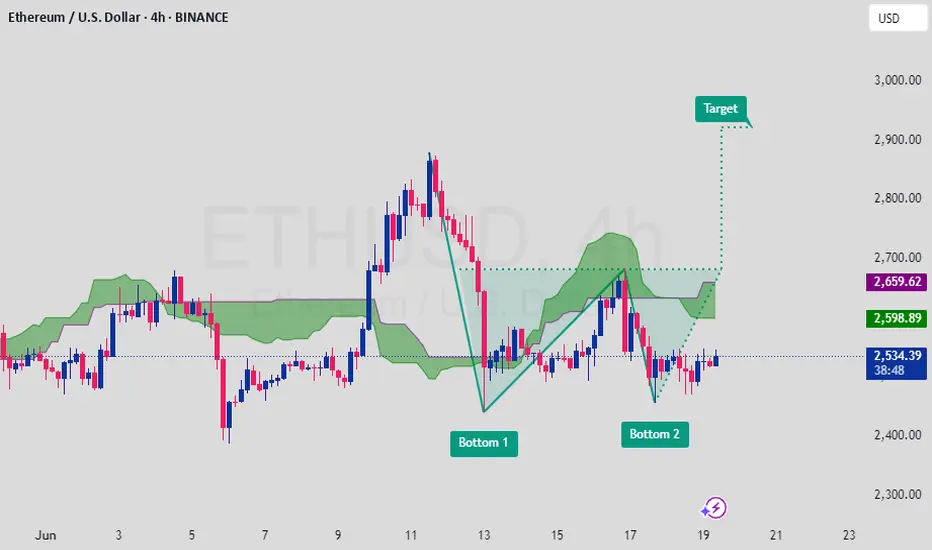
ETHUSD Double Bottom Formation SignalsBullish Reversal PotentialEthereum (ETH) is forming a Double Bottom pattern on the 4H chart, a classic bullish reversal setup. Price is attempting to hold above the neckline and Ichimoku cloud support, indicating momentum may shift upward toward the next resistance zone.
🔹 Pattern: Double Bottom
🔹 Current Price: ~$2,533
🔹 Breakout Confirmation Level: ~$2,598
🔹 Target: ~$2,900 based on measured move
🔹 Technical Outlook: Price holding above key support and eyeing breakout
🔹 Fundamentals: Improved market sentiment, ETH ETF buzz, and network upgrade expectations support upside
Bullish scenario developing – confirmation on breakout above resistance could trigger strong momentum toward target. 📈🚀
Note :If you found this helpful, like and follow for more trade ideas!
Share My Idea With Your Firends Mention Your Feed back Comment Section
This is not financial advice. Please conduct your own research and manage risk accordingly.
ETHUSD is moving within the 2390.00 - 2880.00 range 👀 Possible scenario:
Ethereum dropped to $2,530, down 9.4% on the week, as market uncertainty weighs on momentum. Despite the pullback, over 35 million ETH (worth $89B) is now staked—an all-time high. While accumulation is surging too, with large wallets scooping up 800K+ ETH daily. On June 12 alone, whales bought 871K ETH—the biggest single-day haul this year. Ethereum’s liquid supply is shrinking as staking grows, aided by SEC guidance easing regulatory concerns. Lido, Coinbase, and Binance remain top staking providers.
The Pectra upgrade and Arbitrum’s ArbOS 40 rollout bring key enhancements like account abstraction and better L2 scaling. A golden cross is forming on ETH’s chart, but price remains under pressure amid geopolitical tensions.
✅Support and Resistance Levels
Support level is now located at 2,390.00.
Now, the resistance level is located at 2880.00.