ETHUSD is moving within the 2390.00 - 2670.00 range👀 Possible scenario:
The cryptocurrency market saw a slight decline, with the total market cap dropping 1.9% to $3.41 trillion. Ethereum (ETH) fell by 0.9% to $2,478, slightly down from its intraday high. A third of the top 100 coins posted gains, while trading volume decreased to $71.9 billion. Ethereum has since recovered and is trading around $2,544.
Ethereum's upcoming EthCC 2025 conference (June 30 - July 3) could drive price movements, depending on announcements. However, unmet expectations might lead to a selloff, impacting related tokens. The Ethereum Foundation revealed a new treasury strategy focused on a 2.5-year spending runway, emphasizing transparency and decentralization. The plan aims to protect ETH reserves while utilizing DeFi protocols, guided by a “Defipunk” philosophy centered on decentralization and financial privacy. Ethereum investment products saw $296 million in inflows last week, marking a seven-week streak of positive growth. Meanwhile, Bitcoin-based funds experienced $56.5 million in outflows. Regional inflows were strongest in the U.S., totaling $175 million.
✅Support and Resistance Levels
Support level is now located at 2,390.00.
Now, the resistance level is located at 2,670.00.
ETHUSD.P trade ideas

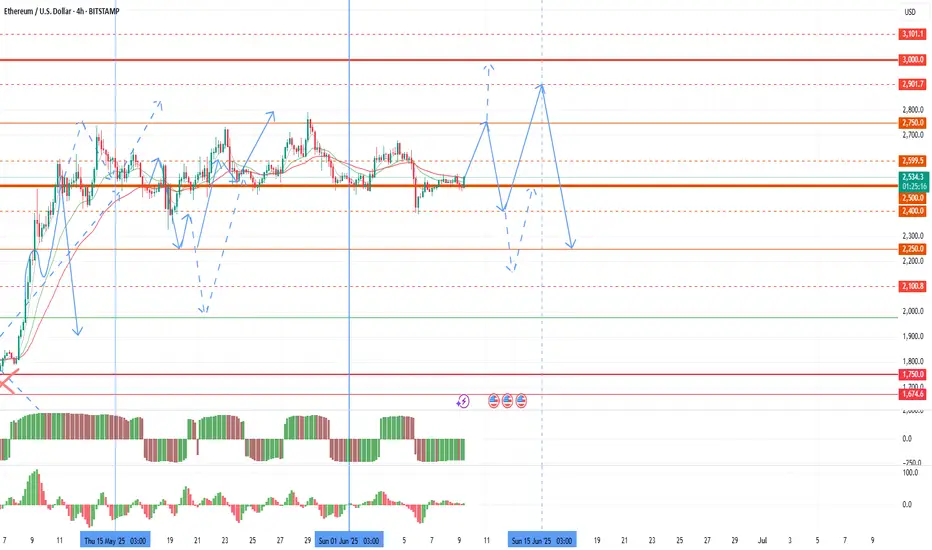
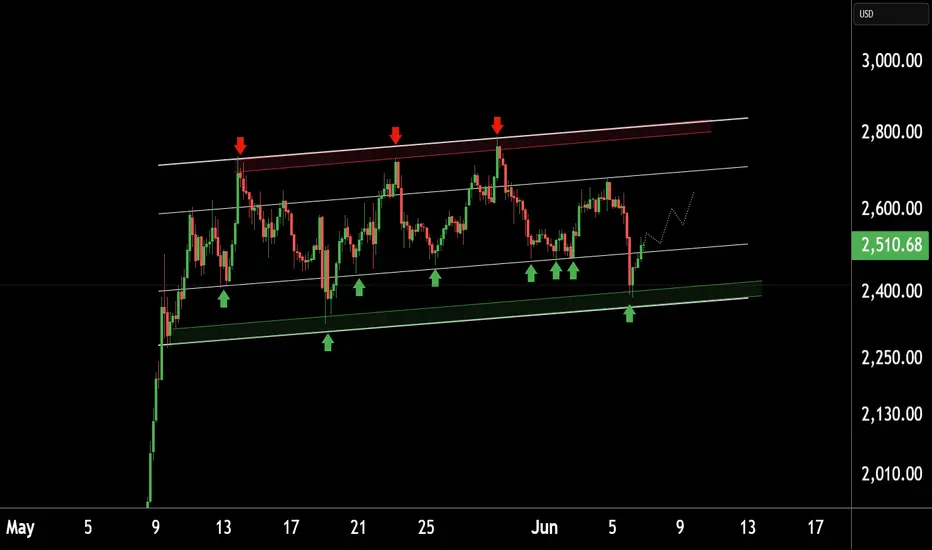
Monthly Candle volatility growthThe market remains extremely sluggish in the seasonal flat, but there is a possibility of increased volatility this week and next. In this regard, I would like to consider the market situation and the likely prospects. First of all, in the medium term, the probability of a flat of about 100k for bitcoin and 2500 for ether prevails until the opening of the new half-year. There are no sufficient arguments for a significant break and trend towards 210k for bitcoin and 5k for ether. In addition, strong statistics for the United States began to be released, which increases the likelihood of a retest of 1900-2100 on ether and 85-90k on bitcoin. That is, until August, I am still more likely to expect a flat of 95-110k and 2250-2750 under an optimistic scenario. With a more negative picture, there remains the possibility of a major drawdown of the market until the retest of the loyalties of the first quarter on the tops.
A significant spike and bullish trend may be facilitated by the cancellation of Trump's duties voluntarily or in court, a truce in Ukraine, or the consolidation of brent above $ 69-70 while maintaining growth. In the event of a resumption of duties or a collapse of oil below $ 60, the probability of a fall in the crypt will become extremely high.
Against the background of the closing of the last bullish monthly candle and above 2500 on ether, we have technical signals for continued purchases. This week, there is a possibility of a major wave of purchases in the first half of the month with an attempt to move. However, strong US statistics are likely to continue to dampen growth attempts. Starting next week, it is worthwhile to carefully consider the volume of positions in the work due to the high probability of a market drawdown in the second half of the month. At the end of the week, I will assess the probability of maintaining purchases in the second half of the month, depending on the statistics released this week and the dynamics of oil.
To date, I am still considering the most oversold coins for scalping that have not been assigned the chess fio adx monitoring tag with possible growth waves of up to 70-100% from current levels. Fan tokens with a growth potential of up to 100-200% remain in a highly undervalued position, among which I work with atm acm city porto Lazio alpine juv. For storing funds in the medium term, quick looks interesting with the main long-term support at 0.020-21. The cos slf data pivx token can also show growth waves of up to 30-40%.
As I wrote earlier, large-cap coins, against the background of a seasonal flat and likely sales, may continue to fall slowly until August, in the absence of major growth in the tops or the index of dominance of altcoins.
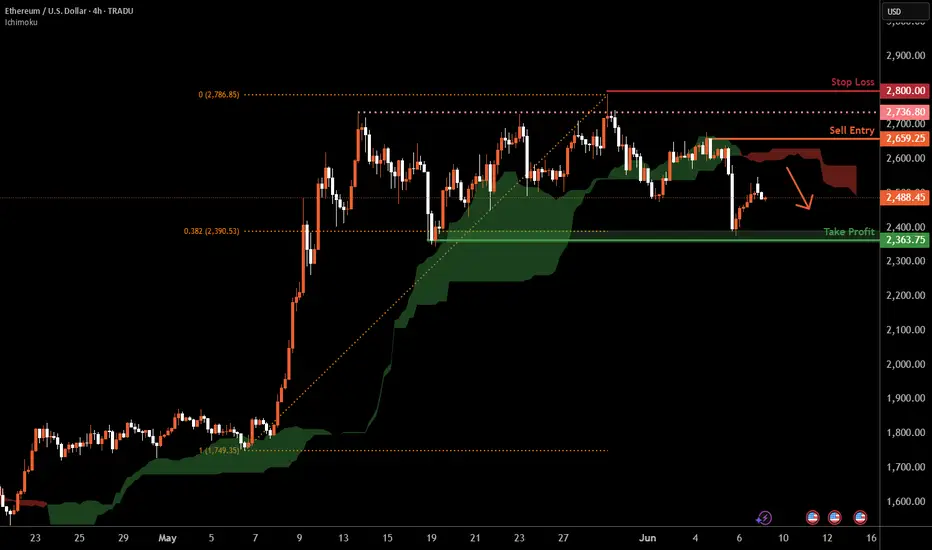
Ethereum H4 | Potential bearish reversalEthereum (ETH/USD) is rising towards a swing-high resistance and could potentially reverse off this level to drop lower.
Sell entry is at 2,659.25 which is a swing-high resistance.
Stop loss is at 2,800.00 which is a level that sits above a multi-swing-high resistance.
Take profit is at 2,363.75 which is a multi-swing-low support that aligns close to the 38.2% Fibonacci retracement.
High Risk Investment Warning
Trading Forex/CFDs on margin carries a high level of risk and may not be suitable for all investors. Leverage can work against you.
Stratos Markets Limited (tradu.com ):
CFDs are complex instruments and come with a high risk of losing money rapidly due to leverage. 63% of retail investor accounts lose money when trading CFDs with this provider. You should consider whether you understand how CFDs work and whether you can afford to take the high risk of losing your money.
Stratos Europe Ltd (tradu.com ):
CFDs are complex instruments and come with a high risk of losing money rapidly due to leverage. 63% of retail investor accounts lose money when trading CFDs with this provider. You should consider whether you understand how CFDs work and whether you can afford to take the high risk of losing your money.
Stratos Global LLC (tradu.com ):
Losses can exceed deposits.
Please be advised that the information presented on TradingView is provided to Tradu (‘Company’, ‘we’) by a third-party provider (‘TFA Global Pte Ltd’). Please be reminded that you are solely responsible for the trading decisions on your account. There is a very high degree of risk involved in trading. Any information and/or content is intended entirely for research, educational and informational purposes only and does not constitute investment or consultation advice or investment strategy. The information is not tailored to the investment needs of any specific person and therefore does not involve a consideration of any of the investment objectives, financial situation or needs of any viewer that may receive it. Kindly also note that past performance is not a reliable indicator of future results. Actual results may differ materially from those anticipated in forward-looking or past performance statements. We assume no liability as to the accuracy or completeness of any of the information and/or content provided herein and the Company cannot be held responsible for any omission, mistake nor for any loss or damage including without limitation to any loss of profit which may arise from reliance on any information supplied by TFA Global Pte Ltd.
The speaker(s) is neither an employee, agent nor representative of Tradu and is therefore acting independently. The opinions given are their own, constitute general market commentary, and do not constitute the opinion or advice of Tradu or any form of personal or investment advice. Tradu neither endorses nor guarantees offerings of third-party speakers, nor is Tradu responsible for the content, veracity or opinions of third-party speakers, presenters or participants.
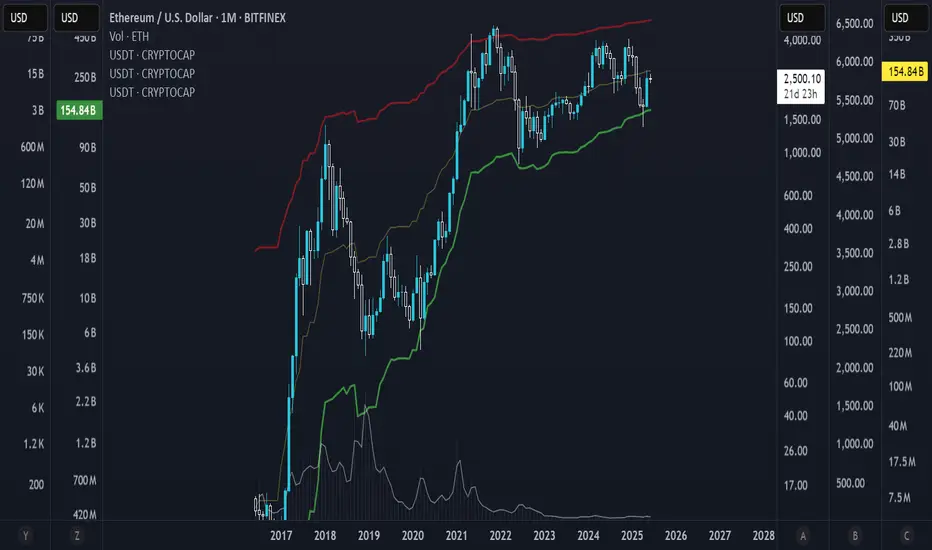
Liquidity BandsI start using the stablecoins mcap as channels, that way you see when the market is overpriced compared to the actual volume of inflows.
It basically envelopes the coin's pricing relative to the actually available liquidity.
"Liquidity Bands", if you will
#ETH/USDT#ETH
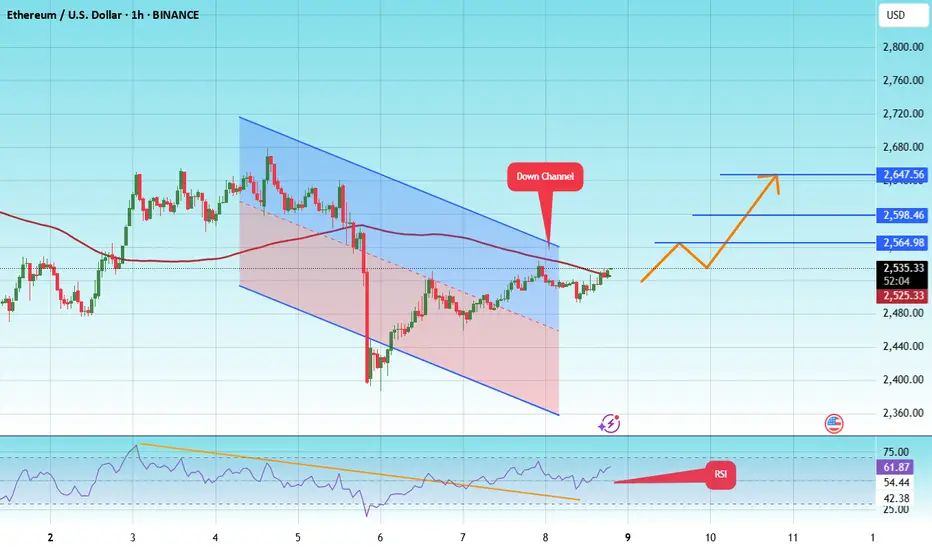
The price is moving within a descending channel on the 1-hour frame and is expected to break and continue upward.
We have a trend to stabilize above the 100 moving average once again.
We have a downtrend on the RSI indicator that supports the upward move with a breakout.
We have a support area at the lower limit of the channel at 2429, acting as strong support from which the price can rebound.
Entry price: 2535
First target: 2564
Second target: 2598
Third target: 2647
#ETH/USDT#ETH
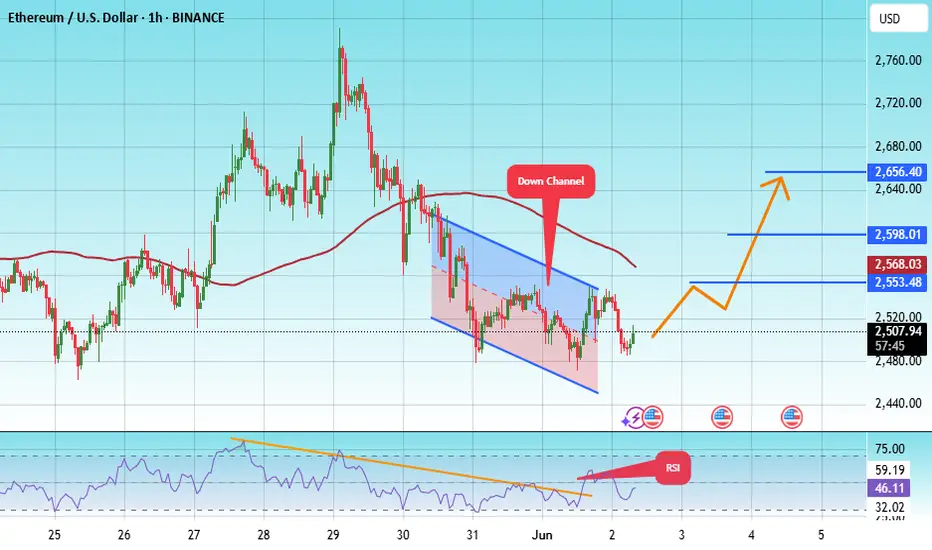
The price is moving within a descending channel on the 1-hour frame, adhering well to it, and is heading for a strong breakout and retest.
We are seeing a rebound from the lower boundary of the descending channel, which is support at 2460.
We have a downtrend on the RSI indicator that is about to be broken and retested, supporting the upward trend.
We are looking for stability above the 100 moving average.
Entry price: 2506
First target: 2550
Second target: 2600
Third target: 2656
ETHUSDETHUSD
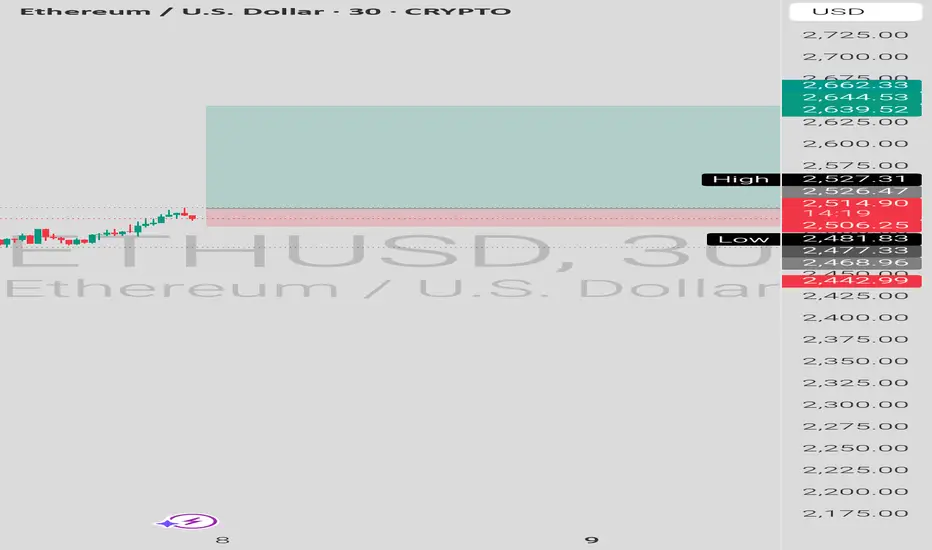
ETHUSD 2500 -2490 acting strong long zone after that profits books , if hold above 2526 and above then we see the good movements of upside till 2600/2660 and many more.
This is educational purposes.
Follow for more daily update.
Tune with me 🙂
One for the books!!!I love learning and expanding my knowledge and experience. The trader that wants to keep on growing and learning despite being successful in this industry that trader will always be the best trader.


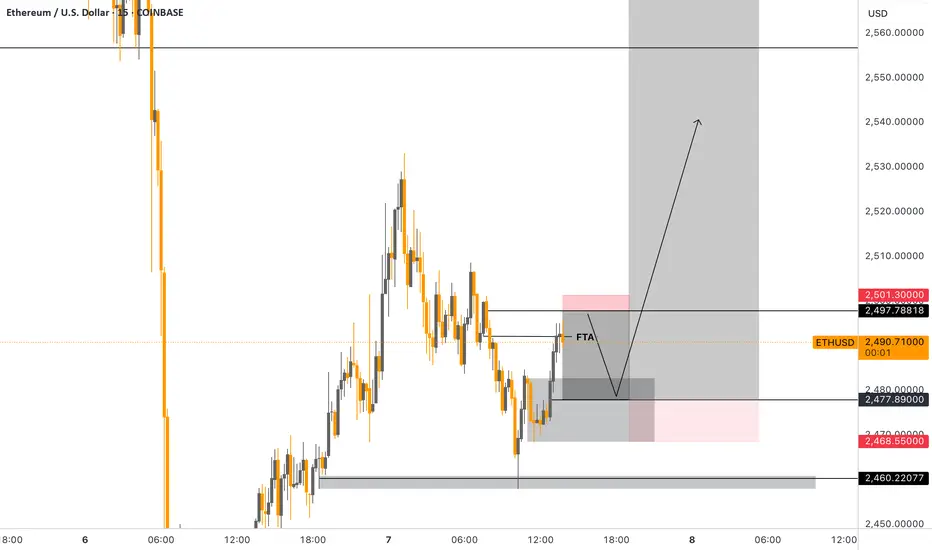
ETHUSDETHUSD – Bearish Sell Setup (AUTH Liquidity Model)
ETHUSD is currently in a retracement phase after rejecting from a recent high. Price action is approaching a zone rich in overhead liquidity, offering a clean short opportunity based on AUTH (Areas of Liquidity) principles.
⸻
Key Elements of the Setup:
FTA – First Trouble Area:
A minor demand zone just below current price where a short-term reaction could occur. This is not the main target, but a potential bounce point.
Inversion Point:
A previously supportive level that now acts as resistance. Often, this is where trapped buyers from earlier rallies exit, fueling momentum for further downside.
VAL – Value Area Low:
A historically high-volume area where price previously consolidated. It often acts as a target for rebalancing moves.
AUTH Liquidity Zones:
• Above price: Stacked buy stops above recent highs and wick clusters
• Below price: Sell-side liquidity in the form of equal lows, trendline bounces, and inefficient zones
The setup anticipates a sweep of upper liquidity before a drop into deeper value.
⸻
Execution Idea:
The setup favors a short entry after liquidity above is cleared and bearish confirmation prints on a lower timeframe. The goal is to enter after price rejects from high liquidity and begins targeting value and imbalance zones below.
⸻
Disclaimer: This is a technical idea shared for educational purposes only. It does not constitute financial advice. Always perform your own analysis and manage risk responsibly.
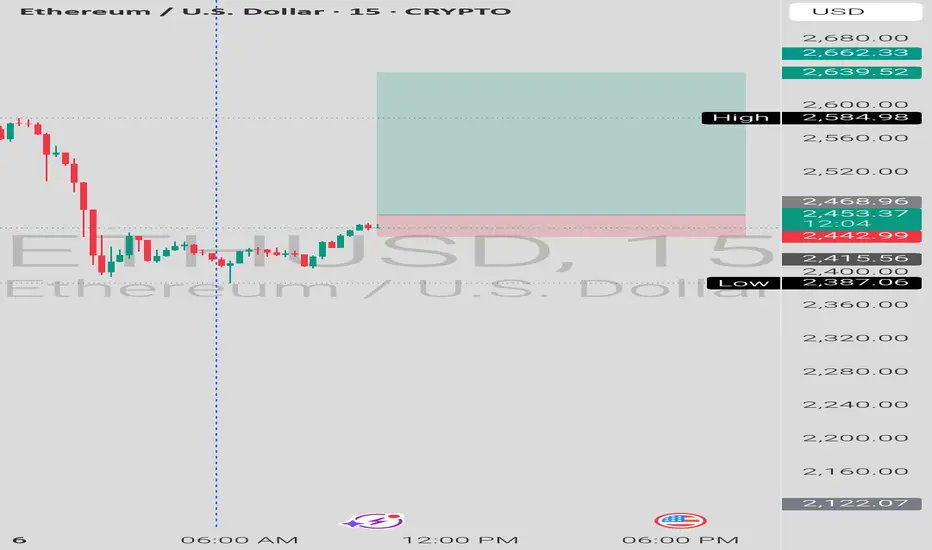
ETHUSD KEY LEVEL.This is the 4 hour chart of ETHUSD.
ETHUSD is currently consolidating in a well defined range.
If the lower boundary of the zone is sustainable ,then we see again higher prices in ETHUSD.
Thank you !!
EthusdIt looks the Ethusd is now forming W4: the last wave of ABC.
I am waiting to break the last support to get a signal W5 of C is done.
Then , we could see the formation of W5 .

ETHUSDETHUSD
ETHUSD at the lower support levels,
From here adding volumes on the long side,
With BOUNCBACEK.
This is educational purposes.
Follow for more.
Tune update.
Downside Risk Ahead: ETH Drops Below 20-Day MA
The last few candles show strong red bodies, suggesting selling pressure.
Price has closed below the middle Bollinger Band (20-day moving average), often a trigger point for downside momentum. This suggests a transition from neutral/bullish to bearish momentum.
Recent highs failed to break the previous peak near $2,900. This forms a lower high, indicating weakening buying strength.

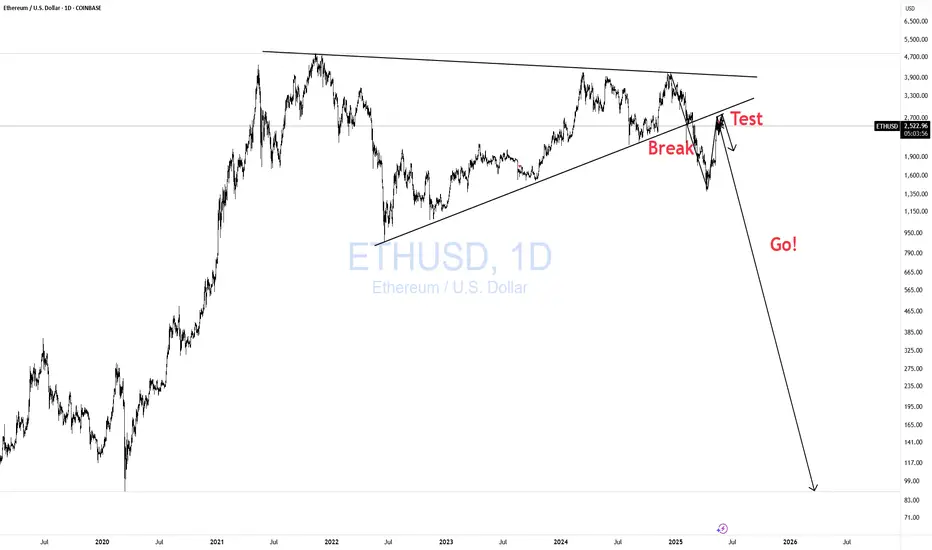
ETHUSD Break- Test- GO!!! Nothing Changed!I have to repost this bc TV only gives me limited updates before it forces "target reached." Here is my previous post.
Nothing has changed. Just as I expected. If anything, it looks even more bearish now. As always, wait for the hook!
Click Boost, and follow Let's get top 5,000!

Ethereum (ETH/USD) Technical Analysis — Bearish Rejection Below 🔍 Ethereum (ETH/USD) Technical Analysis — Bearish Rejection Below Resistance ⚠️
📅 Date: June 4, 2025
📊 Chart Type: 2-Hour Timeframe
💱 Exchange: Binance
---
🧠 Overview:
The chart displays a clear range-bound market between well-defined resistance and support zones. The most recent price action suggests a rejection from the resistance region, hinting at a possible downward move toward support.
---
🟧 Key Levels:
Resistance Zone: $2,720 – $2,760
Price has tested this zone multiple times and failed to break above decisively.
Marked as a strong supply area where sellers dominate.
Support Zone: $2,460 – $2,490
This area has historically attracted buying interest, causing price reversals.
---
📉 Market Structure & Price Action:
The recent swing high formed a lower high relative to the peak on May 29, suggesting bearish momentum.
A projected bearish move is marked on the chart with a blue arrow 📉, forecasting a drop from around $2,640 down to the support zone near $2,480.
Multiple failed attempts to break resistance signal a potential trend continuation to the downside within this trading range.
---
⚠️ Trading Implications:
Short-term bias: Bearish 🔻
Confirmation needed: A breakdown below $2,600 with volume would strengthen bearish conviction.
Target for bears: $2,480 support area
Invalidation zone for this outlook: A breakout and close above $2,760 would shift the bias to bullish.
---
📌 Conclusion:
Ethereum is currently trading within a well-defined horizontal channel. With the latest rejection near resistance, the probability favors a move down to the support area. Traders should monitor key levels closely for confirmation before entering positions.
📈 Tip: Use proper risk management and watch for candlestick confirmation at critical levels.

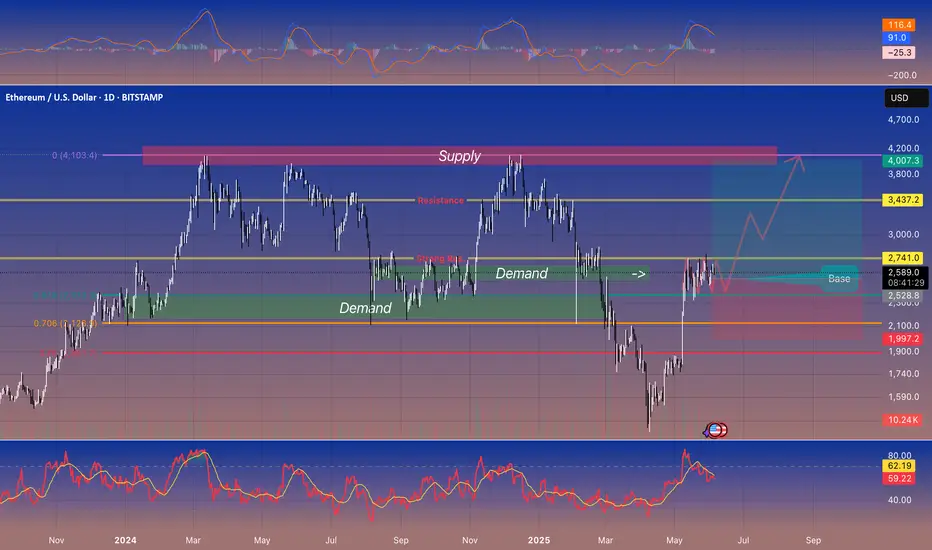
Ethereum (ETHUSD) • Daily • Trading ideaEthereum (ETHUSD) • Daily Chart 🚀
---
🔑 Key Levels
* Demand Zone (Support): \$2,350–2,550
* Price has bounced here twice in the last year.
* Immediate Resistance: \$2,741
* Multiple rejections around this level recently.
* Next Major Resistance: \$3,437
* Former highs in late 2024/early 2025.
* Big Supply Zone (Strong Sell Area): \$4,000–4,200
---
💡 What’s Happening?
* ETH is sitting in a “base” between \$2,528–2,741 (green box).
* If it breaks above \$2,741 on strong volume, it can run toward \$3,437 and eventually \$4,000+.
* If it falls below \$2,528 (demand), the next support is around \$1,997.
---
🎯 Trade Idea
* Bullish Entry: Buy on a daily close above \$2,741 + higher-than-usual volume.
* First Target: \$3,437 (take partial profit).
* Final Target: \$4,000–4,200 (major sell area).
* Stop-Loss: Below \$2,500 (just under support).
* Bearish Scenario:
* If price drops below \$2,528 with big volume, look for a possible move down toward \$1,997.
---
📈 Indicators (Confirmation Only)
* Volume: Watch for a spike on any breakout above \$2,741.
* MACD & RSI: If both are rising (not overbought), it adds confidence—though price and volume matter most.
---
👍 Summary
ETH is coiling in a strong support zone. A clean break above \$2,741 on good volume can send it to \$3,437, then \$4K+. If support fails, \$1,997 is next. Trade with proper stops and watch volume for confirmation.
— Feel free to leave a 🚀 if this helps!
#Ethereum #ETHUSD #Crypto #Support #Resistance #Volume
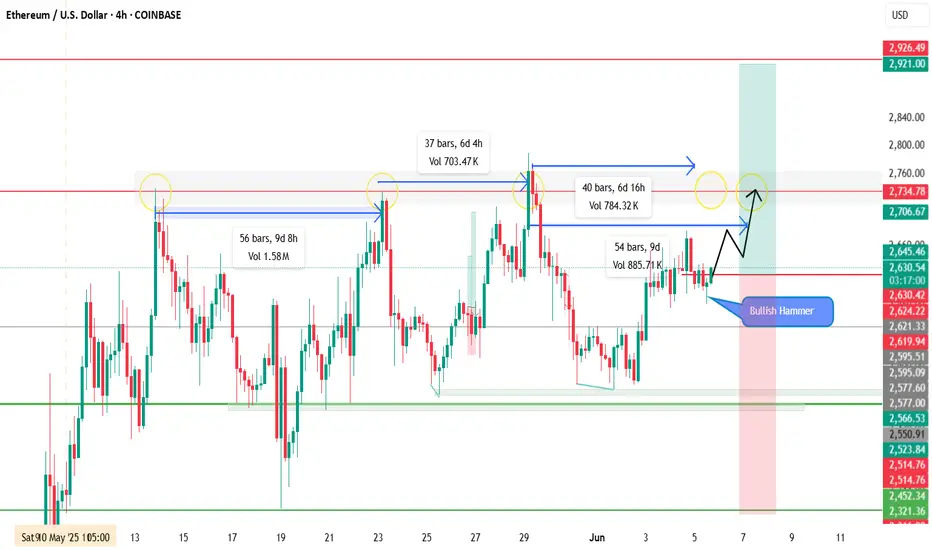
ETHUSDETH is showing signs of a potential resistance retest, echoing previous price behavior. On the 4H chart, historical data suggests ETH typically revisits resistance zones within 6–9 days (±). The pair has been ranging between support and resistance, and a strong bullish hammer has just formed — signaling a potential shift in momentum.
📍 Entry: Market (Instant)
🛑 Stop Loss: 2312
🎯 Take Profit: 2913 (1:1 Risk-Reward)
📊 Plan: Trade aligned with historical timing and price structure. Entering on bullish confirmation.
⚠️ Note: Manage risk accordingly — structure looks promising, but always respect your stop.
Ethereum has reached its bottomKey support trendline should offer spring towards the next bullish wave.

ETHUSD – 4H Chart AnalysisPrice has reached a key resistance zone around the 2,700 level. The market structure suggests potential for a downward move from this area, forming lower highs and indicating selling pressure.
📉 Sell Idea
Entry: 2,605
Target 1: 2,506
Target 2: 2,398
Target 3: 2,303
Stop Loss: Above 2,725
Structure-based trade setup with risk-to-reward in favor of sellers. Will be watching for confirmation through bearish price action on lower timeframes.
⚠️ This is not financial advice. For educational and analysis purposes only.

$ETH Broadening Wedge TargetCRYPTOCAP:ETH reached its technical target of $4K from the ascending triangle (Jul '22-Oct '23).
CRYPTOCAP:ETH appears to be back in the multi-year range between $1.9K-$4K.
If the Bull Market continues, the current macro pattern could develop into a flat top broadening wedge with a target of $11.7K.
Invalidation if it fails to break $4K, or falls to Hades.

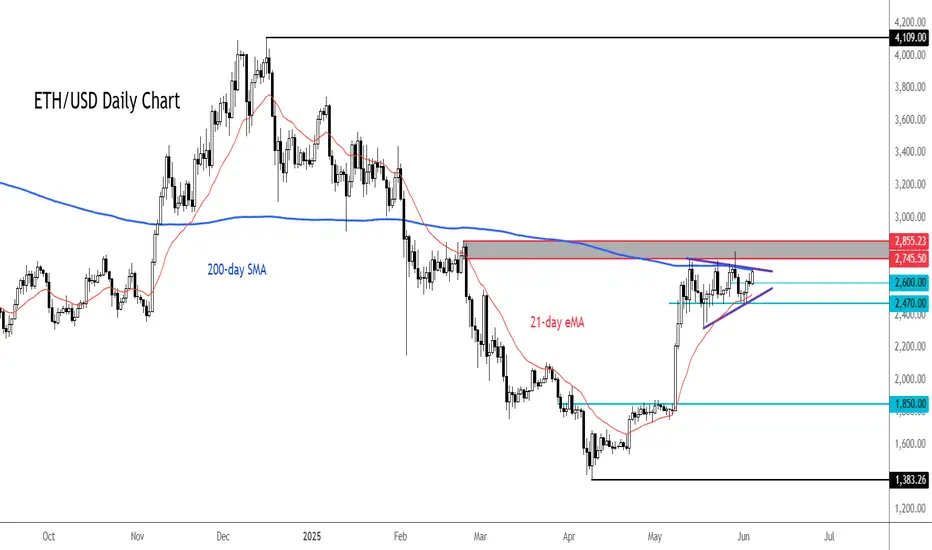
ETH/USD gearing up for potential breakoutThe ETH/USD has been coiling inside a bullish continuation pattern for several weeks now and a breakout could be on the cards soon. The consolidation suggests ETH is gearing up for a potential breakout soon, as it chips away at resistance coming from the 200-day moving average near $2700.
Further resistance is seen between $2745 to $2855, as shaded in grey on the chart. If it gets through this area of resistance in the coming days, then a big breakout could be on the cards, with the first stop likely around $3,000, but we could go much further than that over time, given the length of the current consolidation.
However, it is essential that the ETH/USD doesn't break the support trend of the consolidation pattern and key support at $2470 now. If it does, then that would invalidate the bullish price structure.
By Fawad Razaqzada, market analyst with FOREX.com