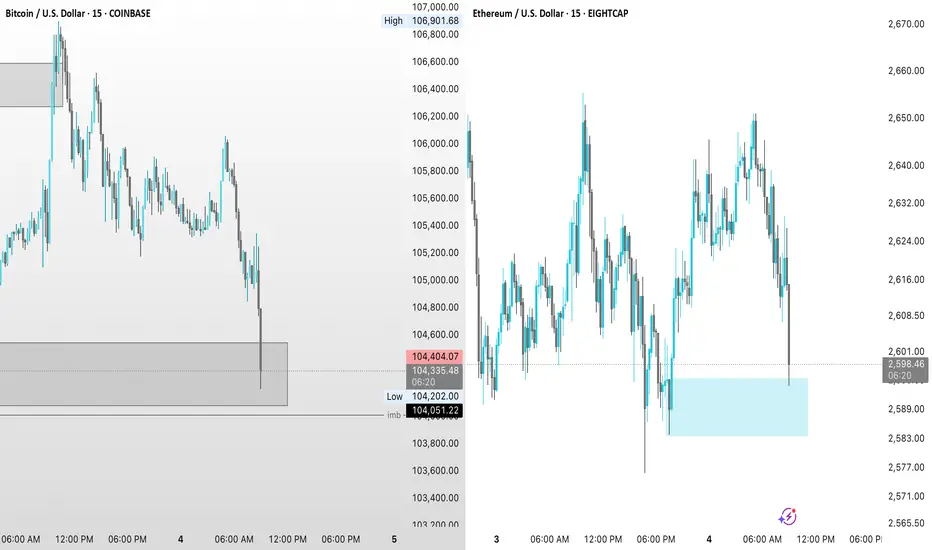
BTC & ETH LONGSliquidity
manipulation
imbalance
mitiation
both coming into POIs at the same time but different zones
ETHUSD.P trade ideas
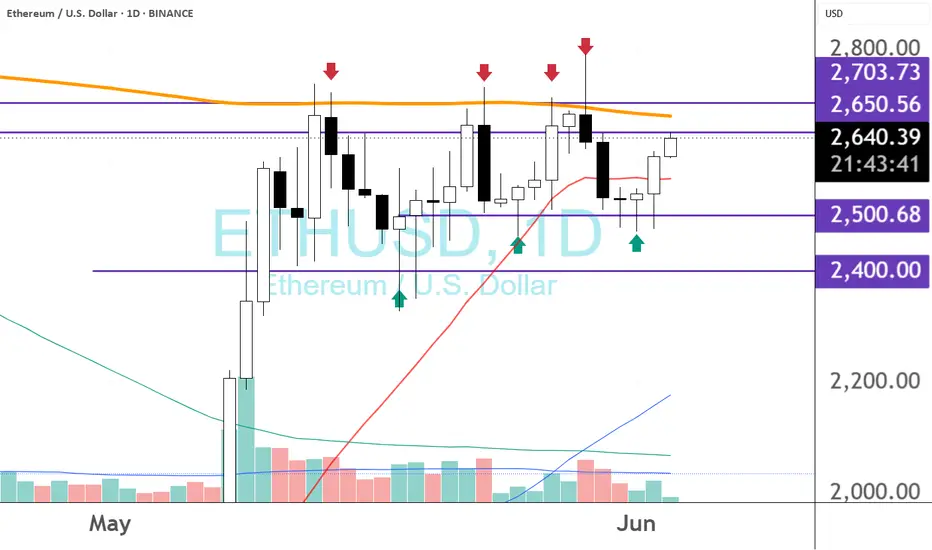
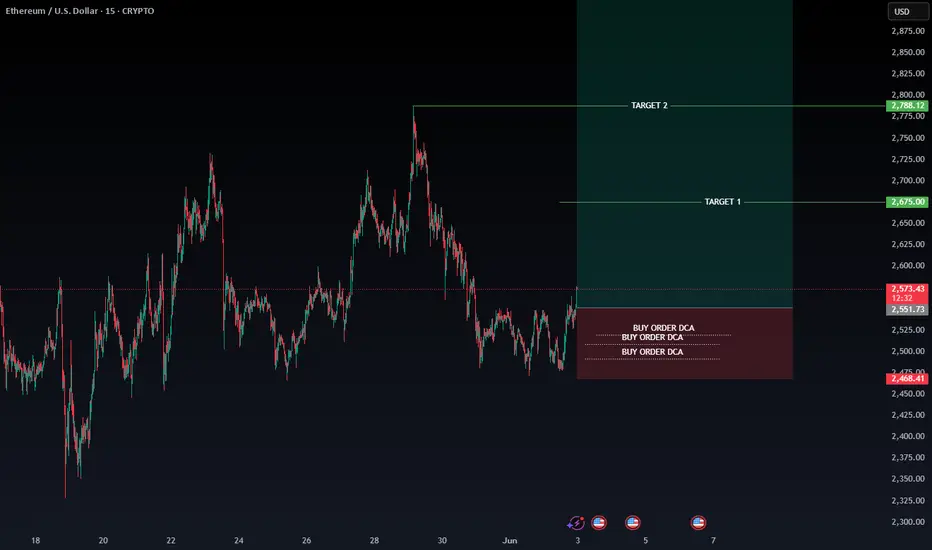
ETHUSD tested the Resistance level 2650.00 👀 Possible scenario:
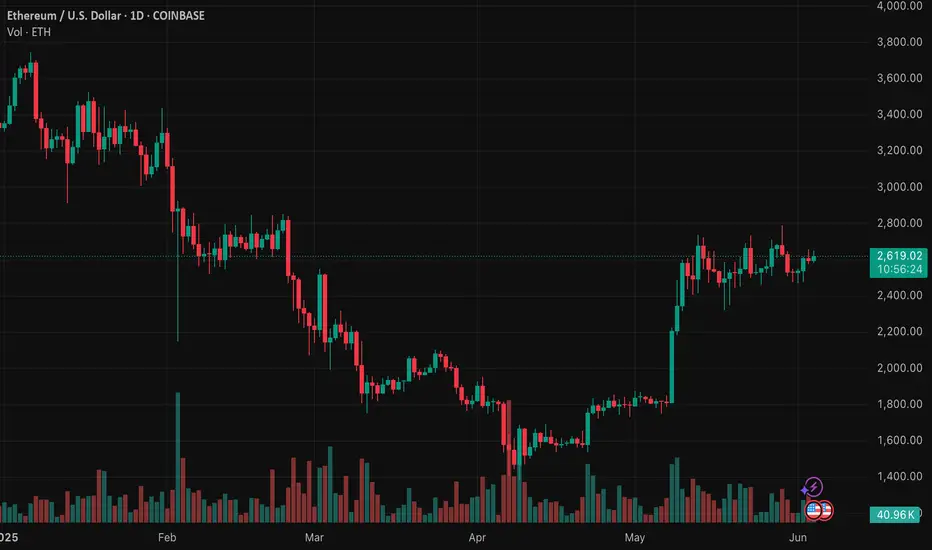
Ether (ETH) rose 7% on June 2, fueling optimism among traders about a potential breakout. The ETH/BTC pair also gained, strengthening recovery prospects. ETH is currently trading near $2,650, up 46% over the past month, and holding above key support. While ETH is still far from its all-time high of $4,891 set in November 2021, its current price stabilization around $2,650 could form a new base. If this level holds, it may pave the way for a renewed push toward higher prices.
Several factors are supporting ETH’s recent gains. Continued inflows into Ethereum-focused ETFs from major issuers like BlackRock and Fidelity indicate growing investor interest. At the same time, a number of companies, including BioNexus Gene Labs and SharpLink Gaming, are building ETH holdings as part of their treasury strategies. In addition, the amount of ETH held on centralized exchanges has declined, suggesting many holders are opting for long-term storage rather than immediate selling.
✅Support and Resistance Levels
Support level is now located at 2,480.00.
Now, the resistance levels are located at 2,650.00 and 2,765.00.

ETHETH continues to hold the line so far
Would love to see us blast off from here
We had enough pain since the year began if more comes this will be the craziest bullrun for alts
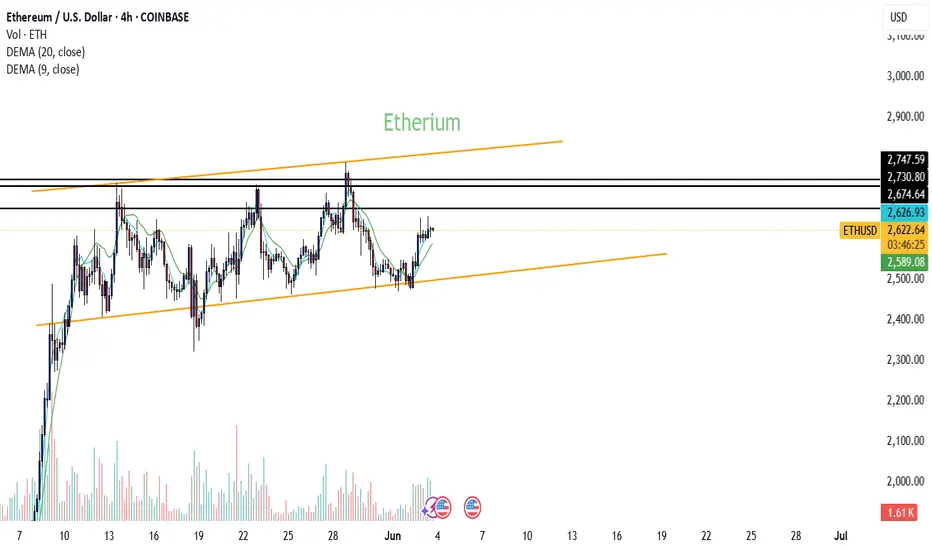
Etherium is following the trendas we all noticed that the crypto was retracing its significant keys, going to redefine the new era of crypto currency , etherium stays solid in this erea showing no mitigation. we assume that its bullish following other big crypto like etherium, sol, btc
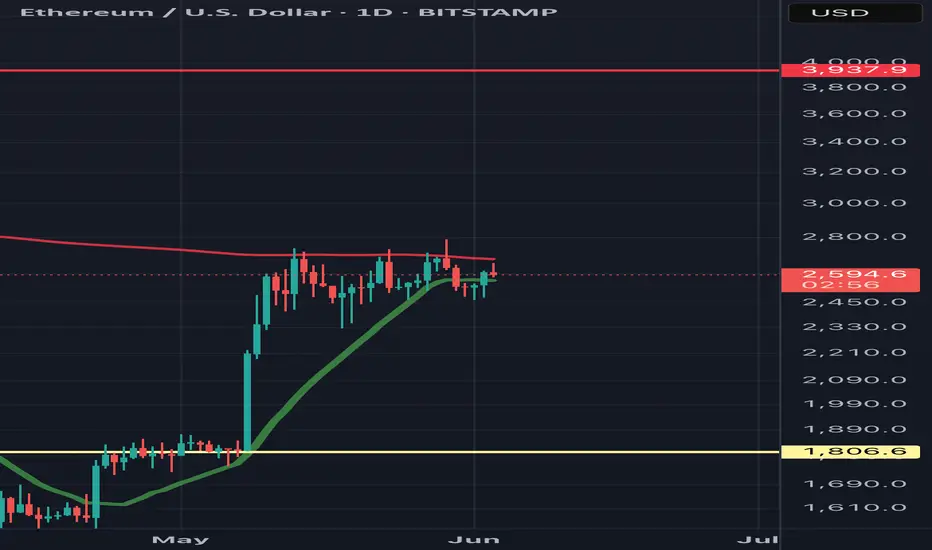
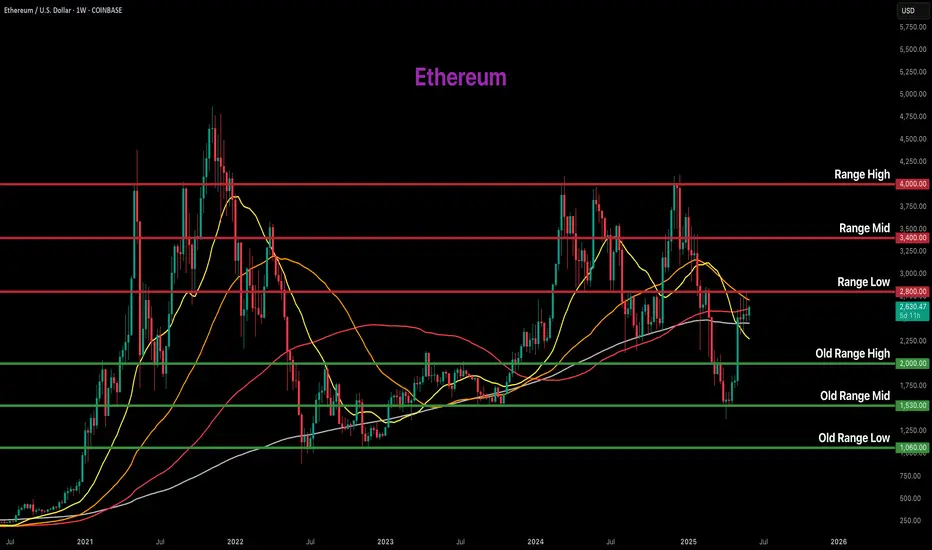
Ethereum - The most important analysis for 2025!Ethereum - CRYPTO:ETHUSD - is clearly shifting bullish:
(click chart above to see the in depth analysis👆🏻)
After four years of trading, Ethereum is now sitting at the exact same level compared to mid 2021. However, Ethereum has been creating a significant triangle pattern and with the recent bullish price action, a breakout becomes more and more likely. Then, the sky is the limit.
Levels to watch: $4.000
Keep your long term vision!
Philip (BasicTrading)

Ethereum Is Not DEAD ... WHY ??? Because BlackRock Says SoMartyBoots here , I have been trading for 17 years and sharing my thoughts on ETH here.
ETH Is Not Dead — It’s Just Getting Started
Narrative of ETH being “dead” is short-sighted. Here’s why:
1. Ethereum Is Still Younger Than Bitcoin
• Ethereum launched in 2015, a full 6 years after Bitcoin.
• BTC had over a decade of network effect, price discovery, and global trust before ETH even got its first DApp.
• On the charts, ETH still has room to mature, just like Bitcoin did pre-2020.
• Fundamentally, Ethereum is still evolving — from PoW to PoS, scaling solutions (L2s), and now modular chains.
You’re not late to ETH — it’s just halfway through the marathon.
⸻
2. BlackRock’s BUIDL Fund Is a Massive Signal
• The BlackRock BUIDL fund, launched on Ethereum, already has $3B in AUM — and it’s growing.
• It shows that legacy institutions aren’t ignoring ETH — they’re building directly on it.
• This isn’t speculative hype. It’s tokenized real-world assets backed by the biggest asset manager on earth.
• Smart money is moving into ETH, not away from it.
The narrative is shifting. Institutions aren’t betting on meme coins — they’re betting on Ethereum rails.
Final Thought
ETH is not dead. It’s undergoing the same early-stage skepticism BTC did in its early years. With foundational upgrades and institutional validation, ETH might be the most undervalued top asset in the market today.
⸻
Watch the chart. Track the fundamentals. And don’t sleep on ETH.
#Ethereum #ETHUSD #Crypto #fundamentals #BUIDL #BlackRock #OnChainData #NotDead #TradingView
Watch video for more details

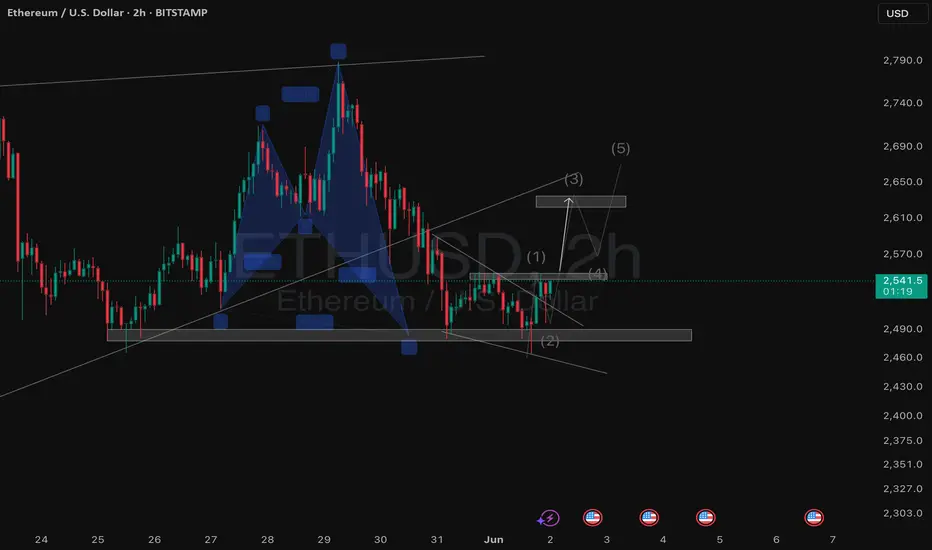
Weekly trading plan for EthereumIn this idea I marked the important levels for this week and considered a few scenarios of price performance
RSI is already showing a bearish divergence and therefore it is possible to see a correction before further growth
Write a comment with your coins & hit the like button and I will make an analysis for you
The author's opinion may differ from yours,
Consider your risks.
Wish you successful trades ! mura

This is why I don't buy Ethereum.This chart shows a clear loss of momentum after a long-term uptrend.
The trendline supported the price for years, confirmed multiple times (green arrows).
Price broke below the trendline and failed to reclaim it (red arrows = rejection).
We're seeing a potential triple top pattern with lower highs (blue curves), a classic distribution signal.
📉 Last candle confirms breakdown structure — lower highs, and now lower lows.
I'm not saying ETH is dead.
But for me, this is not a buy.
Until it reclaims the trendline or shows true strength with a breakout and volume, I'm staying out.
Thanks For Reading.

Is Ethereum ready for a higher high?CRYPTO:ETHUSD seems to be the only one, from the top cryptos, wit the best technical set-up, at the moment. Let's dig in.
CME:ETH1!
Let us know what you think in the comments below.
Thank you.
77.3% of retail investor accounts lose money when trading CFDs with this provider. You should consider whether you understand how CFDs work and whether you can afford to take the high risk of losing your money. Past performance is not necessarily indicative of future results. The value of investments may fall as well as rise and the investor may not get back the amount initially invested. This content is not intended for nor applicable to residents of the UK. Cryptocurrency CFDs and spread bets are restricted in the UK for all retail clients.

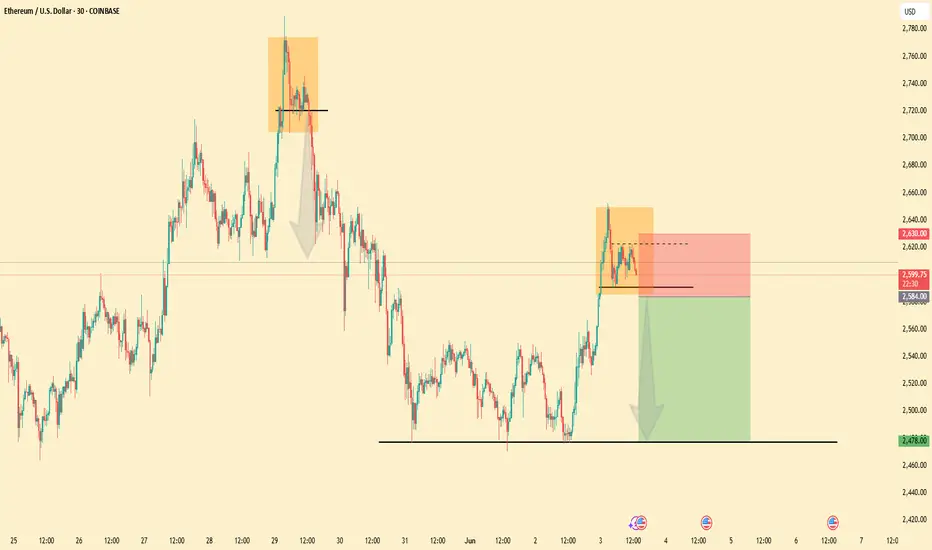
ETH short trade idea (30 min chart)Short Entry: 2584
Stop-Loss: 2630
Take-Profit: 2478
Risk/Reward: 2.3 / 1
My Market Review for the week 03/06/2025 (Tuesday)Staying bearish for now.
Let me know your thoughts and ideas and of any other pairs you would like me to look at

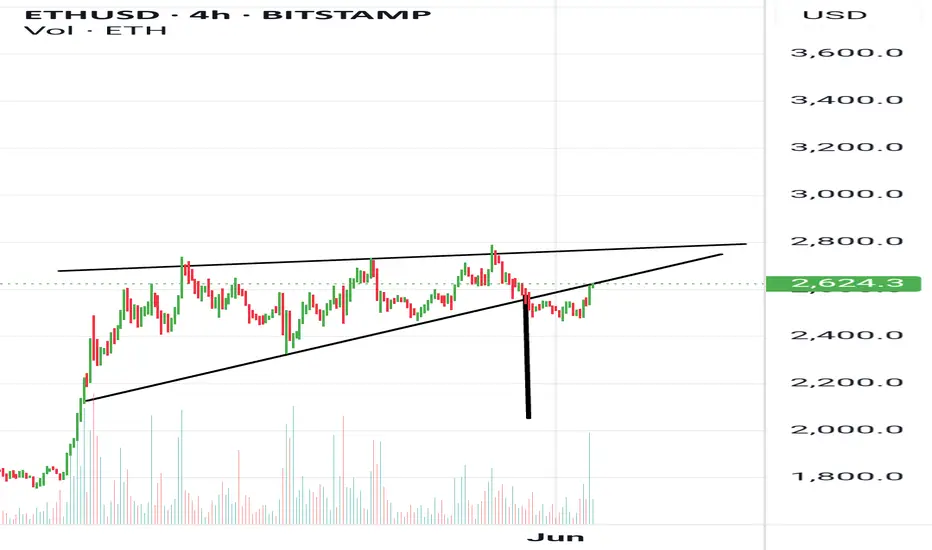
ETHUSD - Bullish RectangleETHUSD is making Bullish Rectangle Pattern, will it break & move towards target price?
Entry, Stop Loss & Take Profit are mentioned.
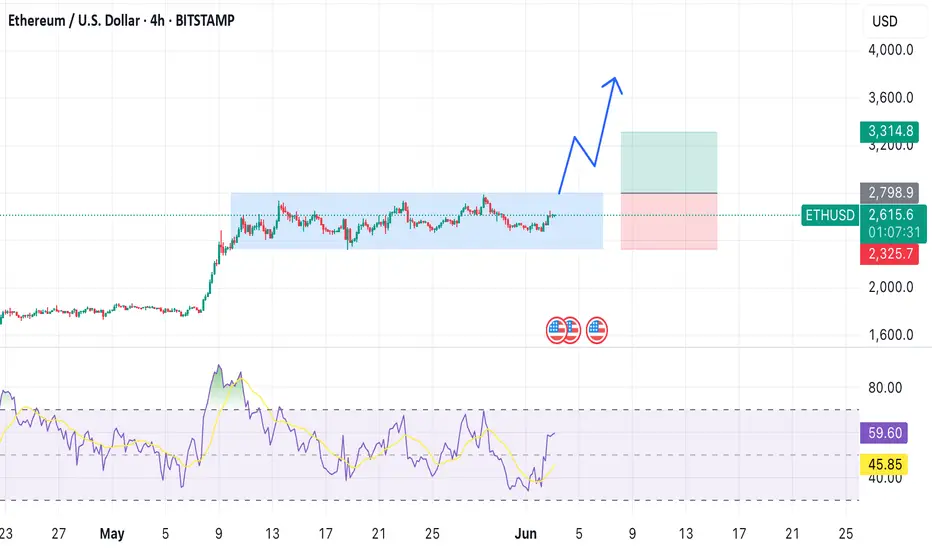
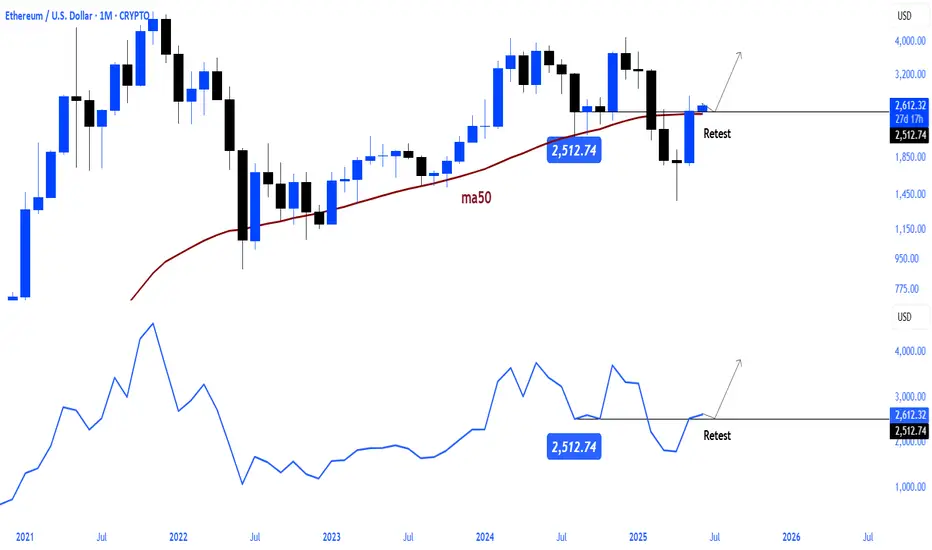
$ETH prepares for a bullish wave!Ethereum's breakout and retest of the $2.5k level of major resistance on a monthly basis has been completed and ethereum, which also reclaimed its ma50 moving average, is ready for a bullish wave !
Ethereum 4H Chart: Bullish Continuation Above Key SupportTH traded in a tight range (~$2550–$2480). Strong breakout from this accumulation box suggests bullish momentum.

ETHUSD likely to go 2600-2650 RSI is bouncing off oversold zone, indicating buyers returning. MACD histogram shows loss of bearish momentum. Price is trying to reclaim minor support level from late May.

Pending for a big moveEthereum (ETH) has been trading within a sideways range since May 10, fluctuating between $2,400 and $2,700.
Recently, it has established a new support level around $2,500, suggesting that higher lows are forming.
A confirmed breakout requires a daily candle close above the $2,700 resistance level (200Days MA).
DYODD
ETH/USD Bullish PlanGoing long if 2550 breaks and sustain, holding till 2630 range. Exit and re-enter after pull back .Holding till 2666 only it BTC acts well.
Break down Were gunna go back down in ethfor a short period were getting a retest of the upwar slope if we get rejected looking at 20% move downwards
ETH Scalping Signal – Entry, Stop & Target Ready!🕒 Timeframe: 15min / 5min
⚠️ Note: Manage your risk — intraday volatility is high.
This is a short-term opportunity, not a long hold.
Disclaimer: This is our personal analysis and not financial advice. Always do your own research before making any investment decisions.
💬 What’s your take on this? Drop your thoughts in the comments and feel free to share this with your friends! ❤️
ETHUSD short-term🔍1. Technical situation
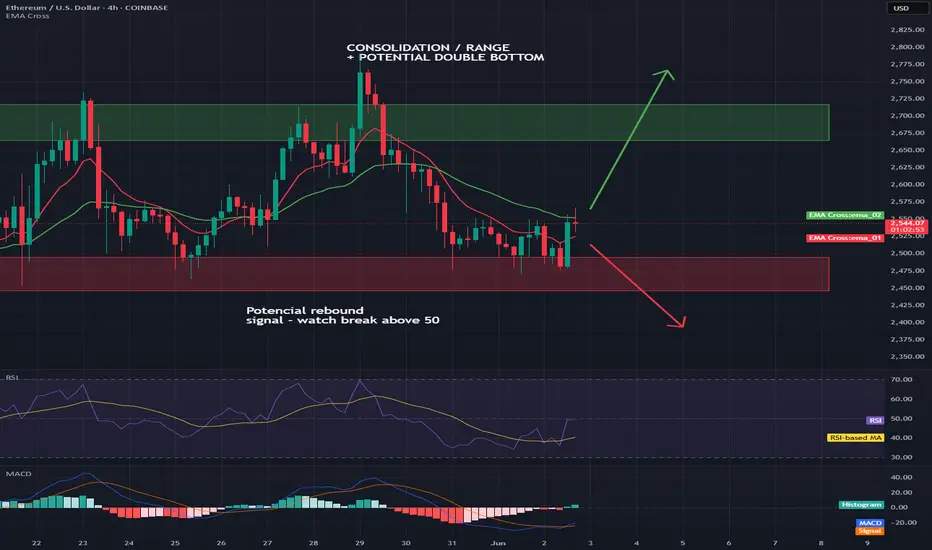
ETH/USD is in a consolidation phase — the price is moving in a rather narrow range, without a clear upward or downward trend.
📊
The upper limit of this consolidation is the resistance zone of USD 2,664–2,717 (green rectangle on the chart).
The lower limit is the support zone of USD 2,495–2,446 (red rectangle).
2. Potential formation
A potential double bottom formation can be seen on the chart, which is a classic trend reversal formation to an upward one.
The lows occurred around May 25–31 and at the end of May.
Confirmation of the formation would be a breakout of the resistance zone of USD 2,664–2,717.
3. Technical indicators
RSI:
Currently, the RSI has rebounded from zone 40 and is heading up. Exceeding the 50 level may be a signal of buyers' strength and support for the bullish scenario.
On the chart: "Potential rebound signal - watch break above 50"
MACD:
MACD is close to generating a momentum change signal (potential intersection of the MACD and signal lines).
On the chart: "MACD near signal - watch for momentum shift"
4. Scenarios for the coming hours/days
Bullish scenario (up):
✅
If the price breaks above USD 2,717 (exit from consolidation upwards), a dynamic move towards USD 2,800 can be expected.
Support for this scenario will be signals from RSI and MACD.
Bearish scenario (down):
🔻
If the price rejects the resistance zone and returns below USD 2,446, the risk of going down to the next support in the area of USD 2,300 increases.
🧠
Summary
Key Levels:
📌
Support: $2,495-$2,446
Resistance: $2,664-$2,717
Currently, the market is in consolidation with an attempt to break out to the top.
Watch for: Resistance breakout (potential bullish signal) and support reactions (potential bearish).
Pattern: Potential double bottom - needs confirmation.
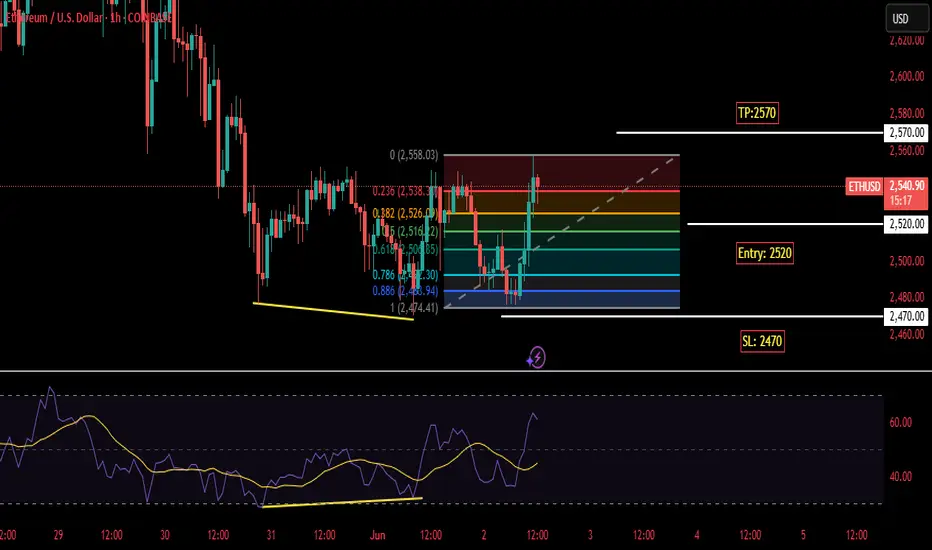
ETHUSDI am taking a long position on ETHUSD on FIB level 0.382-0.5 Retracement Entry Price will be 2520 with a SL of 2470 and TP of 2570