How Wall Street Will Play ETH this Bull CycleI think once that stable coin bill is approved, it will be very bullish for ETH.
I have ETH going to about ~8k or ~9k sometime this cycle, conservative estimate.
I'm thinking an upward trajectory of about 100% from the previous all time high.
Please let me know your thoughts on this one. Thanks.
ETHUSD.PI trade ideas
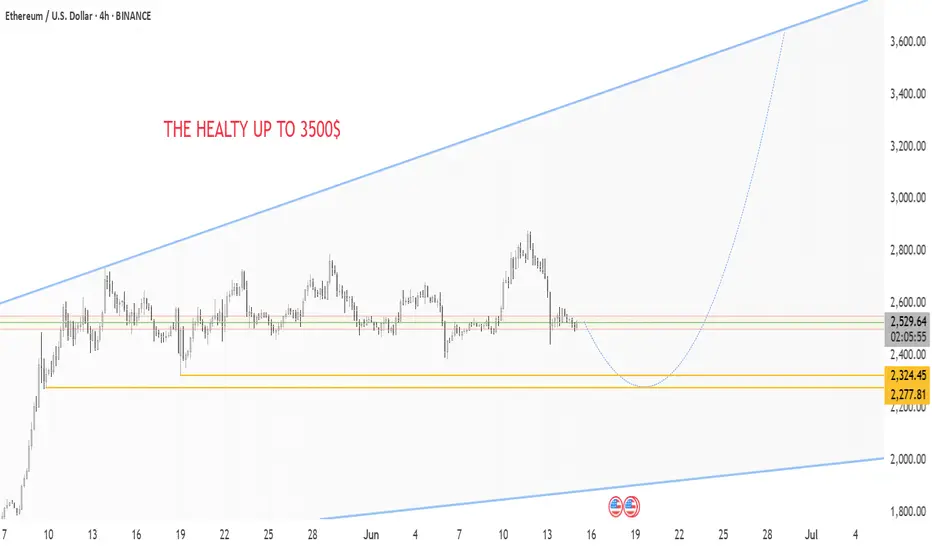
ETH/USD: The Great Ethereum Bounce is HERE!🚀 THE MOON MISSION (Resistance Zone)
HEALTY TARGET: $3,500 - Your text says it all!
Upper Trendline: Acting as launch pad
Psychological Resistance: $3,000 round number
🟢 CURRENT LAUNCH PAD
Price: $2,529.15 - Breaking above key resistance
Previous Resistance: $2,324.45 - Now turned support
Support Zone: $2,277.81 - Strong foundation
🔴 DANGER ZONE (Abort Mission)
Critical Support: Lower trendline around $2,000
Major Support: $2,277.81 level must hold
💡BUY ZONE: $2,100 - $2,180 🎯
⚠️STOP LOSS: $1999 (Previous resistance) ⚠️
TAKE PROFIT 1: $2,650 (Take 50% profits) 🔥
TAKE PROFIT 2: $3,300 (Let winners run!) 🔥
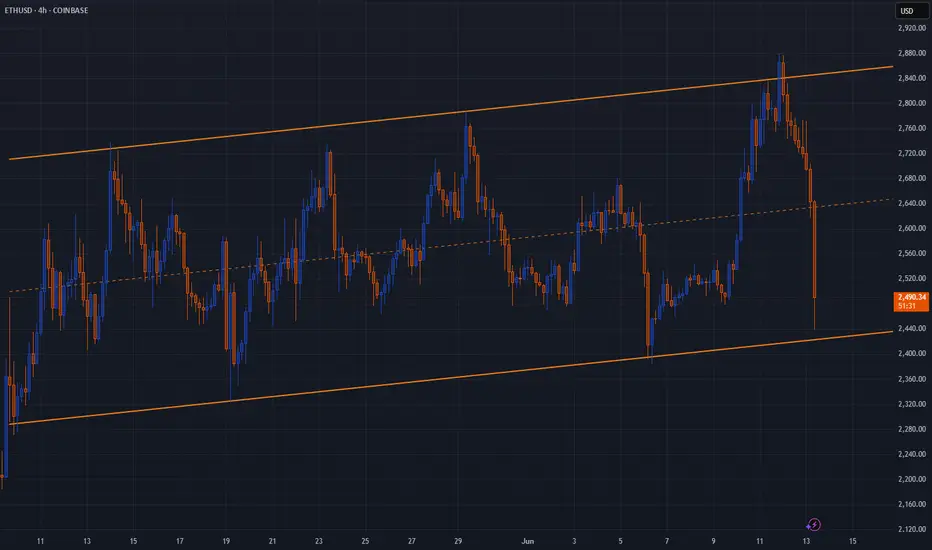
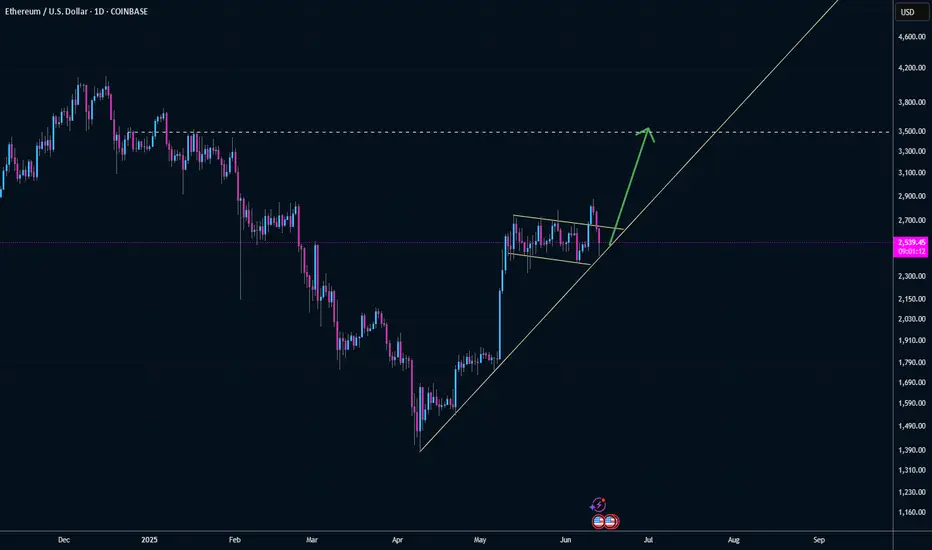
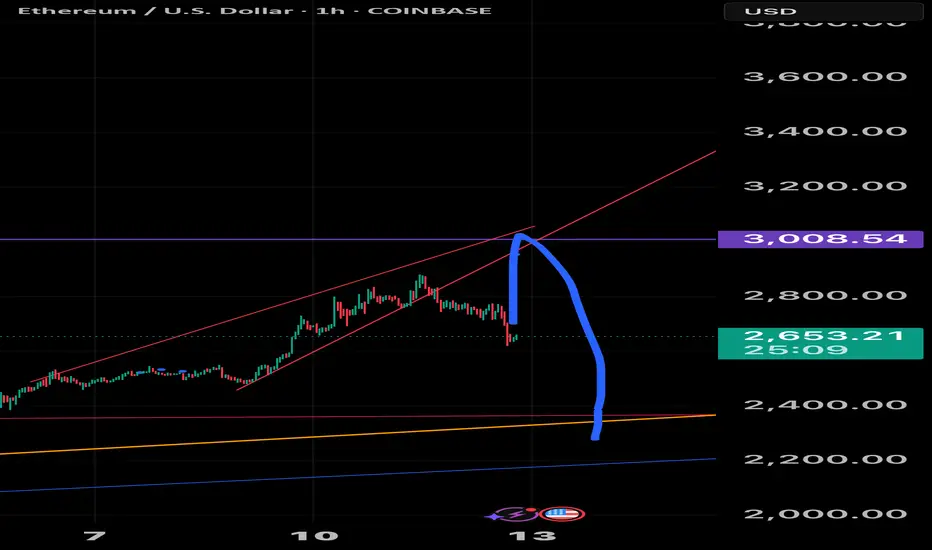
ETH will rebound.What you're looking at is a textbook rising channel, well-respected, clean, and elegant in its symmetry. For weeks, ETH has climbed this structure with rhythmic oscillations between support and resistance, almost as if the market were guided by a ruler and compass. Price action respected both boundaries with admirable discipline, making this a trader’s dream for range-based strategies. Now, that structure is being tested sharply.
The most recent candle shows a strong drop from the upper boundary straight to the lower. It didn't drift down gently but fell with force. Yet despite that intensity, price has landed precisely on the lower boundary of the channel. This is often where markets pause and reset. If the structure remains intact, and history offers any guide, this could mark the beginning of a fresh upward leg. The drop may have been more about clearing excess than breaking trend.
There is reason to believe in the bounce. The channel has been reliable, and deep tests like this often come before a recovery, not a collapse. If price begins to stabilize here, even modestly, it would suggest that the market still respects this structure. The next few candles will matter, but for now, the channel is holding. And when a structure like this holds after such a flush, it can produce some of the strongest moves back to the top.
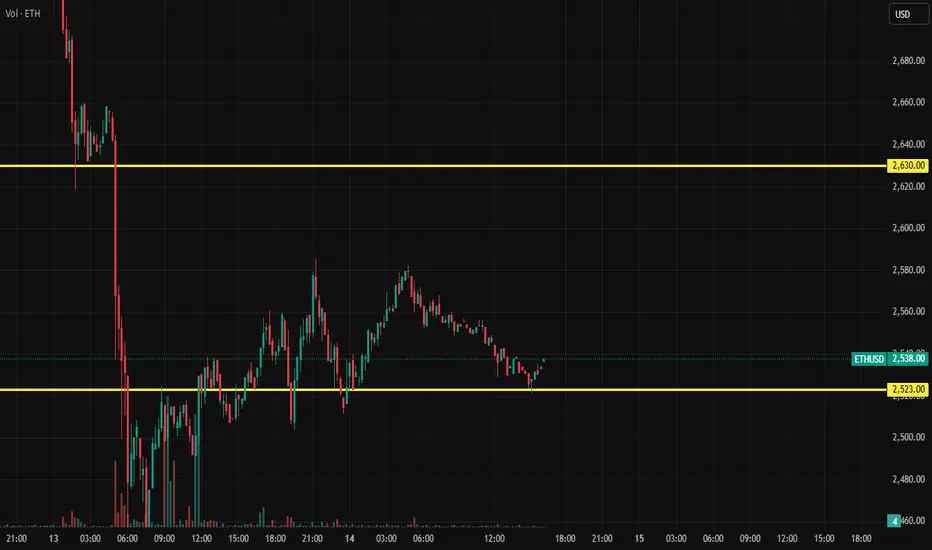
Ethereum Liquidity Pool RangeOn the ETH/USDC liquidity pool on the Base network, Ethereum’s volatility is beginning to stabilize, creating a favorable range for liquidity provision, as indicated by the horizontal red lines. There may be an opportunity to tighten this range further in the coming hours, but additional data is needed to confirm. For now, the concentrated range is being set slightly wider, given that we’re still relatively close to the significant volatility spike from earlier in the week.
Reaccumulation Before Breakout? Idea Summary:
Ethereum is currently in a consolidation phase after testing the $2,700–$2,750 zone. Using Fibonacci retracement and extension levels, I anticipate a potential bullish continuation pattern forming above key support zones, with eyes on higher targets.
🔍 Technical Analysis:
Current price: ~$2,540
Key Fib retracement levels:
0.786 – ~$2,347 → holding as immediate support
0.618 – ~$2,222
0.5 – ~$2,064
0.382 – ~$1,906
Resistance zone: ~$2,734 (Fib 1.0)
Main breakout target:
1.618 extension – $3,563
2.618 extension – $4,904 (longer-term projection)
Price action suggests a potential bullish structure forming – a possible inverse head & shoulders or ascending triangle pattern.
Bullish Scenario:
If ETH holds above $2,300–$2,350 and breaks above the $2,730 resistance, we could see a surge toward the $3,560 level (1.618 Fib extension), with the possibility of entering a parabolic leg toward $4,900+ in the longer run.
Bearish Scenario:
If ETH fails to hold above the 0.786 level ($2,347), the next downside supports are:
$2,222 (0.618)
$2,064 (0.5)
These levels could offer new long entries depending on reaction.
Conclusion:
Ethereum is forming a solid base for the next move. As long as bulls protect the $2,300 zone, the chart favors upside continuation. A break above $2,750 would confirm strength and may trigger a powerful bullish extension.

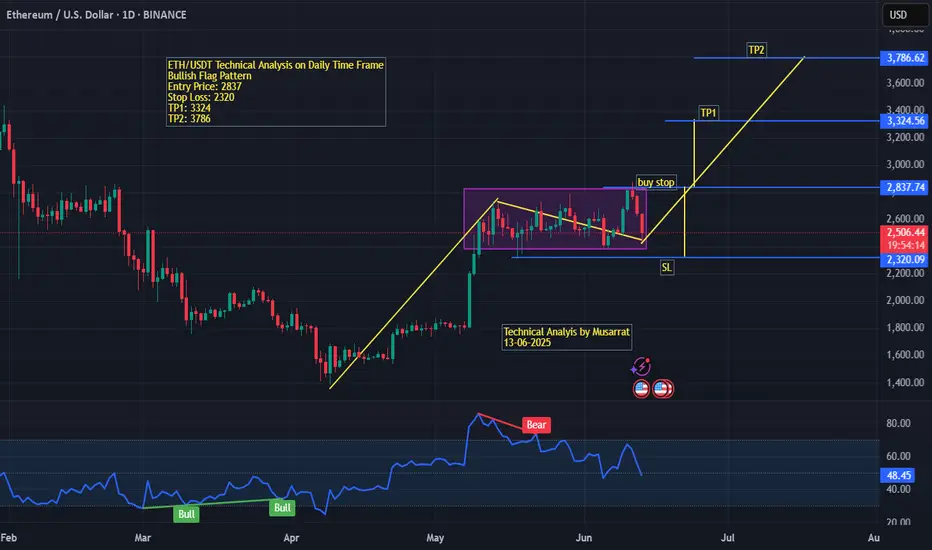
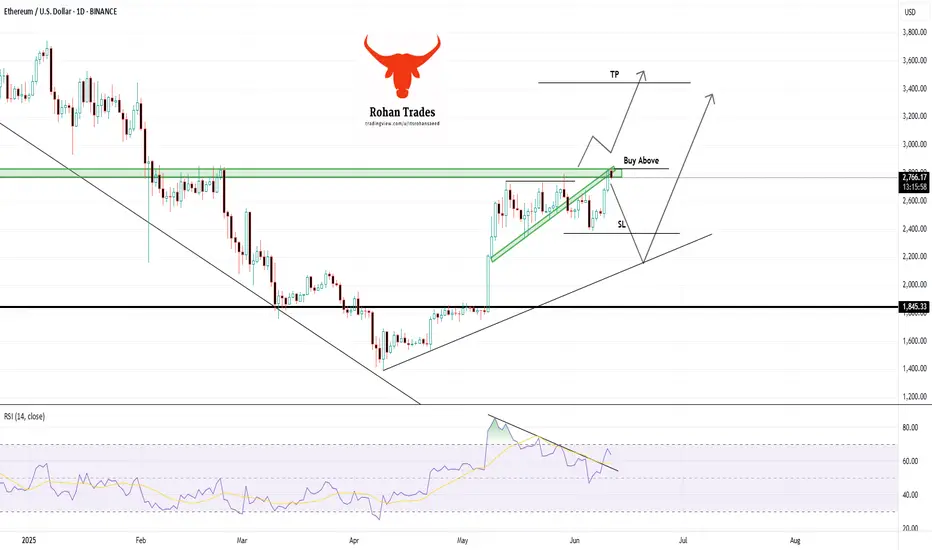
ETH/USDT (Daily Time Frame) Technical Analysis – ETH/USDT (Daily Time Frame)
Chart Date: June 13, 2025
Pattern: Bullish Flag
Ethereum (ETH) against USDT is currently forming a bullish flag pattern on the daily chart, indicating a potential continuation of the previous uptrend. The price action shows a sharp bullish rally followed by a consolidation phase within a descending channel (flag), which is typical in such setups.
Entry Point: The breakout level is marked at $2,837, which serves as a potential buy-stop trigger.
Stop Loss (SL): Placed at $2,320, just below the support zone and the lower boundary of the consolidation flag. This helps protect against a false breakout.
Target 1 (TP1): $3,324, derived from the height of the flagpole projected from the breakout point.
Target 2 (TP2): $3,786, a more aggressive upside target in line with the full measured move of the flag pattern.
The RSI indicator at the bottom reflects a bearish divergence during the latter part of the flag, which led to the current retracement. However, previous bullish divergences in March and April triggered strong upswings, indicating that momentum could return if price breaks above resistance.
The price currently trades at $2,522, below the breakout level, suggesting traders should wait for confirmation of the breakout before entering the trade.
Conclusion:
This chart sets up a high-probability bullish continuation trade. Traders should monitor for a strong breakout above $2,837 with volume confirmation before entering long. Risk management is key, with a tight SL near $2,320 and clear profit-taking zones at TP1 and TP2.
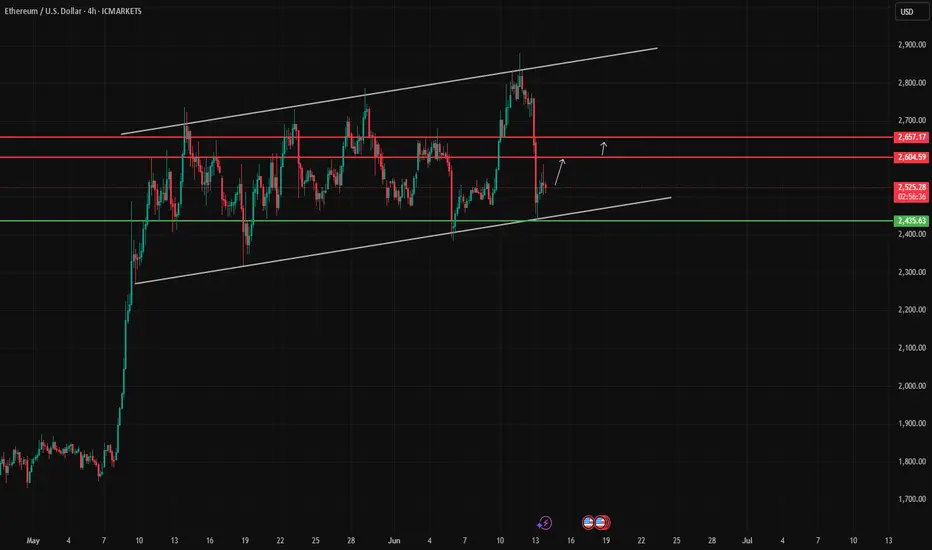
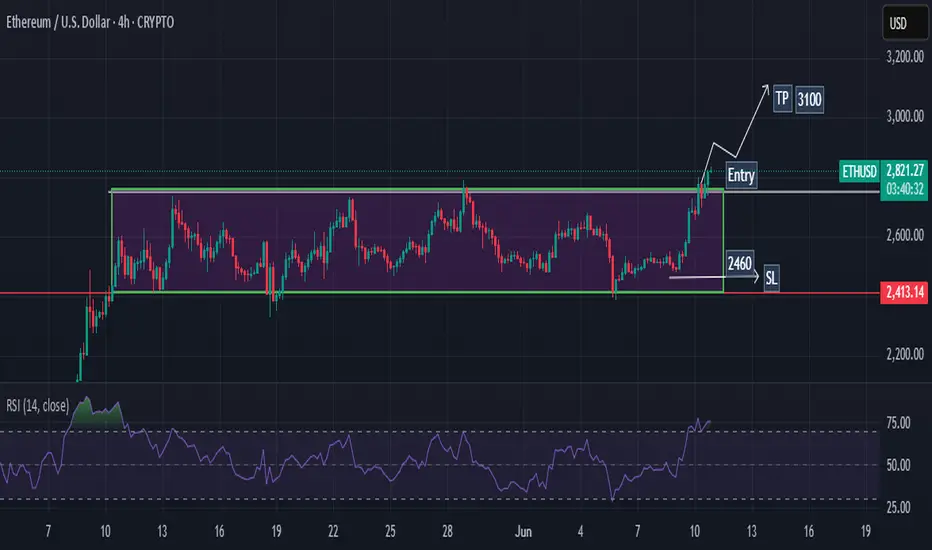
Ethereum / US Dollar (ETH/USD)ETH/USD is trading within a broad ascending channel on the 4H timeframe. The price has recently rebounded from the lower boundary of the channel around 2435.63 and is now attempting a recovery. If this rebound holds, the next bullish targets lie at 2604 and 2657. A break below 2430 would invalidate the bullish setup and could lead to deeper downside pressure.
Retest Flag and Continue Breakout $3500I think this pullback mainly driven by middle east uncertainty is a great gift to buy the pullback on BITSTAMP:ETHUSD
ETH Short to Support or breakout candle retestIf it is and ascending triangle and things are bearish we can go deep into the cloud support
If it's super bullish we will quickly just test the trend line of the last breakout candle
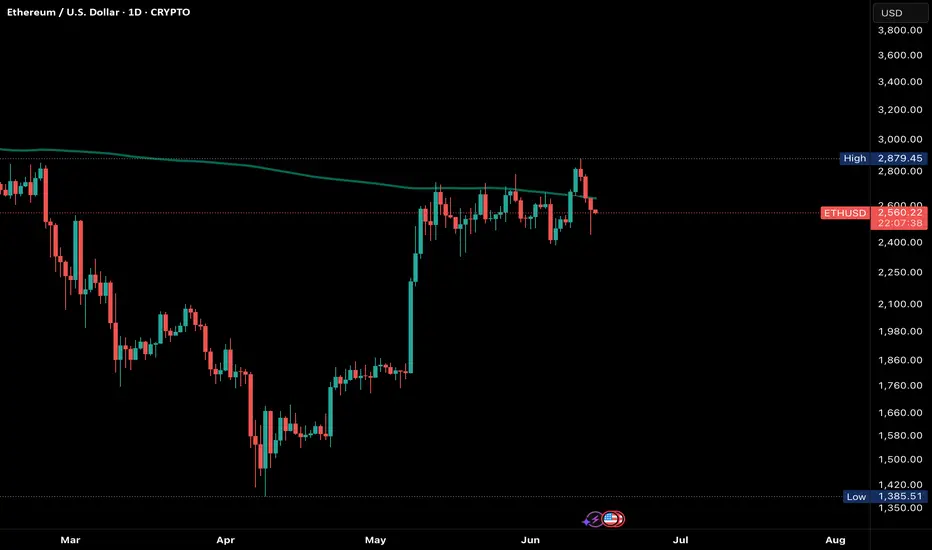
ETH rejecting Daily 200 MA ETH pushed and closed above the daily 200 MA however, it’s most recent closed BELOW. Bullish above, bearish below!
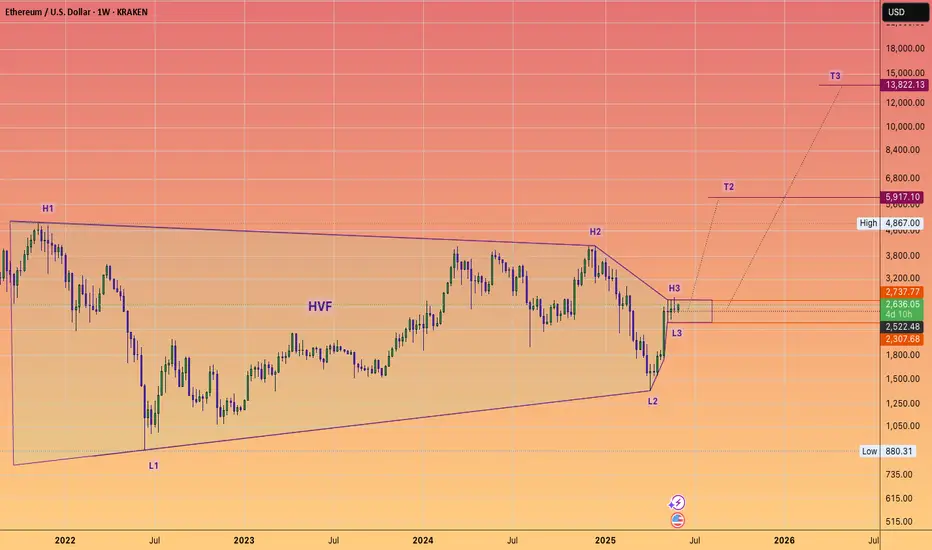
ETH will 5X from HERE! Hit the Like to manifest this.I'm serious hit the like to turn this #HVF into a reality.
I have been monitoring this pattern build out for years now.
BUT we are on the verge on triggering this pattern any day now, and triggering a massive Altcoin run which sucks in capital from all parts of the globe.
@TheCryptoSniper
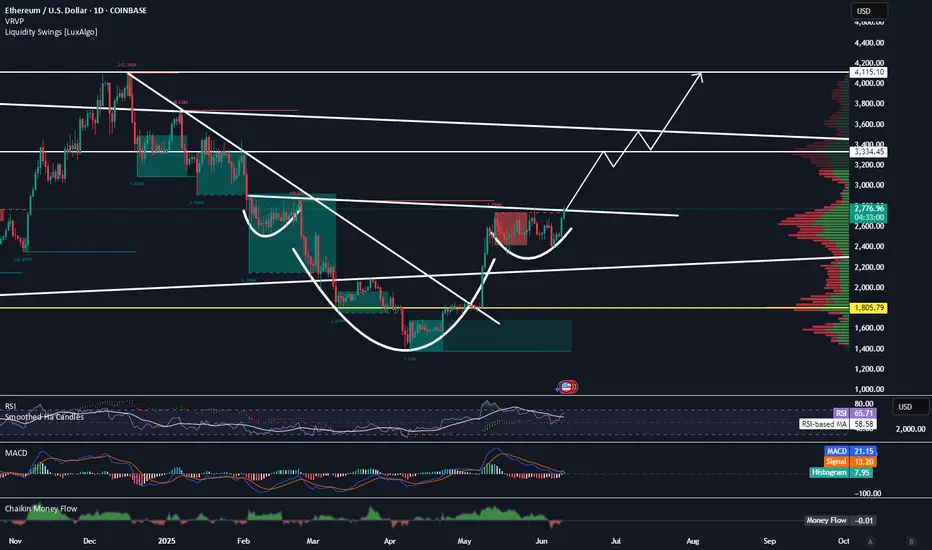
Ethereum Is About to Start Making Its Move to $4100Trading Fam,
Lot's of good patterns occurring on the crypto charts recently, Ethereum is no exception. Here you can see a valid inverse head and shoulders pattern has formed. 85% of the time, these patterns play out.
If we do break that neckline to the upside, I would suggest that $4100 will come fairly quickly. We do have a few resistance areas ahead of us where I expect some pause. But this will only give the market enough time to recognize they may be missing the rocket ride and hop in.
If we don't break that neckline this week, we could pull back for another week. But I think by the end of June our neckline will break and we'll be on our way.
Best,
Stew
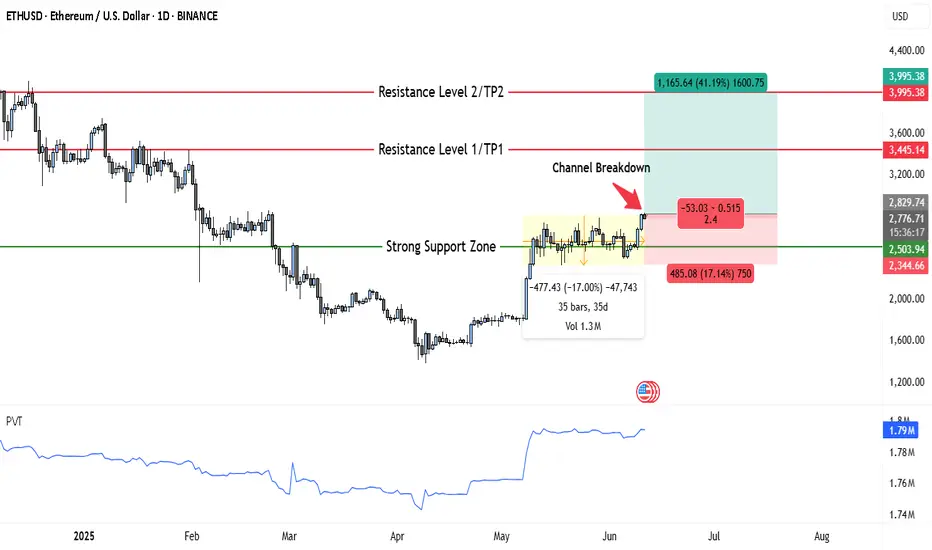
ETH Just Broke Out — Here’s Why $3,445 and $3,995 Are TPsEthereum is showing a strong bullish structure on the daily chart, having recently broken out of a month-long consolidation channel. After spending over 35 days trading in a narrow sideways range between approximately $2,345 and $2,780, ETH has now pushed through the upper boundary of that zone, signaling a shift in momentum.
This breakout from the accumulation zone is significant. The highlighted box on the chart indicates a period of low volatility and tight price compression—often a precursor to a sharp directional move. The breakout candle was decisive and supported by rising volume, as confirmed by the PVT (Price Volume Trend) indicator, which shows a clear uptick in accumulation. This suggests that institutional and smart money may be positioning for further upside.
The reclaimed level around $2,503, previously acting as major support, is now serving as a strong base. If ETH continues to close daily candles above this threshold, the bullish momentum is likely to continue. The immediate resistance lies around $3,445, marking the first target zone (TP1), followed by a more ambitious extension toward $3,995, which aligns with Resistance Level 2 (TP2). These targets represent gains of approximately 21% and 41% from current levels, respectively.
A measured trade setup from the current zone offers a solid risk-reward ratio of 2.4. The stop loss is reasonably placed just below the breakout structure at $2,344. If ETH falls back below this level and closes inside the previous channel, the breakout would be invalidated, and bulls would need to reassess.
This setup aligns with a classic trend continuation pattern—breakout from consolidation, volume confirmation, and a potential retest of the breakout level. As long as price remains above $2,503, bulls remain in control, and the medium-term outlook remains favorable.
In conclusion, Ethereum appears poised for a bullish continuation on the daily timeframe. The channel breakout, rising accumulation pressure, and clean technical structure support the idea that ETH may soon challenge higher resistance zones. However, price must hold above key support to maintain this bias. Traders and investors may view current levels as a favorable risk-entry opportunity with eyes on $3,445 and $3,995 as major profit zones.
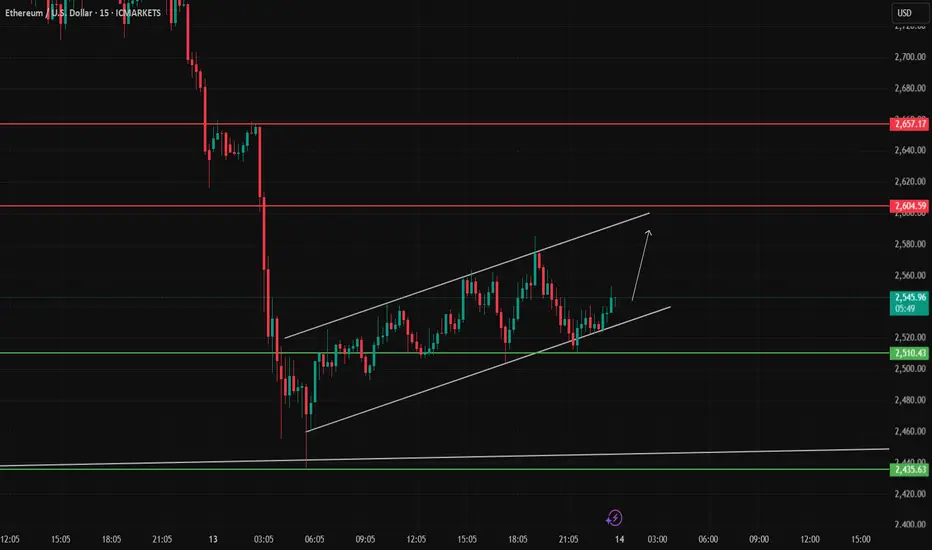
Ethereum / US Dollar (ETH/USD) ETH/USD is forming a short-term ascending channel on the 15-minute chart after a strong rebound from the 2510 level. As long as price remains inside this channel, a move toward 2604 and possibly 2657 is likely. A break below 2510 would weaken this bullish momentum and could trigger a new wave of selling.
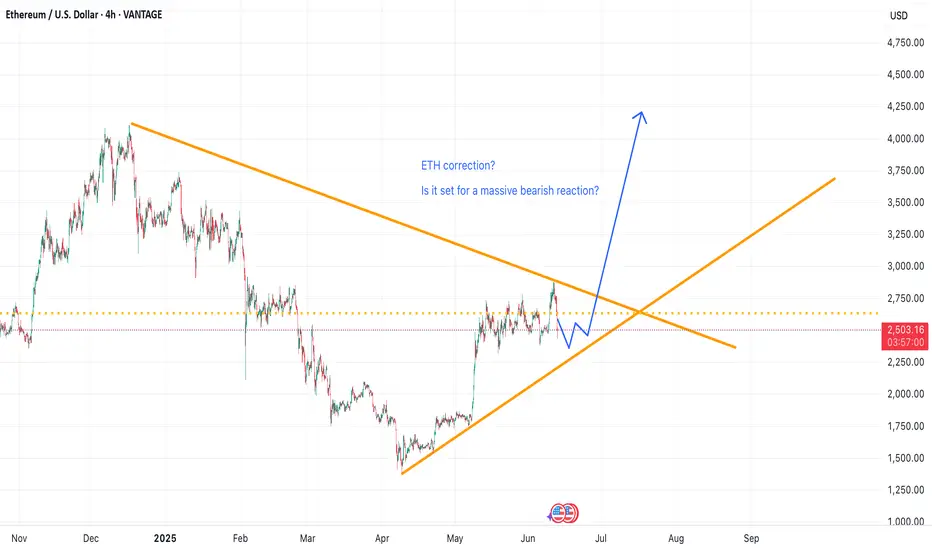
ETH correction set ups big buyAmongst the geopolitical tensions and market uncertainty has ETH just had its big correction before a massive rise in the price?
The 4 hour candle suggests that in the coming days to month it will reach a point at which we will break the trend line in either a bullish reconfimration or a switch to bearish intentions.
I suspect that we will se big price action in the next few days
ETH $700 SWING SHORT MUST SEENext Prediction
$2600 to $3000
$3009 to $2300
⸻
Since the full Wedge failed to play out fully so now if we go up and inside the wedge has a higher higher giving us a huge swing
Target:
$2,300 is the full measured move if the rising wedge pattern plays out cleanly and fully resolves.
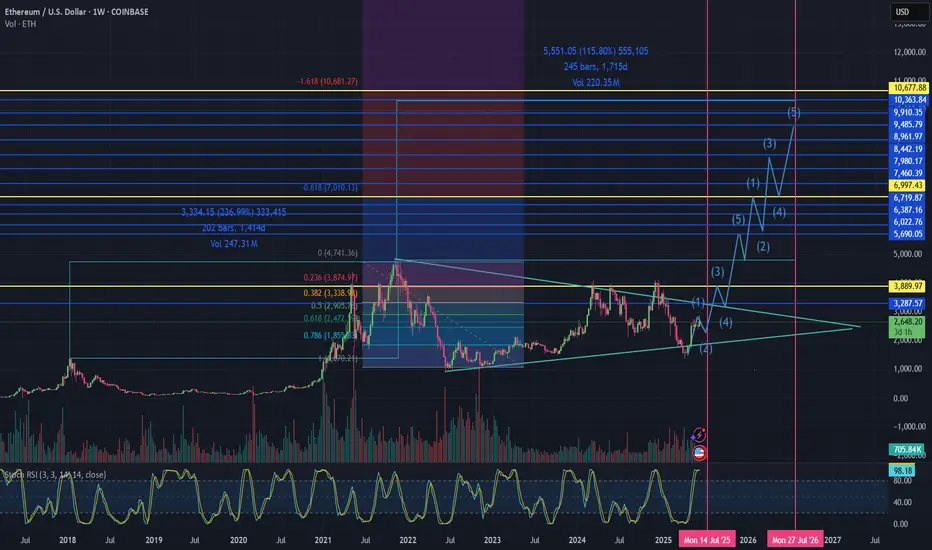
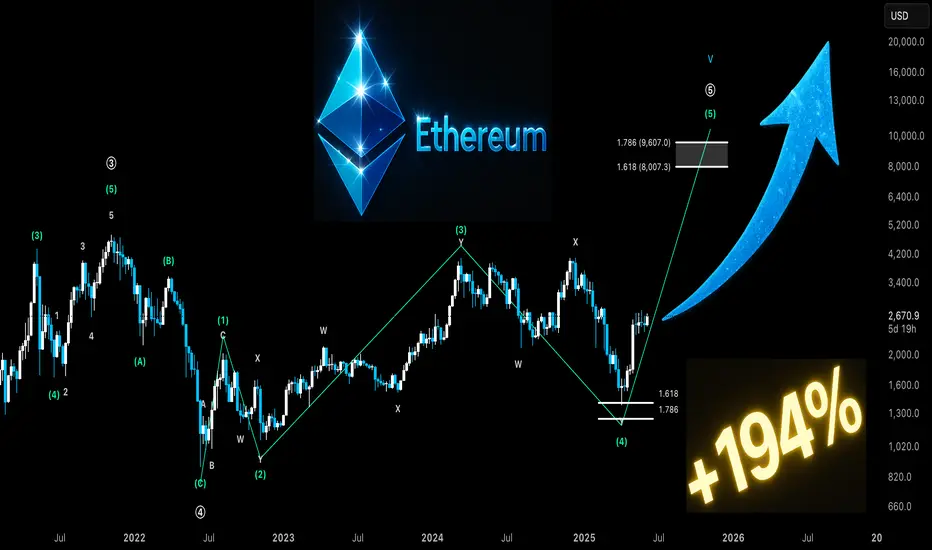
ETH: Ethereum’s Next Big Move! Stablecoin SuperCycle Part 2Ethereum has been moving in 3 wave corrective structures this entire bull market, possibly in an ending diagonal structure. Wave 4 (Green) most likely unfolded as a WXY Double Zig bottoming at the 1.618-1.786 trend based fib extension. Focusing on Wave 5 (Green), a common target of Wave 5 (Green) is the 1.618 to 1.786 fibbonaci retracement between $8,007 and $9,607.
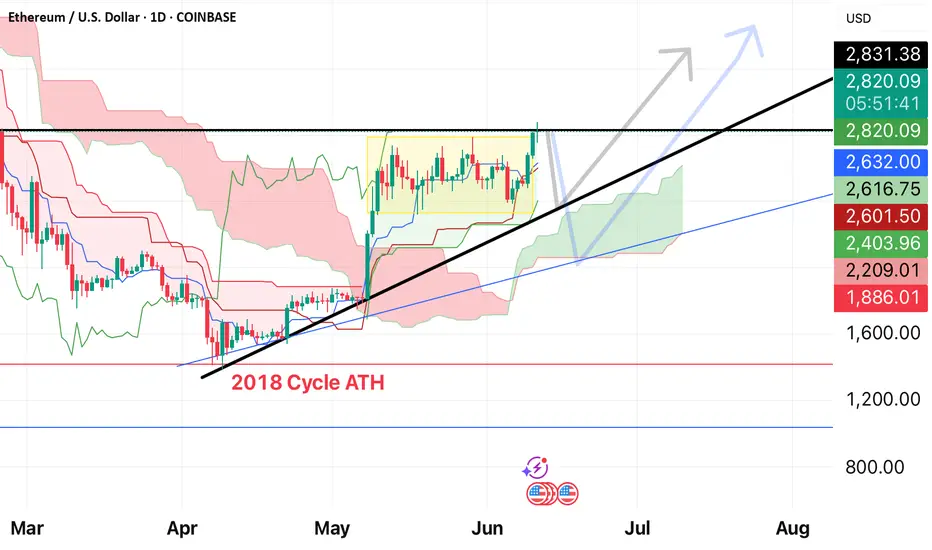
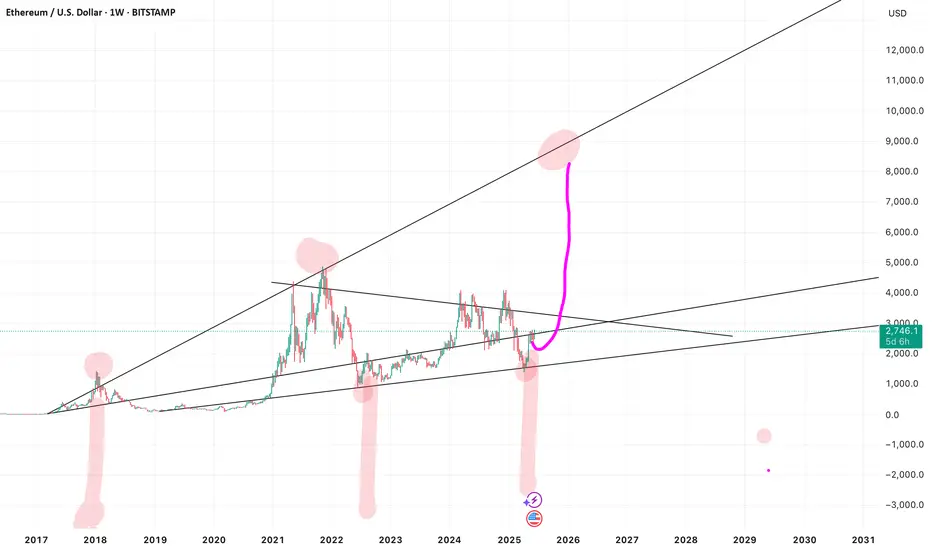
ETH Has Followed an 8+ Year Macro Chart — Why Wouldn’t It Again?Ethereum has respected this long-term trend structure for over 8 years.
Each major breakout, consolidation, and correction aligns almost perfectly with this macro pattern. Every time the crowd calls it dead, it coils, breaks out, and shocks everyone.
We’re now sitting at a familiar inflection point — just like in 2016 and again in 2020.
So ask yourself:
Why wouldn’t history repeat?
Why wouldn’t ETH make its next move from here?
Markets may change, but human behavior doesn’t. And this chart? It’s been whispering the same story for nearly a decade.
Don’t fade the cycle. 🔄
ETHUSDT. Horizontal and Trendline ResistanceStrong weekly horizontal and trendline resistance
breakout is pending and closing with strong volumes
Bearish divergence on 1W TF is still intact
Watch 2800 level closely and beware of bull traps
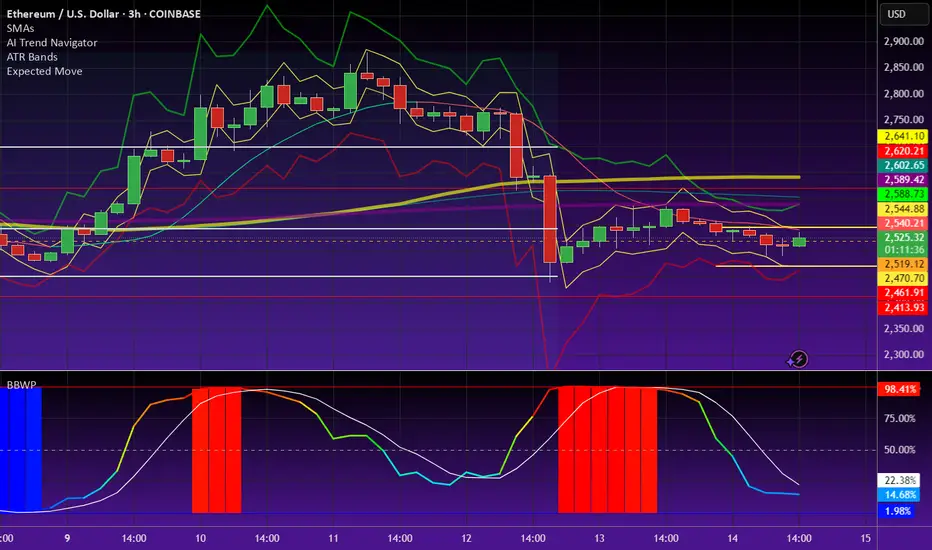
Watching 4H and 30min Reaction
Price is now finding resistance on the 4H at the 200MA, and on the 30min at the 50MA.
On the 4H, the SMA has flattened, and the MLR is starting to flatten too—after price found support at the 0.5 Fib and weekly 200MA.
Buying volume is starting to pick up on both timeframes.
For stop-loss, I’m using push notifications instead of an open order.
Always take profits and manage risk.
Interaction is welcome.
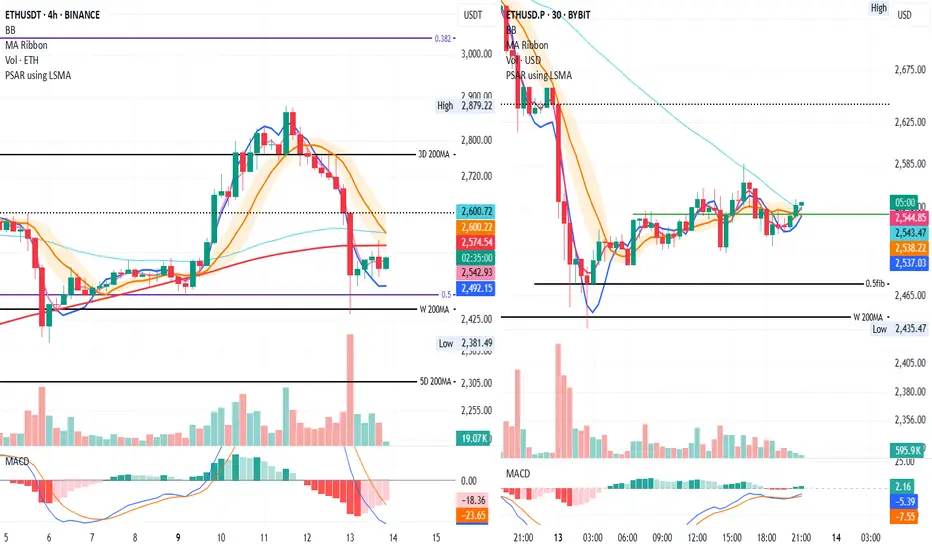
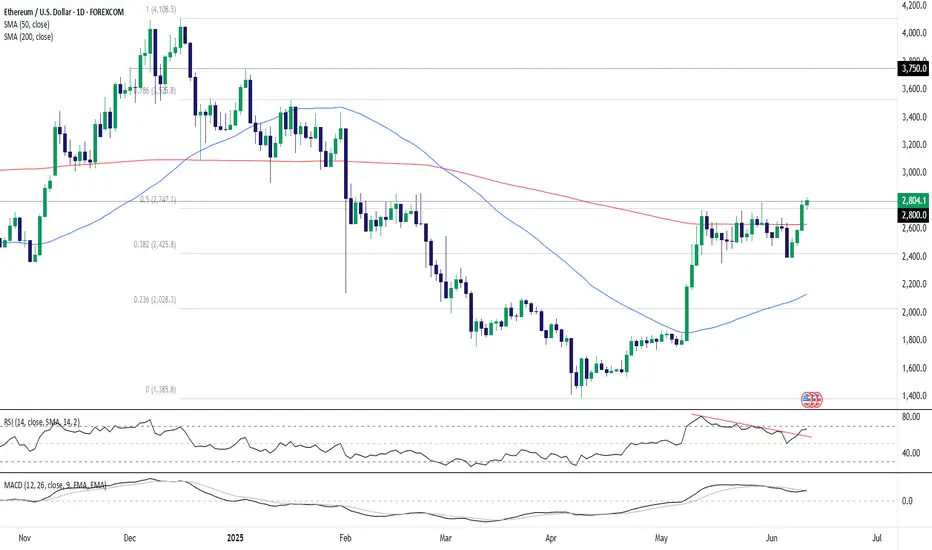
ETH Bulls Back in Play Above $2800ETH/USD has pushed above $2800, a key level it has done significant work either side of going back to 2022. Having broken above the important 200-day moving average earlier this week, and with indicators like RSI (14) and MACD pointing to growing topside momentum, a close above $2800 may encourage other bulls to join in the run higher.
If the price can hold $2800, longs could be established above the level with a stop below for protection. The price action around $2800 during February reinforces the need to see the breakout stick before entering the trade.
$3000 screens as a potential target, as does $3525—the 78.6% retracement of the December–April bear move. Beyond, $3750 was tagged on multiple occasions late last year, making it another possibility before the record highs come into view.
If the price is unable to stick the $2800 break, the setup would be invalidated.
Good luck!
DS