ETHEREUM is stacking up to fly! BINANCE:ETHUSDT ETHEREUM got a lot going for it right now. It's the backbone of a huge chunk of the crypto world, especially with all the DeFi and NFT stuff happening. Plus, there's always talk about big upgrades that could make it even better.
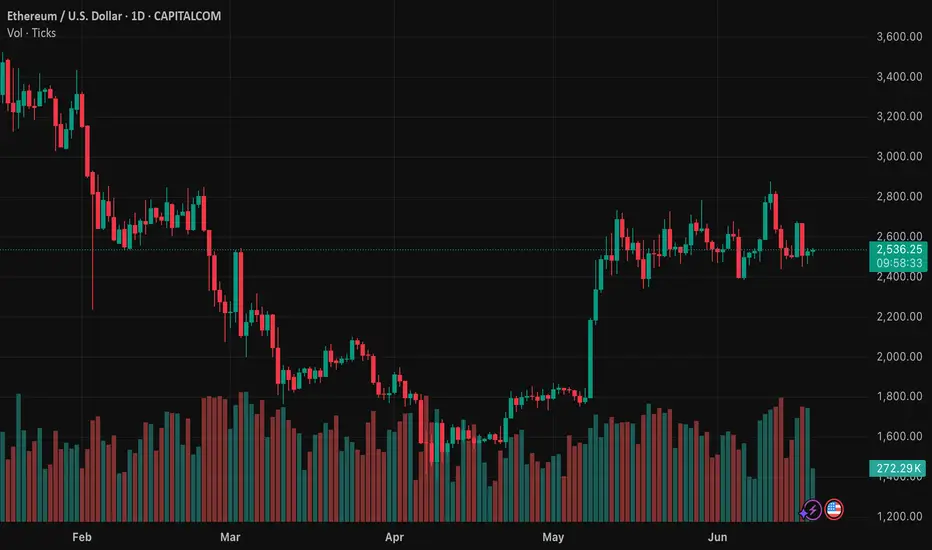
Right now, Ethereum's trading around $2,500, but some experts expect that it could climb way higher, maybe even past $8,000, if everything goes right.
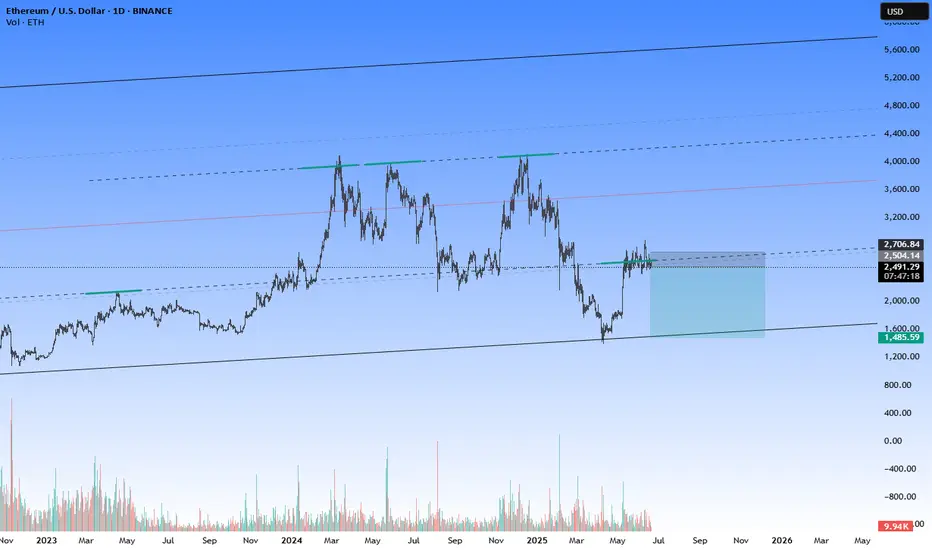
That aside, I personally think $5,000 is achievable and to happen soon. It clearly broke out of the months long downtrend channel and with momentum. There's a lot of hate for ETH just for being expensive. But, let's be real, is not the 2nd biggest player in the market for nothing.
Let me know what you think? Open to counter ideas!
BINANCE:ETHUSDT
ETHUSD.PI trade ideas

ETHUSD: The Market Is Looking Down! Short!
My dear friends,
Today we will analyse ETHUSD together☺️
The price is near a wide key level
and the pair is approaching a significant decision level of 2,512.0 Therefore, a strong bearish reaction here could determine the next move down.We will watch for a confirmation candle, and then target the next key level of 2,501.7..Recommend Stop-loss is beyond the current level.
❤️Sending you lots of Love and Hugs❤️

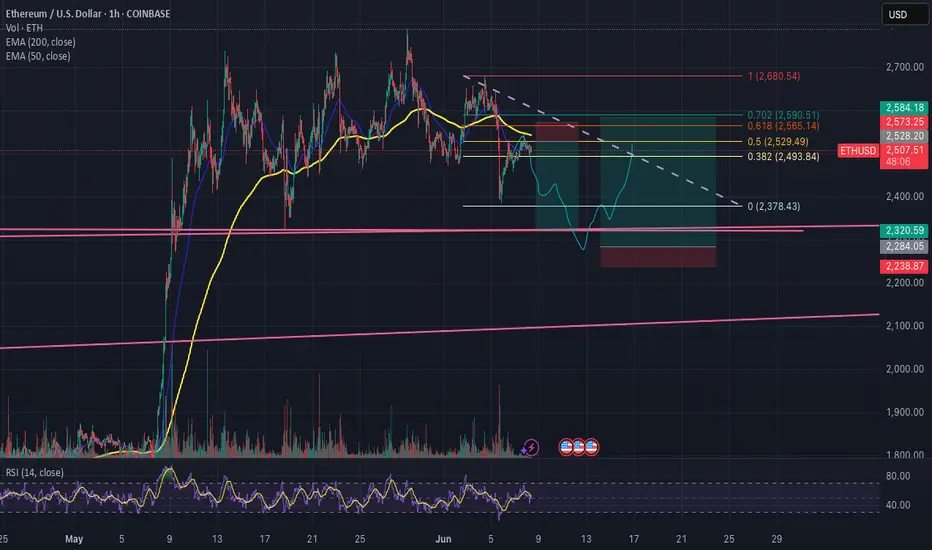
Eth Pull back, looking for longs.
Retesting the 0.05 Fib aligned with the 200EMA, Short to support and look for longs on sweep of support.
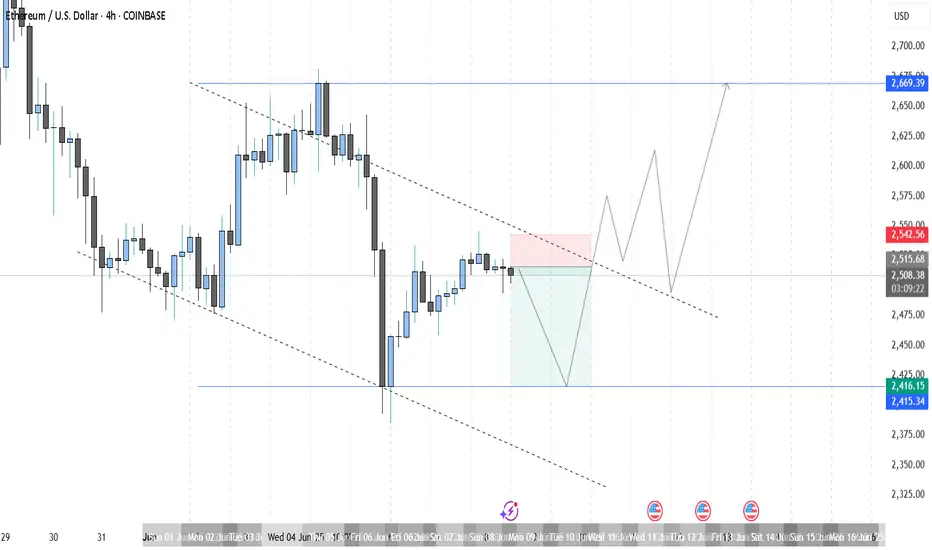
ETHUSD SELLSETHUSD is travelling in a bullish channel however, I am expecting price to sweep low before possibly moving up. 2416 is the sell target
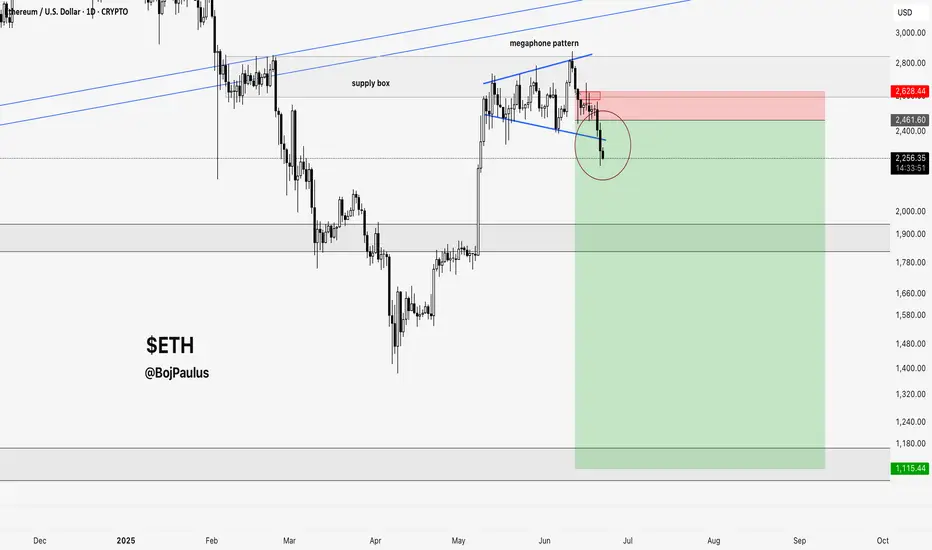
$ETH - The direction has revealed itself! CRYPTOCAP:ETH - The direction has revealed itself! ☠️
The megaphone pattern signals indecision, until it choses a direction.
First target: $1800
Second Target: $1000.
Are you convinced yet?
ETHUSD-SELL strategy 3D chart - GANN Etherium is under pressure, and the many stories predicting crypto becoming very high value, even more we already have observed, makes one wonder. From a technical perspective, it is on the way towards $ 1,750 and I feel we may see lower than that. we are negative medium-term and considering the LONG position and large unloading in BTC last few days, I feel this may be a valid expectation.
Strategy SELL $ 2,250-2,290 and take profit (at first) near $ 1,790.

ETHUSD BUY MARKET 2300-2270 SL: 2225 TP Scalp: 2450 TP2: 2700ETH USD BUY BY MARKET
2300-2270
SL: 2225
TP1: 2450
TP2: 2700 (Updated)
TP3: 3500
1% risk
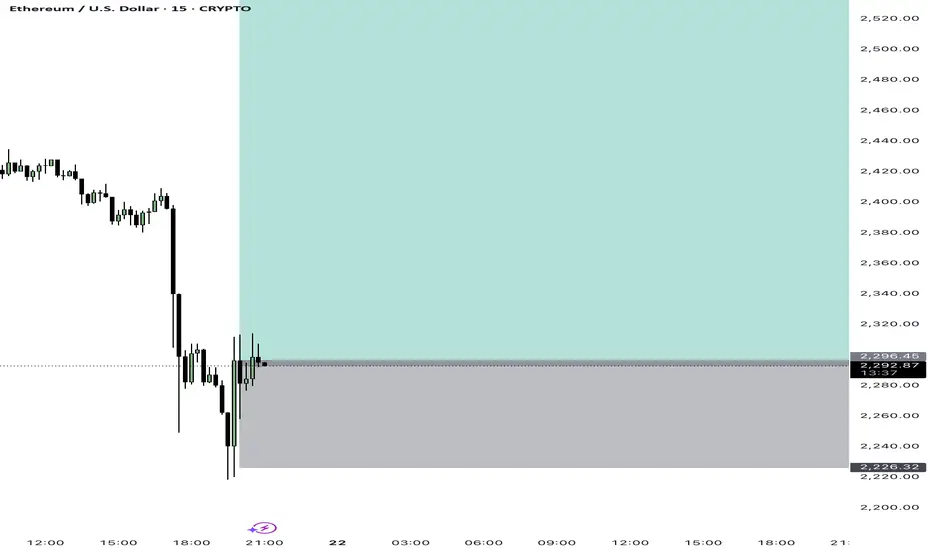
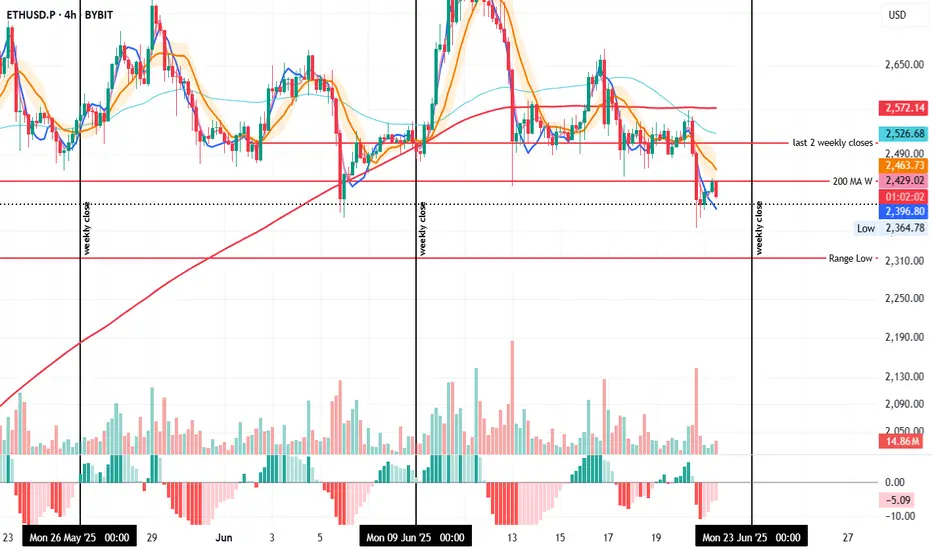
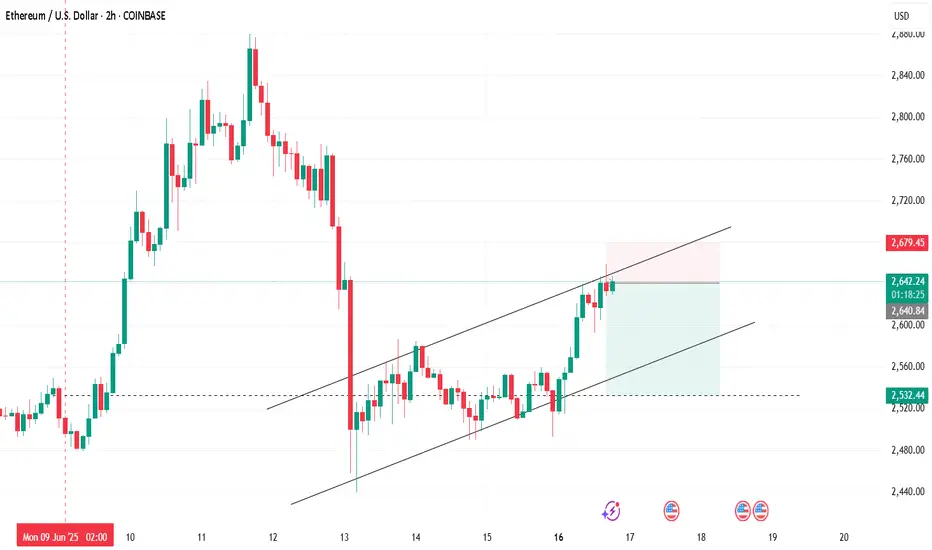
ETH 4H – Testing Support, Rejected by Weekly 200MAOn the 4H, ETH is closing below the weekly 200MA but is trying to hold the last daily close as support—similar to what it did on June 5 at 20:00.
The difference: back then, the 4H 200MA acted as support; now it’s been clearly rejected and price sits well below it.
With the weekly close approaching, if ETH stays under the weekly 200MA, there's a strong chance it revisits the range low support.
However, if it manages to reclaim the 200MA before the close, a move toward the last two weekly closes may still be on the table.
Always take profits and manage risk.
Interaction is welcome.
ETHUSD Potential long ideaThe market made an all time high at 4095.4 following the November bull run. Street money flooded premium prices trying to buy above all time highs. Once price inevitably dropped from that premium level all of the bulls who bought above premium provided not only exit liquidity for longer term traders, but also "resistance" or "supply" levels that are easily recognizable for anyone who wants to double down on their position once the market forms what appears to be a short term low. Seeing this kind of trading occur in the way that it is occurring and at the prices that it is occurring at gives me insight that the market is now going to enter ranging conditions pairing liquidity from both sides of the range.
the market goes right to 01.23.24 low at 2165 and sweeps that level eventually making its way right back to 4097.4 only $2 higher than the all time high. These 3 levels being used in this way to send the market to both sides of a trapped range is done to allow for time to pass and orders to build up.
Since the overall trend of the crypto markets and ETH in general is upward, I am assigning this behavior to institutional accumulation of discount prices. Under this assumption I will look to see a new short term low set in the market. I will see that signature begin when a short term high leads to taking out a htf discount level with an aggressive displacement lower.
I can expect to see these sweeps just above or just below key lows
Key prices to watch
- Sunday 05.18.25 low; 2325
- Friday 05.09.25 H4 +ob; 2350.9
- Daily dealing range C.E; 2271.5
- Daily + Breaker open 2081.5
- M0A_. 1732.5

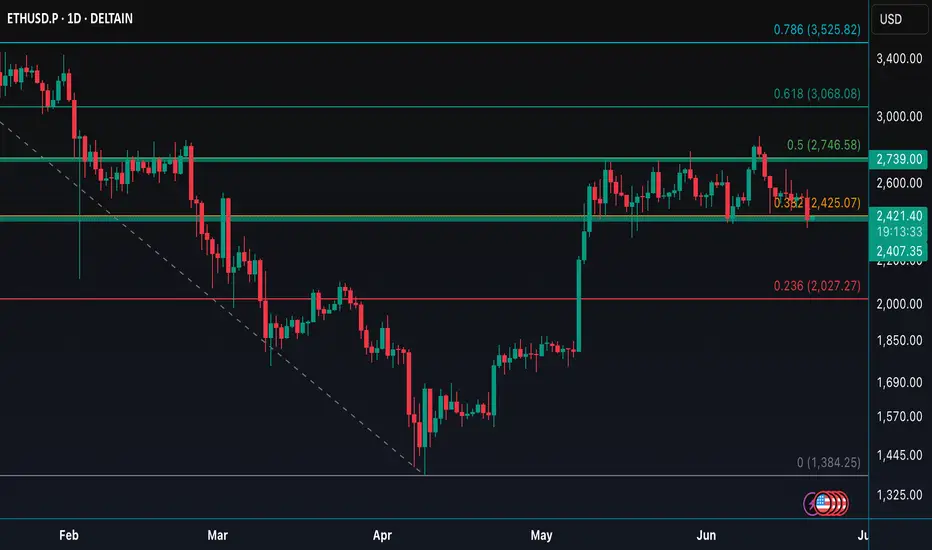
Ethereum’s Wild Ride: From Glory to Grit!🚨 Ethereum’s Wild Ride: From Glory to Grit! 🚨
📉 High: $4108 (Dec 16, 2024)
📉 Low: $1386 (Apr 9, 2025)
📈 Retracement: 50% from the fall
📍 Currently at key Oct ’24 support zone
🧠 Market teaches humility!
Ethereum touched euphoric highs in Dec ’24 at $4108, only to plunge a dramatic 66% to $1386 by April ’25. Since then, we saw a healthy 50% retracement — a classic technical response. Now, ETH has silently tiptoed back to its October 2024 support level. All eyes on whether this zone will hold… or fold. 👀
📊 Price is memory in motion — support tested, will it turn resistance or rally?
⏳ Stay patient. Stay technical.
#Ethereum #ETHUSD #CryptoAnalysis #SupportAndResistance #CryptoTrader #TechnicalAnalysis #MarketUpdate #PriceAction #ChartTalk #CryptoJourney #Blockchain #DigitalAssets #HODLOrFold #SaptharishiAlgo
Market next move 🔄 Disrupted Analysis: Bullish Counter-Scenario
🧠 Original Bias:
The chart predicts a strong bearish move, with a target around 88,000 USD.
The label "Bullish" seems misleading as it’s placed in a steep downward move.
---
📉 Issues With the Original Analysis:
1. Volume Misinterpretation:
Increasing red volume could indicate capitulation or a temporary panic sell-off, not necessarily the start of a new trend.
A bounce could follow if buyers step in.
2. Support Zone Ignored:
The analysis overlooks any previous support levels in the 100k–98k range, where buyers may be waiting.
3. No Confirmation for Breakdown:
The chart does not show a completed breakdown of a key structure or trendline.
The blue squiggle assumes a breakdown will happen, but no technical confirmation is visible.
---
📈 Disruption Scenario: Bullish Reversal Possible
Rejection from 102k zone could be a liquidity grab, not the start of a downtrend.
Hidden bullish divergence on RSI or MACD (not shown here) could support a bounce.
ETH shortTrading involves substantial risk and is not suitable for all investors. Past performance is not indicative of future results. Always conduct your own analysis and consider your risk tolerance before entering any trade.😉😉
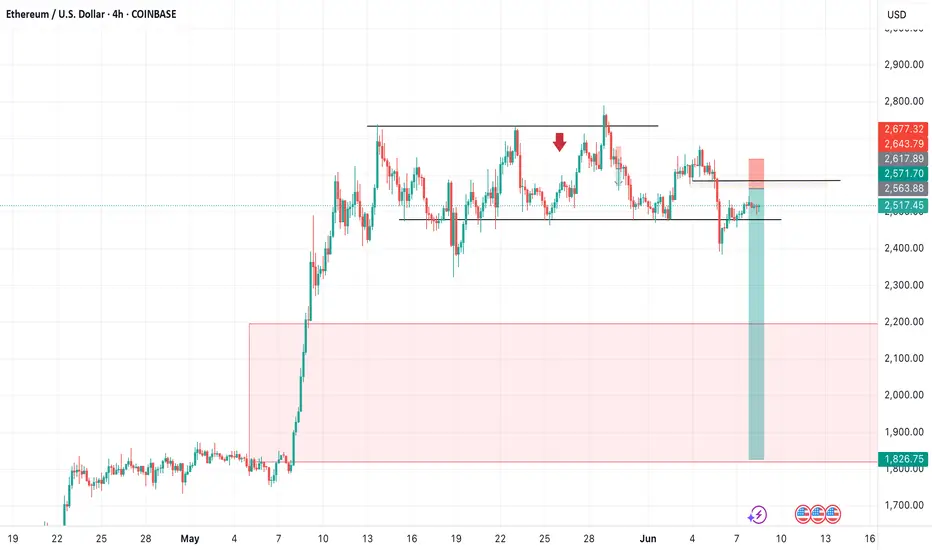
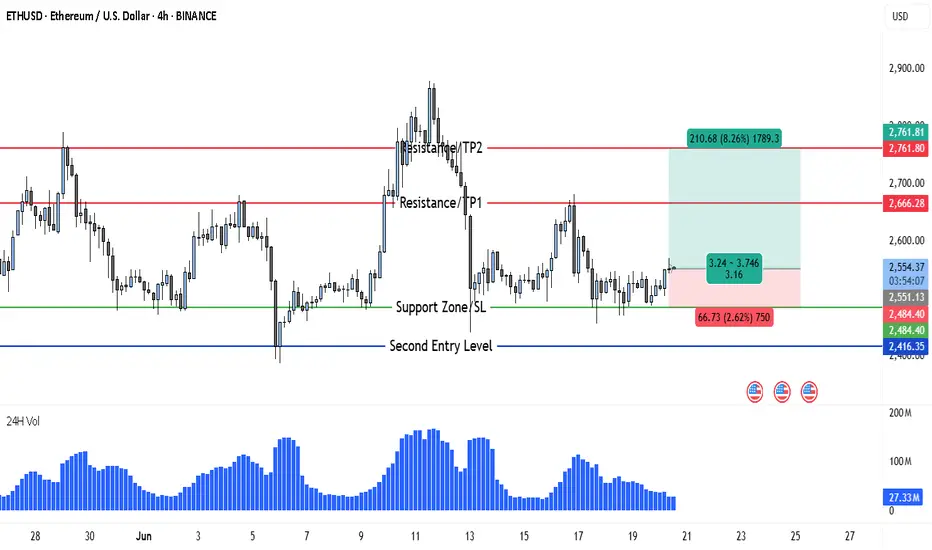
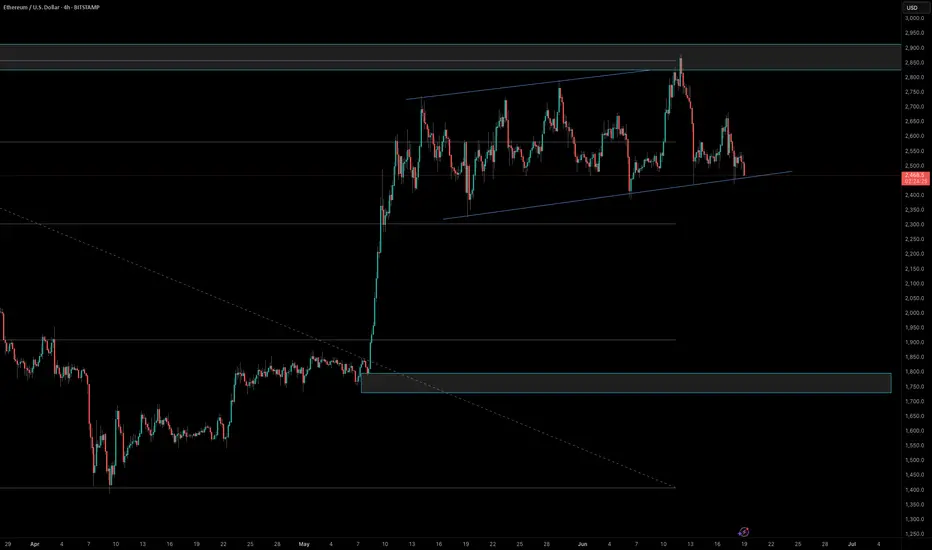
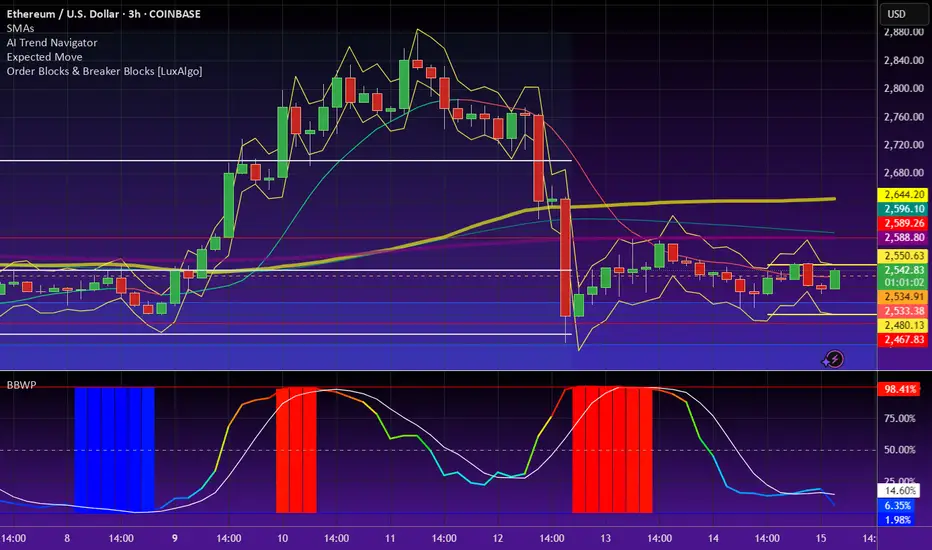
ETH Gears Up for 8% Rally After Holding Key Support at $2,484Ethereum (ETH) is currently positioning itself for a potential bullish breakout on the 4-hour chart. After facing a period of mid-June consolidation and volatility, ETH has stabilized above the key support zone at $2,484–$2,551, which previously served as a strong reaction level. This range has now been retested successfully, and price action suggests growing bullish pressure.
At present, ETH is trading around $2,552, holding just above the defined support, which has acted as both a psychological and technical base. The past few candles show reduced selling momentum and a pattern of accumulation that often precedes a breakout. Buyers are stepping in at higher lows, and this shift in structure could signal the beginning of a new leg upward.
The overall setup suggests that Ethereum is now in a classic breakout-retest formation. Volume, while still moderate, has started to pick up slightly, which strengthens the case for a continuation toward the upper resistance zones. The resistance lines at $2,666 and $2,761 represent short- and mid-term upside targets, both previously tested levels where price struggled to close above. If ETH manages to break past $2,666 cleanly, a move to $2,761 becomes increasingly likely.
🔹 Trade Idea (Buy Setup)
• Entry Point: Around $2,552
• Stop Loss: $2,484 (placed just below the major support zone and recent reaction low)
• Target 1 (TP1): $2,666
• Target 2 (TP2): $2,761
• Risk-to-Reward Ratio: ~1:3.16
• Upside Potential: 8.26%
• Downside Risk: 2.62%
This trade setup provides a high-probability long opportunity, with a clearly defined support zone backing the entry. The stop loss at $2,484 gives the trade sufficient breathing room while minimizing downside risk in case of short-term volatility.
There is also a second entry opportunity defined at $2,416, should the market dip unexpectedly before continuing upward. However, this entry is more aggressive and should be approached with flexible risk management — the stop loss for this reentry point is not fixed and should be adjusted as per the trader’s individual risk appetite.
What further strengthens the bullish case is that this reentry zone aligns closely with a historical swing low that previously triggered a strong bullish reversal. If price tests this level again, it may offer a last-chance opportunity for buyers before a larger move unfolds.
The double target strategy — TP1 at $2,666 and TP2 at $2,761 — reflects realistic profit zones based on past price structure and market behavior. Both targets lie within resistance levels that saw significant reaction in recent trading sessions, making them ideal zones for partial or full profit-taking depending on price momentum.
In the broader context, despite ETH’s recent 10% drop, the asset’s ability to hold above the $2,480–$2,500 region demonstrates resilience. This range now acts as a solid foundation from which bulls could initiate a breakout, especially if macro conditions (like BTC strength or positive ETH-related news) align in coming days.
In summary, Ethereum presents a clean long setup from $2,552 with targets up to $2,761, backed by technical support, improving volume, and a bullish price structure. A secondary entry is available at $2,416 for those with higher risk tolerance. If momentum builds above $2,600, ETH could rapidly revisit prior swing highs — and this chart structure makes a compelling case for being prepared ahead of that move.
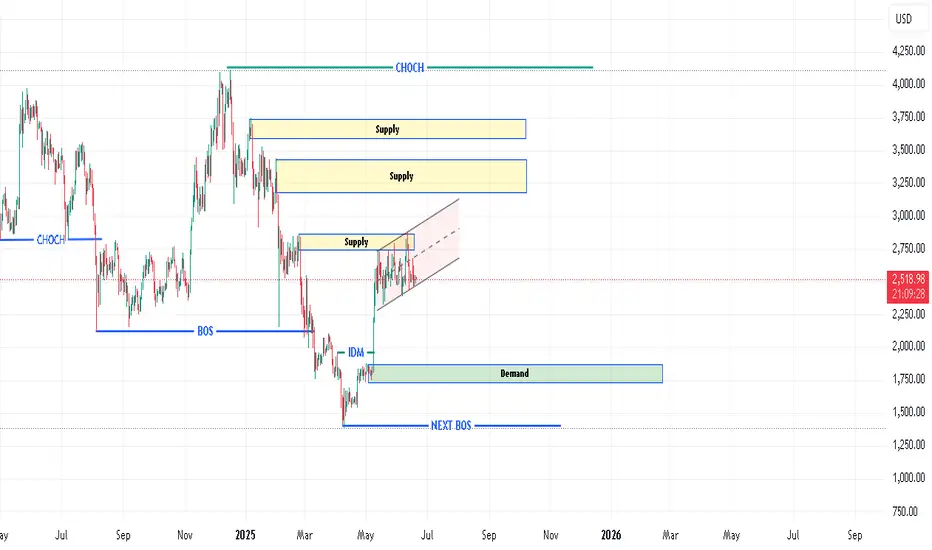
ETH SMC perspectiveDaily SMC is Sell (IDM Taken) , but there is fresh supply above( You are a buyer or seller ? ) hehe
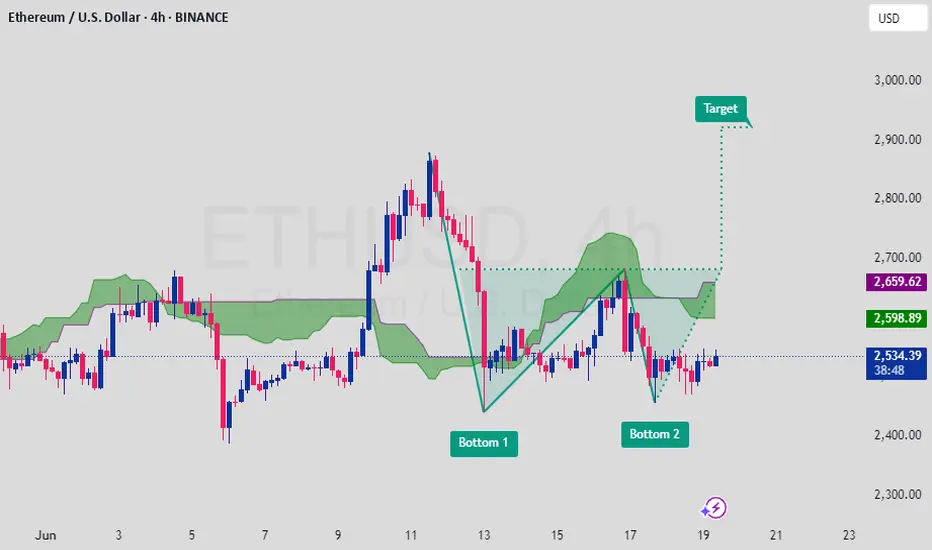
ETHUSD Double Bottom Formation SignalsBullish Reversal PotentialEthereum (ETH) is forming a Double Bottom pattern on the 4H chart, a classic bullish reversal setup. Price is attempting to hold above the neckline and Ichimoku cloud support, indicating momentum may shift upward toward the next resistance zone.
🔹 Pattern: Double Bottom
🔹 Current Price: ~$2,533
🔹 Breakout Confirmation Level: ~$2,598
🔹 Target: ~$2,900 based on measured move
🔹 Technical Outlook: Price holding above key support and eyeing breakout
🔹 Fundamentals: Improved market sentiment, ETH ETF buzz, and network upgrade expectations support upside
Bullish scenario developing – confirmation on breakout above resistance could trigger strong momentum toward target. 📈🚀
Note :If you found this helpful, like and follow for more trade ideas!
Share My Idea With Your Firends Mention Your Feed back Comment Section
This is not financial advice. Please conduct your own research and manage risk accordingly.
ETHUSD is moving within the 2390.00 - 2880.00 range 👀 Possible scenario:
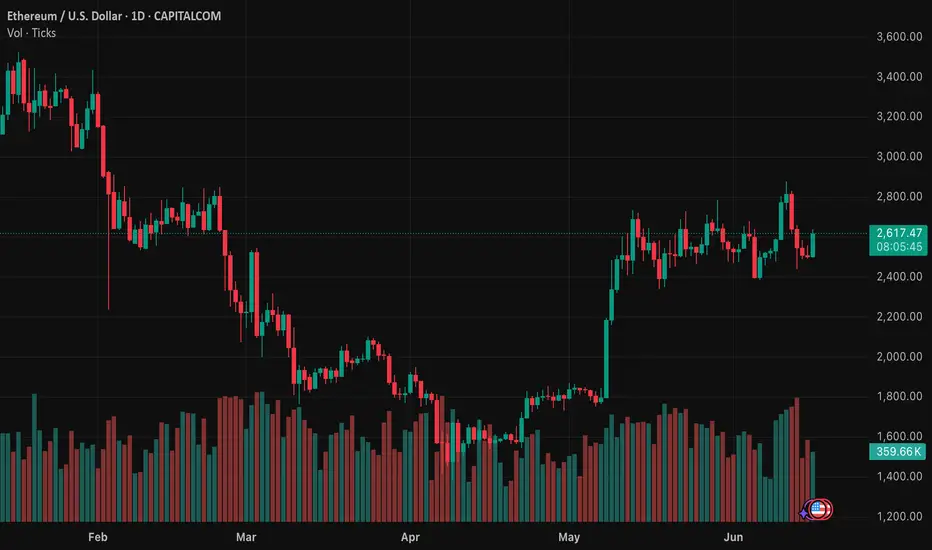
Ethereum dropped to $2,530, down 9.4% on the week, as market uncertainty weighs on momentum. Despite the pullback, over 35 million ETH (worth $89B) is now staked—an all-time high. While accumulation is surging too, with large wallets scooping up 800K+ ETH daily. On June 12 alone, whales bought 871K ETH—the biggest single-day haul this year. Ethereum’s liquid supply is shrinking as staking grows, aided by SEC guidance easing regulatory concerns. Lido, Coinbase, and Binance remain top staking providers.
The Pectra upgrade and Arbitrum’s ArbOS 40 rollout bring key enhancements like account abstraction and better L2 scaling. A golden cross is forming on ETH’s chart, but price remains under pressure amid geopolitical tensions.
✅Support and Resistance Levels
Support level is now located at 2,390.00.
Now, the resistance level is located at 2880.00.
ETHUSD Sell off is possible.Price tested valid resistance multiple times and formed an ascending channel.
Daily brake and close below this channel, consider its still under construction. Buy the dip!
ETHUSD is moving within the 2390.00 - 2880.00 range 👀 Possible scenario:
Ethereum dipped to $2,440 on June 13 but rebounded to trade near $2,640 on June 16. Despite muted price action, institutional and whale interest remains strong. Crypto funds saw $1.9B in net inflows last week, marking the ninth consecutive week of gains, per CoinShares. Ethereum-focused funds brought in $585M, with U.S. spot ETFs accounting for $528.2M, though the 19-day inflow streak ended Friday with minor outflows. Whale wallets (1,000–100,000 ETH) added 1.5M ETH over 30 days, a 3.7% increase, now holding 41M ETH—around 25% of supply. Retail investors, meanwhile, took profits as ETH trades 45% below its all-time high.
Network activity is also up: Ethereum Name Service usage surged 300%, lending protocols 200%, and USDC transfers on Layer 2s like Base, Arbitrum, and Optimism saw triple-digit growth. With growing institutional flows, active Layer 2 usage, and whale accumulation, Ethereum may be quietly building momentum for its next breakout.
✅Support and Resistance Levels
Support level is now located at 2,390.00.
Now, the resistance level is located at 2880.00.
Ethereum LP Range TighterVolatility has continued to decline, enabling us to tighten the liquidity provision range on Ethereum within the Base network, as indicated by the horizontal red lines. However, trading volume in ETH remains relatively low, which is resulting in minimal fee generation from the pool, we expect that to change: app.uniswap.org
Pattern TradingJust some Ideas on Trading patterns. Going over curve ideas and how to manage trading ranges or breakouts

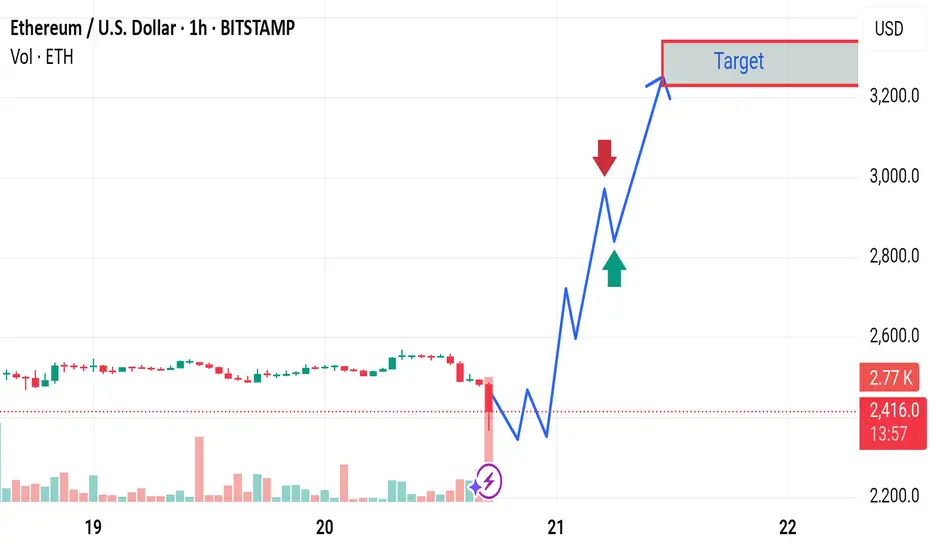
Long Setup After Accumulation BreakoutAfter a clear accumulation phase, we've seen a manipulation spike followed by distribution. Price has now pulled back to the top of the previous accumulation zone, which I view as a strong demand area.
I'm entering long from this pullback with a target around $3,000.
