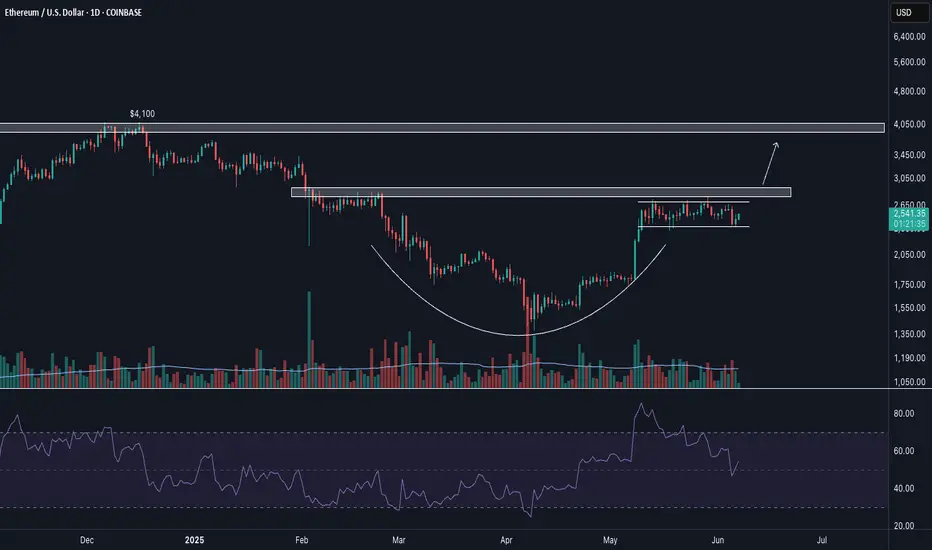
Cup w/ HandleFour week handle forming. Looks ready to go for a breakout for the ATHs shortly. RSI reset
ETHUSD.PI trade ideas
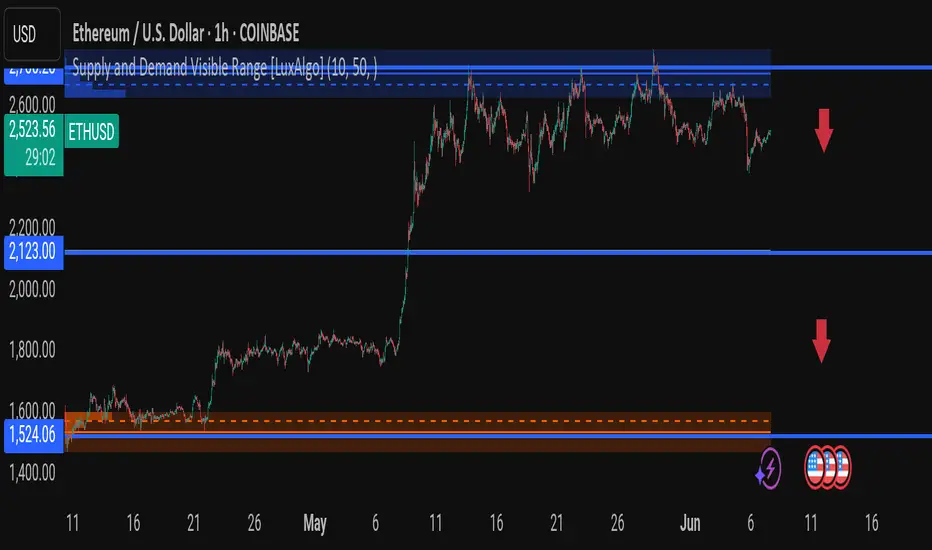
ETHUSD 1H – Supply Zone Rejection! Will Ethereum Retest $2,100 Ethereum is currently trading at $2,524, just below the critical supply zone between $2,560 – $2,600, where price has been repeatedly rejected. The bulls are showing signs of exhaustion – is a deeper correction on the horizon?
🔵 Major Technical Zones:
🔹 Resistance (Sell Zone): $2,560 – $2,600
🔹 Mid Support: $2,123
🔹 Key Demand Zone: $1,524 – $1,600 (High-Volume Buy Area)
📉 Bearish Scenario (Likely if rejection holds):
A failure to break above $2,600 could lead to a breakdown toward $2,123.
If $2,123 doesn’t hold, $1,524 is the next target — a zone with historical demand and a previous breakout base.
🧠 Volume Profile Insight:
Notice how volume increases around $1,524, indicating strong buyer interest in this zone. The space between $2,100 and $1,524 is thin — expect fast movement if $2,100 cracks.
📆 Key Dates:
Economic events marked on the chart (June 11–16) could act as catalysts for volatility.
---
💬 Do you think ETH will break above the supply or is this the calm before the drop? Share your analysis below!
#Ethereum #ETHUSD #CryptoAnalysis #PriceAction #SupplyDemand #LuxAlgo #SmartMoney #TradingView
ETHUSDETHUSD
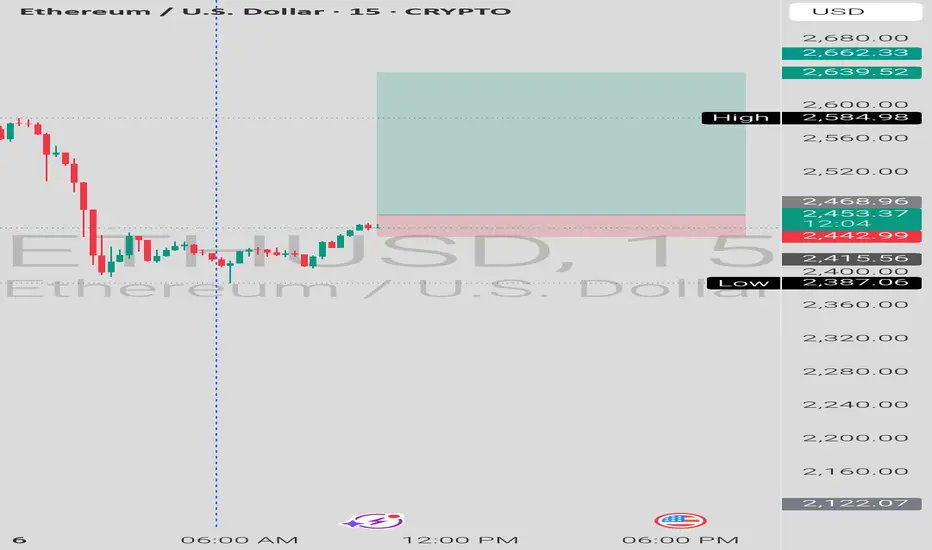
ETHUSD 2500 -2490 acting strong long zone after that profits books , if hold above 2526 and above then we see the good movements of upside till 2600/2660 and many more.
This is educational purposes.
Follow for more daily update.
Tune with me 🙂
One for the books!!!I love learning and expanding my knowledge and experience. The trader that wants to keep on growing and learning despite being successful in this industry that trader will always be the best trader.

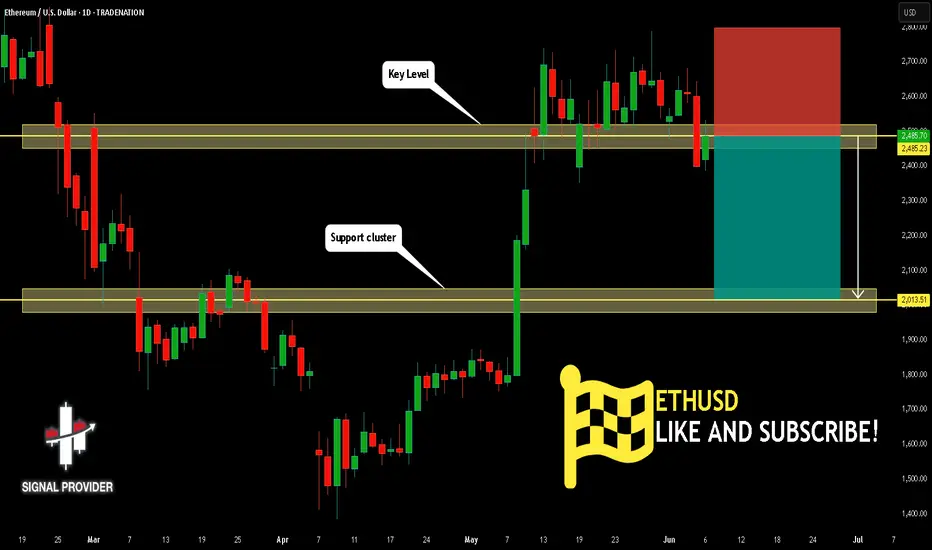
ETHUSD Is Going Down! Sell!
Here is our detailed technical review for ETHUSD.
Time Frame: 1D
Current Trend: Bearish
Sentiment: Overbought (based on 7-period RSI)
Forecast: Bearish
The market is trading around a solid horizontal structure 2,485.23.
The above observations make me that the market will inevitably achieve 2,013.51 level.
P.S
We determine oversold/overbought condition with RSI indicator.
When it drops below 30 - the market is considered to be oversold.
When it bounces above 70 - the market is considered to be overbought.
Disclosure: I am part of Trade Nation's Influencer program and receive a monthly fee for using their TradingView charts in my analysis.
Like and subscribe and comment my ideas if you enjoy them!

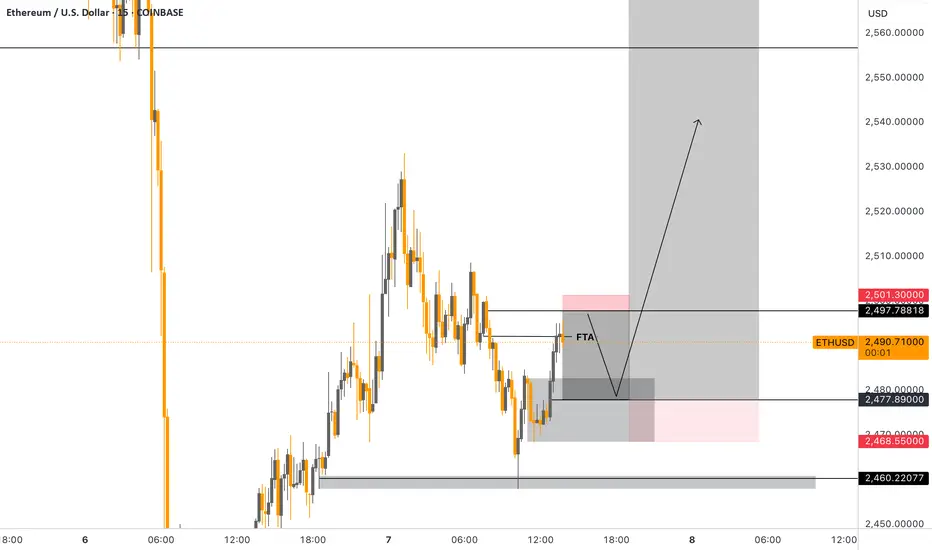
ETHUSDETHUSD – Bearish Sell Setup (AUTH Liquidity Model)
ETHUSD is currently in a retracement phase after rejecting from a recent high. Price action is approaching a zone rich in overhead liquidity, offering a clean short opportunity based on AUTH (Areas of Liquidity) principles.
⸻
Key Elements of the Setup:
FTA – First Trouble Area:
A minor demand zone just below current price where a short-term reaction could occur. This is not the main target, but a potential bounce point.
Inversion Point:
A previously supportive level that now acts as resistance. Often, this is where trapped buyers from earlier rallies exit, fueling momentum for further downside.
VAL – Value Area Low:
A historically high-volume area where price previously consolidated. It often acts as a target for rebalancing moves.
AUTH Liquidity Zones:
• Above price: Stacked buy stops above recent highs and wick clusters
• Below price: Sell-side liquidity in the form of equal lows, trendline bounces, and inefficient zones
The setup anticipates a sweep of upper liquidity before a drop into deeper value.
⸻
Execution Idea:
The setup favors a short entry after liquidity above is cleared and bearish confirmation prints on a lower timeframe. The goal is to enter after price rejects from high liquidity and begins targeting value and imbalance zones below.
⸻
Disclaimer: This is a technical idea shared for educational purposes only. It does not constitute financial advice. Always perform your own analysis and manage risk responsibly.
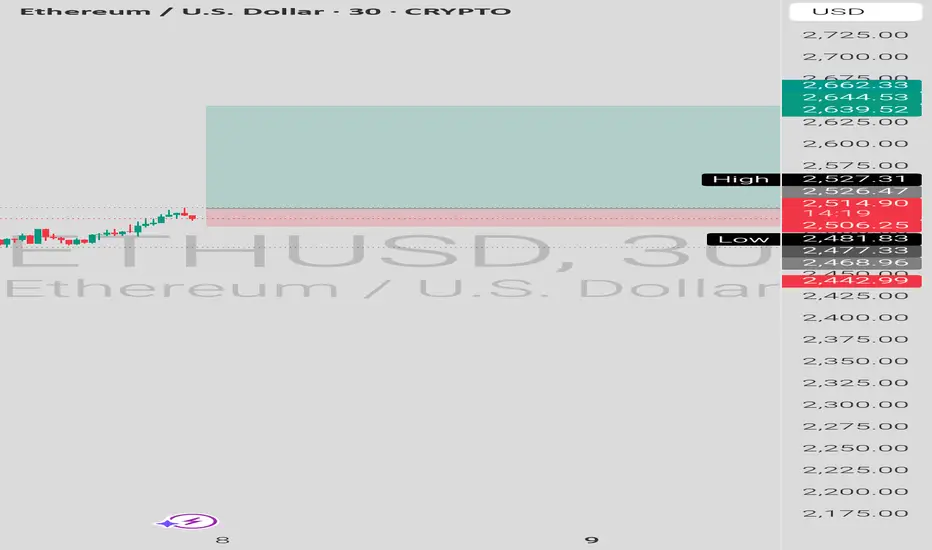
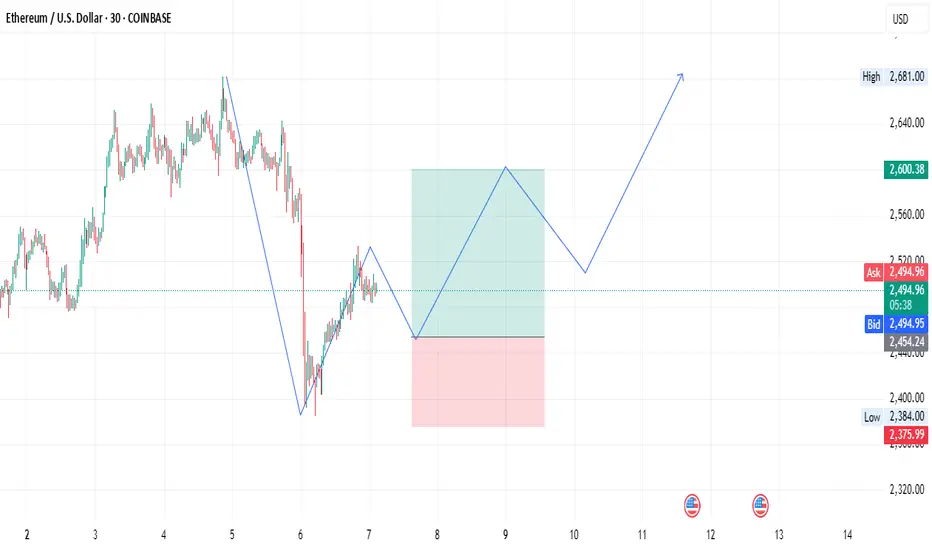
ETH/USD Long Setup – Bullish Reversal in Play📅 Date: June 7, 2025
⏱ Timeframe: 30-Minute (COINBASE)
📊 Pair: Ethereum / U.S. Dollar (ETH/USD)
💡 Trade Idea Summary:
Ethereum is showing signs of a bullish reversal after a strong corrective move. Price has formed a potential higher low structure and is preparing for a bullish continuation.
🔹 Entry: $2,454
🎯 Target: $2,600
🛡️ Stop Loss: $2,376
⚖️ Risk-Reward Ratio: ~1.9:1
📈 Technical View:
Recent downtrend appears exhausted with a clear bounce from the $2,384 zone.
Break of lower highs indicates shift in momentum.
Expecting a short-term dip to retest the higher low before continuation towards $2,600.
Ideal for swing traders or short-term bullish setups.
📌 Trade Management Tips:
Watch for bullish confirmation near $2,454 before full entry.
Trail stop if price breaks above $2,520 for risk reduction.
Avoid the trade if price closes below $2,376 on the 30m chart.
🔔 Disclaimer: Not financial advice. Always do your own research and manage risk appropriately.
eth thoughtsIm looking at charts and just randomly trying to see thing that may line up with a theory that the cycle maybe over.
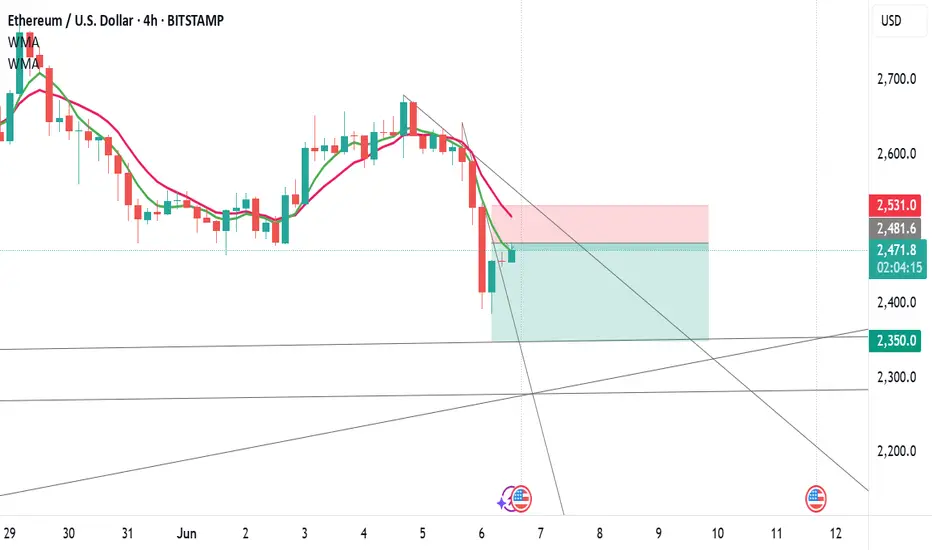
ETHUSD KEY LEVEL.This is the 4 hour chart of ETHUSD.
ETHUSD is currently consolidating in a well defined range.
If the lower boundary of the zone is sustainable ,then we see again higher prices in ETHUSD.
Thank you !!
EthusdIt looks the Ethusd is now forming W4: the last wave of ABC.
I am waiting to break the last support to get a signal W5 of C is done.
Then , we could see the formation of W5 .

ETHUSDETHUSD
ETHUSD at the lower support levels,
From here adding volumes on the long side,
With BOUNCBACEK.
This is educational purposes.
Follow for more.
Tune update.
Downside Risk Ahead: ETH Drops Below 20-Day MA
The last few candles show strong red bodies, suggesting selling pressure.
Price has closed below the middle Bollinger Band (20-day moving average), often a trigger point for downside momentum. This suggests a transition from neutral/bullish to bearish momentum.
Recent highs failed to break the previous peak near $2,900. This forms a lower high, indicating weakening buying strength.


Ethereum (ETH/USD) Technical Analysis — Bearish Rejection Below 🔍 Ethereum (ETH/USD) Technical Analysis — Bearish Rejection Below Resistance ⚠️
📅 Date: June 4, 2025
📊 Chart Type: 2-Hour Timeframe
💱 Exchange: Binance
---
🧠 Overview:
The chart displays a clear range-bound market between well-defined resistance and support zones. The most recent price action suggests a rejection from the resistance region, hinting at a possible downward move toward support.
---
🟧 Key Levels:
Resistance Zone: $2,720 – $2,760
Price has tested this zone multiple times and failed to break above decisively.
Marked as a strong supply area where sellers dominate.
Support Zone: $2,460 – $2,490
This area has historically attracted buying interest, causing price reversals.
---
📉 Market Structure & Price Action:
The recent swing high formed a lower high relative to the peak on May 29, suggesting bearish momentum.
A projected bearish move is marked on the chart with a blue arrow 📉, forecasting a drop from around $2,640 down to the support zone near $2,480.
Multiple failed attempts to break resistance signal a potential trend continuation to the downside within this trading range.
---
⚠️ Trading Implications:
Short-term bias: Bearish 🔻
Confirmation needed: A breakdown below $2,600 with volume would strengthen bearish conviction.
Target for bears: $2,480 support area
Invalidation zone for this outlook: A breakout and close above $2,760 would shift the bias to bullish.
---
📌 Conclusion:
Ethereum is currently trading within a well-defined horizontal channel. With the latest rejection near resistance, the probability favors a move down to the support area. Traders should monitor key levels closely for confirmation before entering positions.
📈 Tip: Use proper risk management and watch for candlestick confirmation at critical levels.

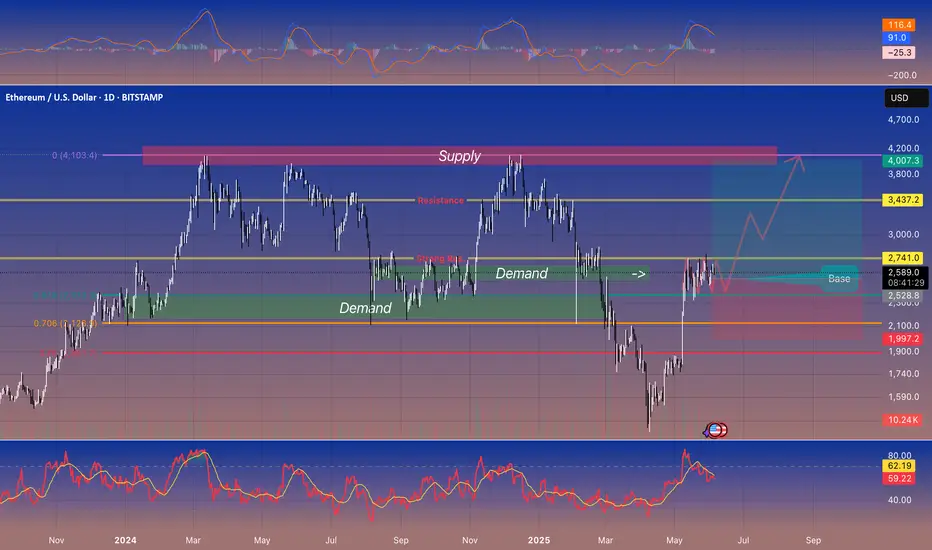
Ethereum (ETHUSD) • Daily • Trading ideaEthereum (ETHUSD) • Daily Chart 🚀
---
🔑 Key Levels
* Demand Zone (Support): \$2,350–2,550
* Price has bounced here twice in the last year.
* Immediate Resistance: \$2,741
* Multiple rejections around this level recently.
* Next Major Resistance: \$3,437
* Former highs in late 2024/early 2025.
* Big Supply Zone (Strong Sell Area): \$4,000–4,200
---
💡 What’s Happening?
* ETH is sitting in a “base” between \$2,528–2,741 (green box).
* If it breaks above \$2,741 on strong volume, it can run toward \$3,437 and eventually \$4,000+.
* If it falls below \$2,528 (demand), the next support is around \$1,997.
---
🎯 Trade Idea
* Bullish Entry: Buy on a daily close above \$2,741 + higher-than-usual volume.
* First Target: \$3,437 (take partial profit).
* Final Target: \$4,000–4,200 (major sell area).
* Stop-Loss: Below \$2,500 (just under support).
* Bearish Scenario:
* If price drops below \$2,528 with big volume, look for a possible move down toward \$1,997.
---
📈 Indicators (Confirmation Only)
* Volume: Watch for a spike on any breakout above \$2,741.
* MACD & RSI: If both are rising (not overbought), it adds confidence—though price and volume matter most.
---
👍 Summary
ETH is coiling in a strong support zone. A clean break above \$2,741 on good volume can send it to \$3,437, then \$4K+. If support fails, \$1,997 is next. Trade with proper stops and watch volume for confirmation.
— Feel free to leave a 🚀 if this helps!
#Ethereum #ETHUSD #Crypto #Support #Resistance #Volume
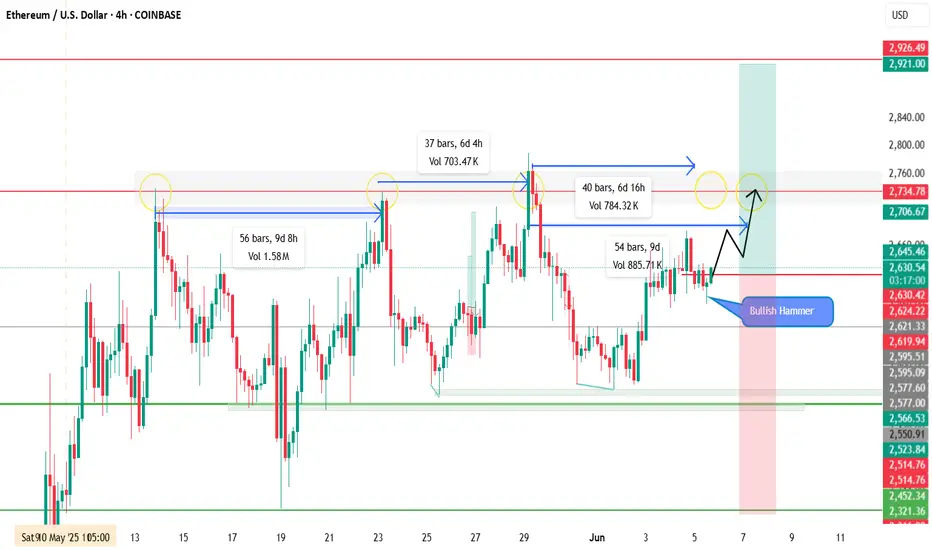
ETHUSDETH is showing signs of a potential resistance retest, echoing previous price behavior. On the 4H chart, historical data suggests ETH typically revisits resistance zones within 6–9 days (±). The pair has been ranging between support and resistance, and a strong bullish hammer has just formed — signaling a potential shift in momentum.
📍 Entry: Market (Instant)
🛑 Stop Loss: 2312
🎯 Take Profit: 2913 (1:1 Risk-Reward)
📊 Plan: Trade aligned with historical timing and price structure. Entering on bullish confirmation.
⚠️ Note: Manage risk accordingly — structure looks promising, but always respect your stop.
Ethereum has reached its bottomKey support trendline should offer spring towards the next bullish wave.

ETHUSD – 4H Chart AnalysisPrice has reached a key resistance zone around the 2,700 level. The market structure suggests potential for a downward move from this area, forming lower highs and indicating selling pressure.
📉 Sell Idea
Entry: 2,605
Target 1: 2,506
Target 2: 2,398
Target 3: 2,303
Stop Loss: Above 2,725
Structure-based trade setup with risk-to-reward in favor of sellers. Will be watching for confirmation through bearish price action on lower timeframes.
⚠️ This is not financial advice. For educational and analysis purposes only.

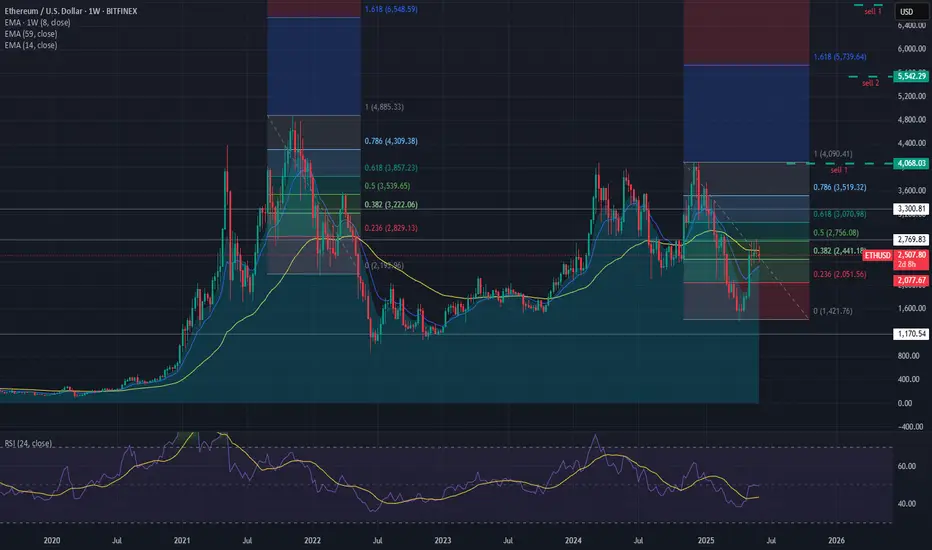
$ETH Broadening Wedge TargetCRYPTOCAP:ETH reached its technical target of $4K from the ascending triangle (Jul '22-Oct '23).
CRYPTOCAP:ETH appears to be back in the multi-year range between $1.9K-$4K.
If the Bull Market continues, the current macro pattern could develop into a flat top broadening wedge with a target of $11.7K.
Invalidation if it fails to break $4K, or falls to Hades.

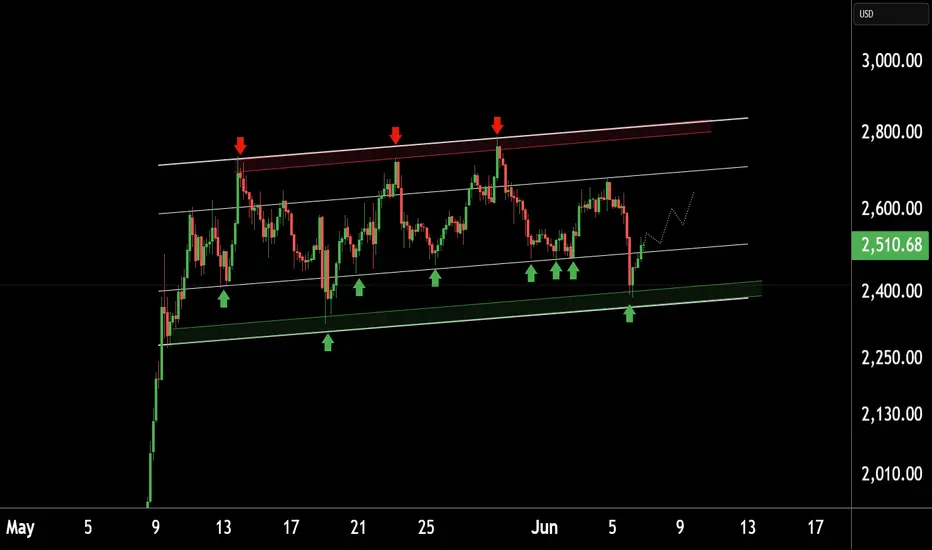
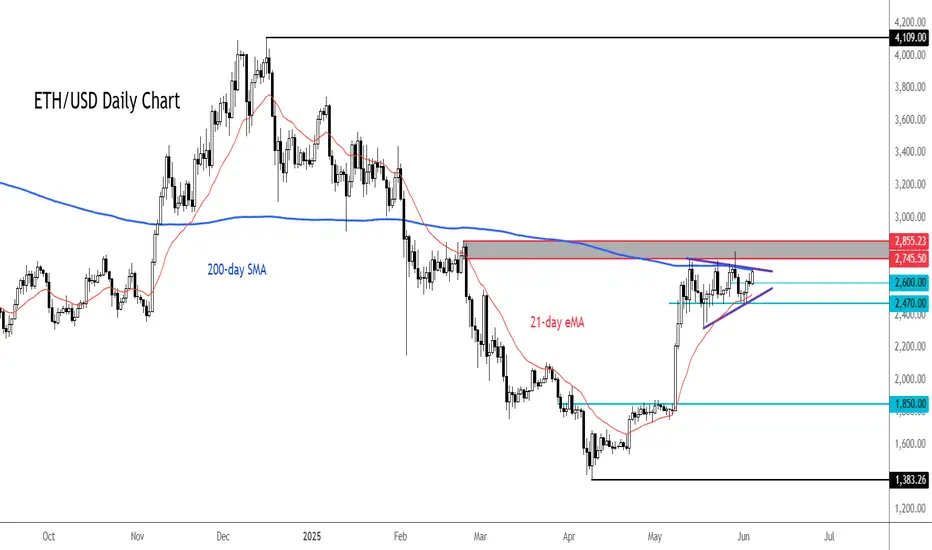
ETH/USD gearing up for potential breakoutThe ETH/USD has been coiling inside a bullish continuation pattern for several weeks now and a breakout could be on the cards soon. The consolidation suggests ETH is gearing up for a potential breakout soon, as it chips away at resistance coming from the 200-day moving average near $2700.
Further resistance is seen between $2745 to $2855, as shaded in grey on the chart. If it gets through this area of resistance in the coming days, then a big breakout could be on the cards, with the first stop likely around $3,000, but we could go much further than that over time, given the length of the current consolidation.
However, it is essential that the ETH/USD doesn't break the support trend of the consolidation pattern and key support at $2470 now. If it does, then that would invalidate the bullish price structure.
By Fawad Razaqzada, market analyst with FOREX.com
ETH at a Critical Decision Level – $2260Ethereum is currently showing strong price action around the key decision level of $2260. This zone will likely determine the next major move:
A breakout above could trigger a bullish continuation.
A rejection here may send ETH down, possibly all the way toward $1000 in the long term.
📌 Stay tuned — we'll update you as the move unfolds. Keep in touch!
