Ethereum climbing, but RSI throwing shade stay sharpGuys, I’ve also put together an Ethereum analysis for you.
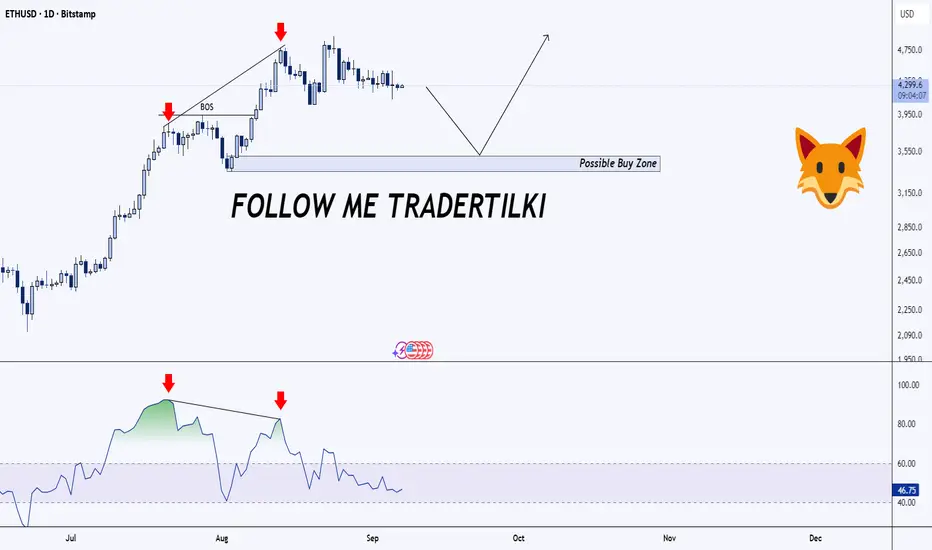
Ethereum is an amazing coin that’s not up for debate. But it’s already climbed quite a bit. I haven’t bought in at this point, but if it drops to the 3,538.0 – 3,357.0 range, I’d definitely be looking to buy.🔥
Right now, we’re in an uptrend, but on the 1‑day chart I spotted a divergence on the RSI indicator. It looks like this divergence might be playing out. If the price falls below the 4,000 level, that would confirm the divergence is in effect.
Guys, I would like to thank everyone who supports my analyses with their likes. Your likes boost my motivation, and that's why I share these analyses.
ETHUSD trade ideas
ETH/USD: Could $5,000 Be Just Around the Corner?Ethereum (ETH) is currently trading at $4,285, experiencing a slight decline from the previous close. Intraday, it reached a high of $4,474 and a low of $4,261. The $4,300–$4,400 range has been acting as a key support zone, and a breach below this could see ETH testing the $4,000 level, with the 50-day EMA providing additional support. Immediate resistance is observed around $4,530, and a successful breakout above this level could pave the way for a move towards $5,000.
Market sentiment shows the Relative Strength Index (RSI) approaching overbought territory, indicating potential for a short-term pullback. Significant institutional accumulation continues, with firms like BlackRock increasing their ETH holdings. The approval of Ethereum ETFs in the U.S. and Australia has led to increased investor participation, contributing to upward price pressure.
Short-term volatility is expected as ETH tests these key support and resistance levels. A breakout above $4,530 could signal a bullish continuation towards $5,000, while a drop below $4,000 may lead to further downside. Long-term prospects remain positive, supported by growing institutional interest and favorable market conditions.
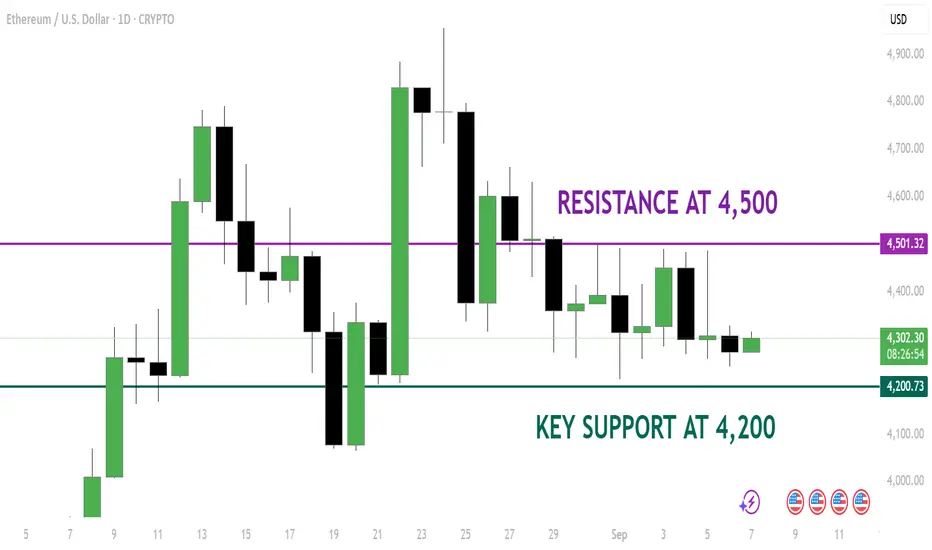
Ethereum (ETH/USD) Daily UpdateETH had a strong rally through July–August, but now price is consolidating between $4,200–$4,500.
✅ Bullish Case
If ETH holds above $4,200 support and breaks past $4,500 resistance, we could see momentum carry toward $4,800–$5,000 next.
❌ Bearish Case
If ETH loses $4,200 with a strong close, watch for a deeper pullback toward $3,950–$3,800.
🎯 Takeaway
ETH is in a sideways consolidation after a strong run. The next breakout from this range will likely decide the next big move.
👉 Are you leaning bullish continuation or bearish pullback here?
Don't forget to follow me, boost this post and comment your ideas.
-Neo
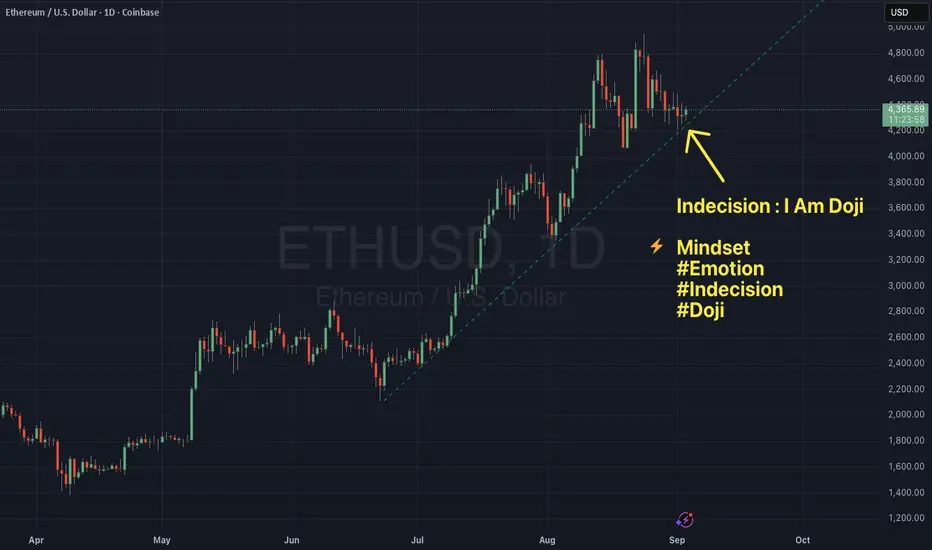
Indecision - The Human Experience of Being A DojiContext : Daily Chart ETHUSD.
Uptrend intact.
Price sitting right on the trend line.
Price consolidating into a series of dojis.
Imagine this scenario.
You have a plan.
You're a trend trader.
You're looking to get long.
You start to observe the context…
We’re into September.
Tech showing signs of correcting.
Gold heading up.
This chart... right here, right now is consolidating.
And so you experience a little flicker.
A small niggle …
There it is.
The voice of doubt.
"I should get long but maybe this is the one that gives way".
You feel a moment of indecision.
And you’re stuck frozen
The human version of a doji.
Indecision has a cost and takes a toll.
Not just in lost opportunity BUT in energy and confidence.
A simple practice to help guard against this:
Pre-decide the conditions.
Write down before you enter what tells you to stay in and what tells you to step aside.
Separate the signal from the noise.
Notice the flicker of doubt, but act on your plan, not the passing thought.
Doubt will always show up.
The edge comes from knowing what you’ll do when it does.
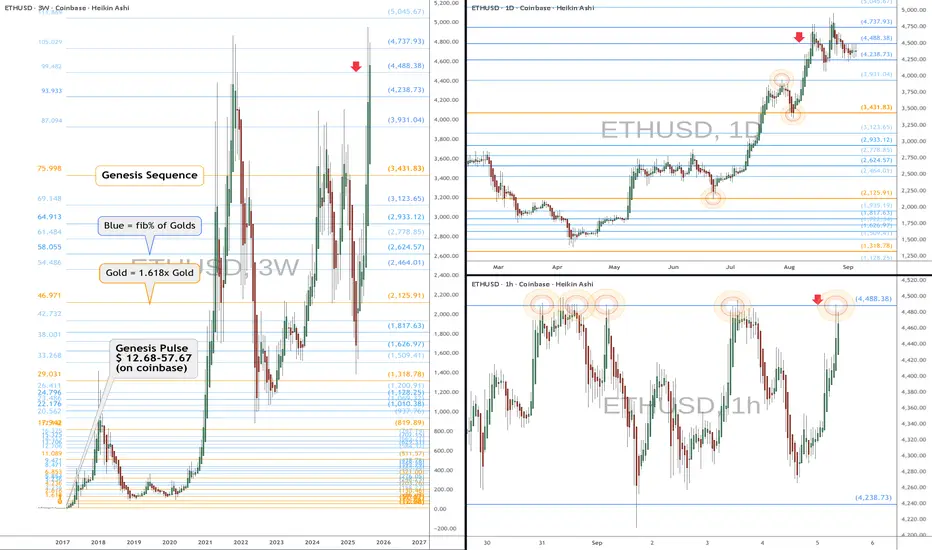
ETH eyes on $4488: Proven Genesis Fib holding up new ATHETH has been consolidating near its highs.
Banging its head into a Genesis Fib at $4488,38
Break could be VIOLENT, rejection could be DOOM.
See "Related Publications" for previous charts that NAILED key levels.
===========================================================
.
ETHUSD BUY NOW 4280🟢 ETHUSD – Bullish Setup at 4280 Long Opportunity
Ethereum is showing strong bullish momentum, bouncing off key demand near 4280, with buyers stepping in aggressively. Price action confirms support holding, and technical indicators suggest continuation toward higher resistance zones.
🔹 Trade Idea: BUY ETHUSD @ 4280
- Entry: 4280
- Stop Loss: 4215 (below recent demand zone)
- Take Profit: 4450 / 4600
- Risk/Reward: ~2:1
📊 Technical Confluence:
- Bullish structure intact above 4267 support
- MACD crossover and RSI trending upward
- Price respecting ascending trendline
- Volume spike confirming buyer interest
💬 Narrative:
ETH continues to consolidate within a rising channel, with institutional interest and positive sentiment driving upside. A clean break above 4450 could open the path to 4600 and beyond.
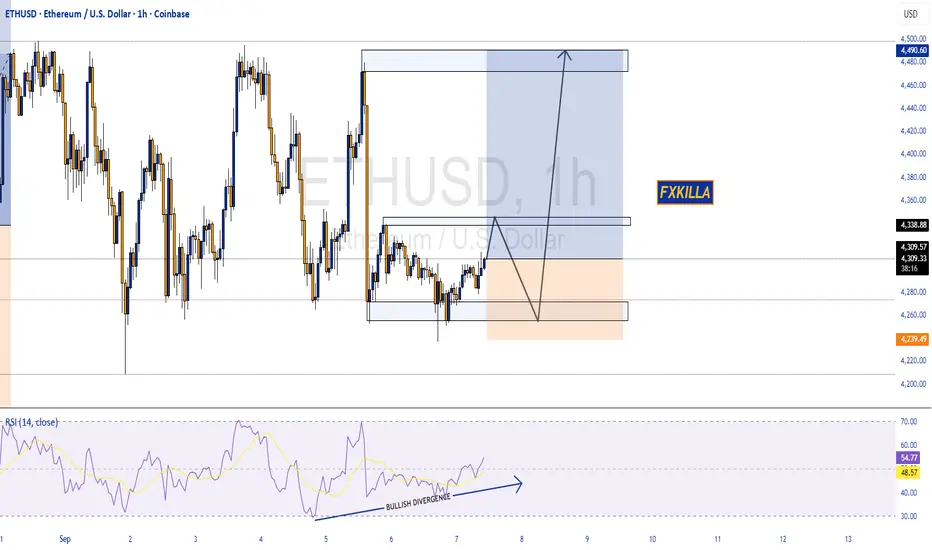
ETHEREUM HIGH PROBABILITY SETUP SOON!!!🚨 ETHUSD HIGH PROBABILITY BUY SETUP 🚨
* Here We Can See Clearly The Next Potential Moves For ETH Coming Hours/Days.
* Keep Your Eyes Close On Your Trading Positions.
* Happy PIP Hunting Traders.
FXKILLA.
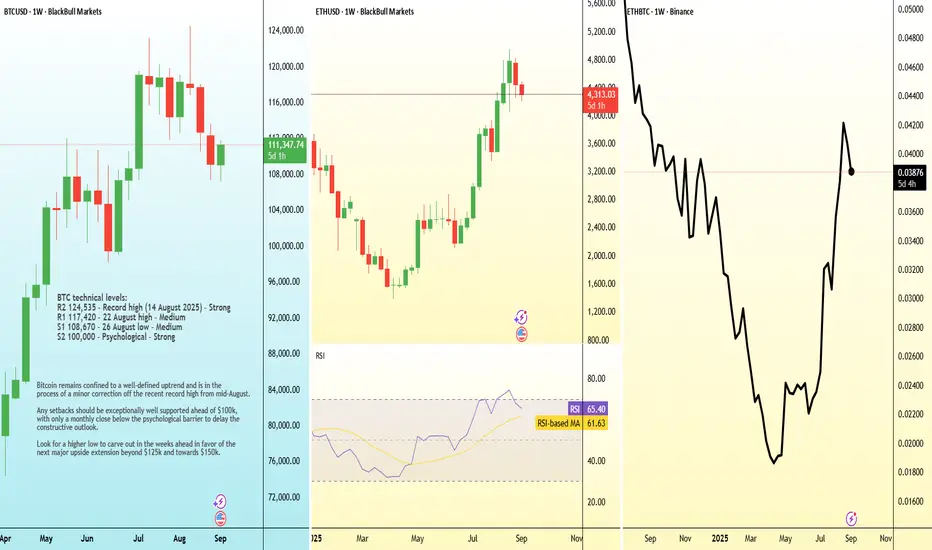
Why Ethereum is Outperforming Bitcoin? | FX ResearchWhile Bitcoin did manage to push to a fresh record high, the broader august trend reflected cautious investor sentiment, supported by modest momentum and ongoing macro uncertainty. The narrative suggests price resilience, but without the forcefulness needed for the next wave of bullish momentum.
In stark contrast, Ethereum continued with its run of outperformance—posting double-digit returns and surpassing its 2021 peak to hit fresh all-time highs. Its rally was powered by robust institutional demand, record ETF inflows, and active on-chain metrics like rising transaction volumes and reduced network fees. Favorable regulatory signals, particularly stablecoin-friendly legislation, further stoked confidence in ETH’s utility-driven narrative.
This divergence has shifted the ETHBTC dynamic sharply in ETH’s favor. As Bitcoin grinded higher with subdued volatility, Ethereum’s performance underscored its emergence as the speculative bellwether, attracting capital rotating away from Bitcoin’s more mature positioning.
Exclusive FX research from LMAX Group Market Strategist, Joel Kruger
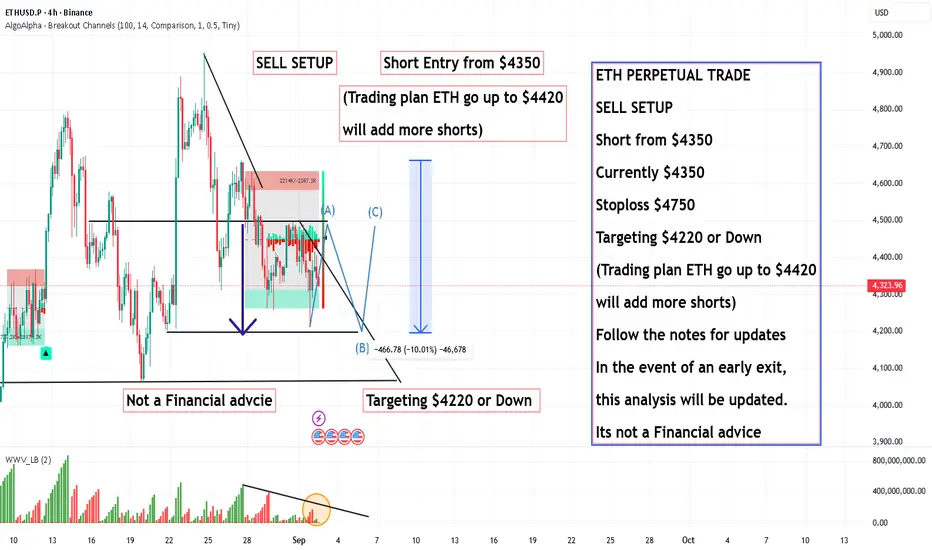
ETH PERPETUAL TRADE SELL SETUP ,Short from $4350ETH PERPETUAL TRADE
SELL SETUP
Short from $4350
Currently $4350
Stoploss $4750
Targeting $4220 or Down
(Trading plan ETH go up to $4420
will add more shorts)
Follow the notes for updates
In the event of an early exit,
this analysis will be updated.
Its not a Financial advice
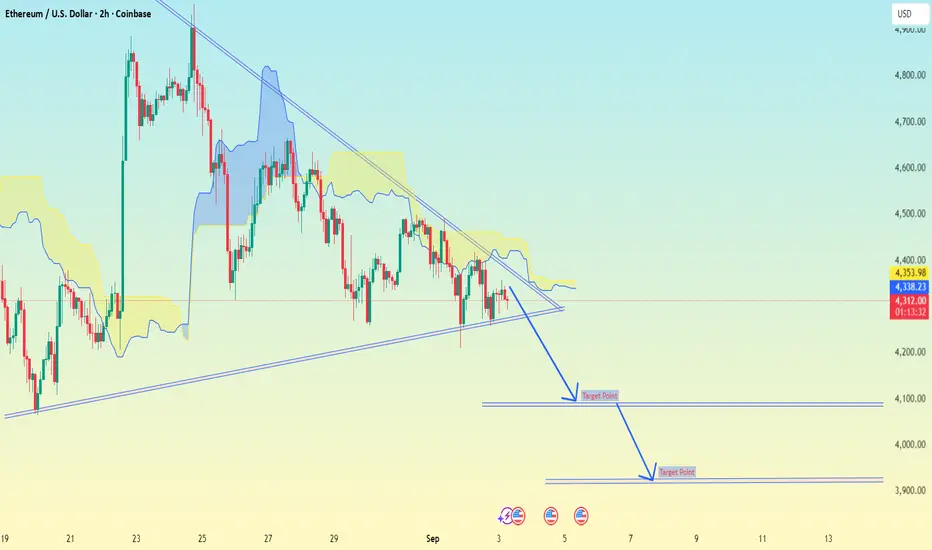
ETH/USD (Ethereum vs USD) chart (2H timeframe.ETH/USD (Ethereum vs USD) chart (2H timeframe, Coinbase), here’s what I see:
---
📊 Setup
ETH is trading around 4,314 USD.
Price is under the Ichimoku cloud (bearish bias).
A descending triangle pattern is visible, with a support trendline below.
Your chart projection shows downside targets.
---
🎯 Target Points
First Target: ~ 4,100 USD
Second Target: ~ 3,900 USD
These are marked with blue arrows on My chart.
---
⚠ Stop-Loss Suggestion
Above 4,420 – 4,450 USD (break above resistance + cloud).
---
✅ Summary:
ETH looks bearish short-term while below the cloud and resistance.
First target: 4,100 USD
Second target: 3,900 USD
Stop-loss above 4,420 – 4,450 USD
ETHUSD BUY NOW 4287🟢 ETHUSD – Bullish Setup at 4287 Long Opportunity
Ethereum is holding strong above key support at 4280–4290, showing signs of bullish continuation. Price action confirms buyer strength, with momentum indicators aligning for a potential breakout toward higher resistance zones.
🔹 Trade Idea: BUY ETHUSD @ 4287
- Entry: 4287
- Stop Loss: 4215 (below recent structure)
- Take Profit: 4450 / 4600
- Risk/Reward: ~2:1
📊 Technical Confluence:
- Bullish engulfing candle on 1H
- MACD crossover and RSI above 50
- Price respecting ascending channel
- Volume spike confirming accumulation
💬 Narrative:
ETH continues to attract institutional interest, with inflows rising and sentiment shifting bullish. A clean break above 4350 could accelerate toward 4600, especially if BTC maintains strength.
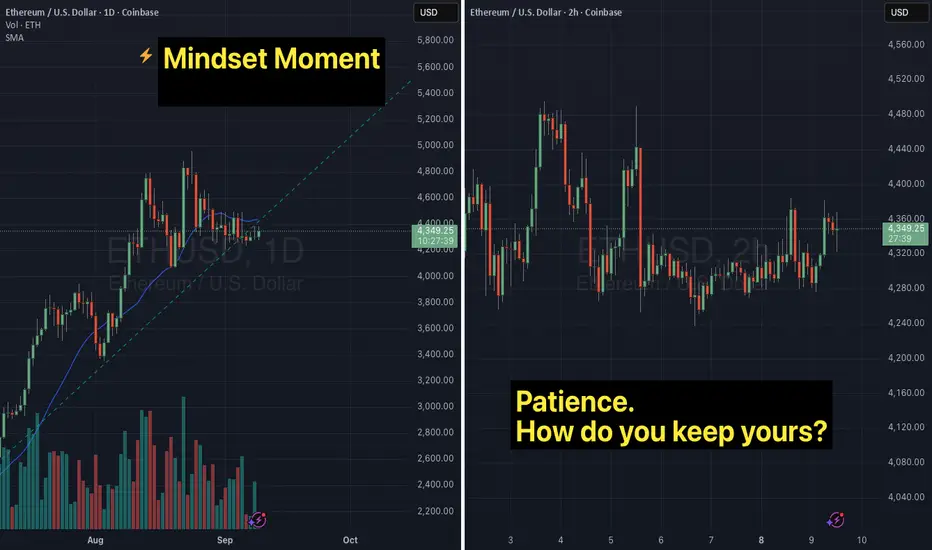
Patience: Is a virtue but it's damn hard...NOTE - This is a post on Mindset and emotion. It is NOT a Trade idea or strategy designed to make you money. If anything, I'm taking the time here to post as an effort to help you preserve your capital, energy and will so that you are able to execute your own trading system as best you can from a place of calm, patience and confidence'.
Here's a scenario:
You want the trade to hurry up… but the market has no reason to move on your timeline.
Here on Ethereum we see consolidation.
We can imagine traders framing for a break in either direction.
There will certainly be plenty trying their hand at getting ahead of the move and getting chopped.
Patience is one of the hardest skills for traders to master. The market doesn’t reward impatience it punishes it. If I'm honest, when I first started out, I certainly didnt think of patience as a 'skill' - but it's certainly essential. Without it, I've either wasted a lot of 'ammunition' in trying - or missed the whole point of a trade once I was depleted of will.
So offering some thoughts for you. Please take what resonates and ignore what doesn't work for you:
How impatience shows up:
You close trades too early because the profit feels “good enough.”
You jump into setups that haven’t confirmed because you’re tired of waiting.
You watch price drift sideways and feel an urge to “make something happen.”
You start to entertain thoughts that undermine your confidence.
You get distracted and do something else entirely risking missing the signal all together.
Emotional side:
Impatience often hides anxiety the need for relief, action, or certainty. Your body feels restless, your mind races with “what ifs,” and you start convincing yourself to bend your rules.
This is not 'woo'. It's an actual internal angst that causes one to act / behave in a way and at a time that is against ones intention. Ironically - as much as we ignore it - it' drives our behaviour.
So how can we get ahold of this to try and ensure it doesn't sabotage our intentions?
Consider the following and see if it works for you.
Shift your mindset
See patience as an active discipline and not just something that's passive. If we practice and nurture patience with mindfulness, the stronger the muscle to holding your ground, sticking to your process and letting the probabilities play out on their own clock not yours.
Practical tips .. the How ..:
When you feel that urge rising:
- notice where in your body you're feeling impatience.
- recognise how it's showing up for you (tension, irritation, restlessness - something else)
- notice what you are saying to yourself
- consider and assess : when was the last time I had a drink of water, had something to eat?
- do something physical to diffuse the feeling and get some energy back in the body:
stretch, breathe, walk away from the screen for a moment
put some music on and dance your ass off, do some burpees
set an alert on your screens, phone etc
Reminder yourself ... 'Waiting is a position too'.
I hope this helps. Interested in hearing what you do to instill and respect your patience
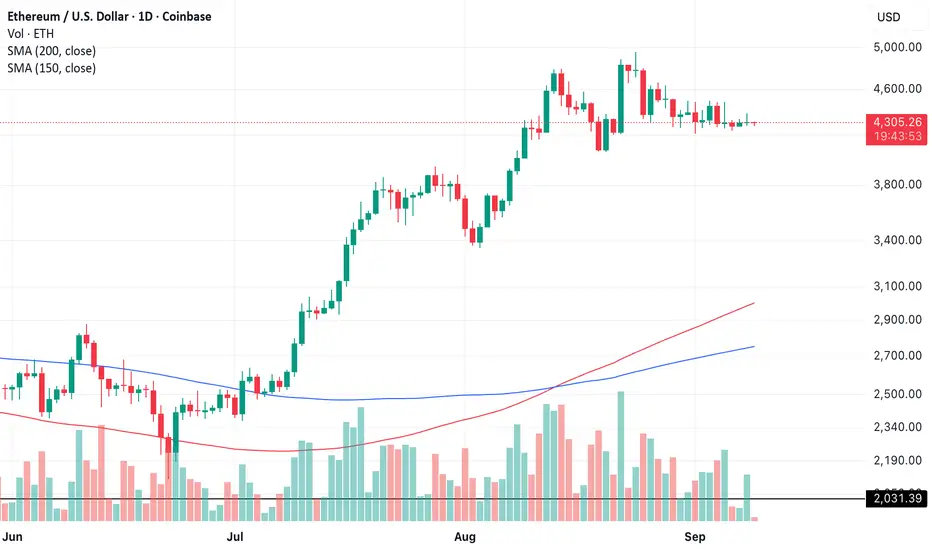
Stage 2 Breakout Incoming on ETH - 8k Post HasteETH is currently in a tight as a tiger sideways range ater making higher highs and higher lows consecutively. Simultaneously, the 150 has crossed the 200ma and they are both pointed upwards below this uptrend.
Accordingly, ETH is in the most explosive and rewarding phase of a stage 2 uptrend.
Zoom out and it's in a parabolic advance. Its time for faces to melt.
Win or dont play.
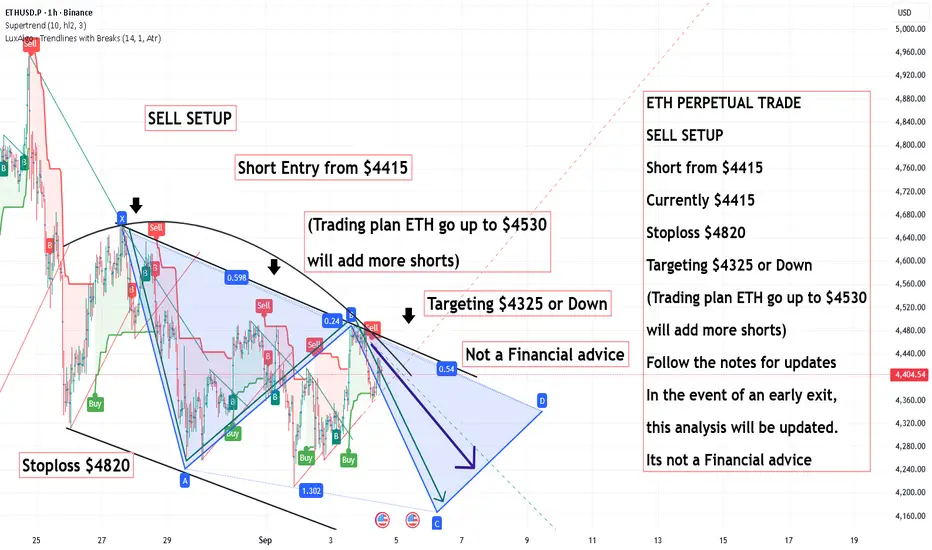
ETH PERPETUAL TRADE ,SELL SETUP Short from $4415ETH PERPETUAL TRADE
SELL SETUP
Short from $4415
Currently $4415
Stoploss $4820
Targeting $4325 or Down
(Trading plan ETH go up to $4530
will add more shorts)
Follow the notes for updates
In the event of an early exit,
this analysis will be updated.
Its not a Financial advice
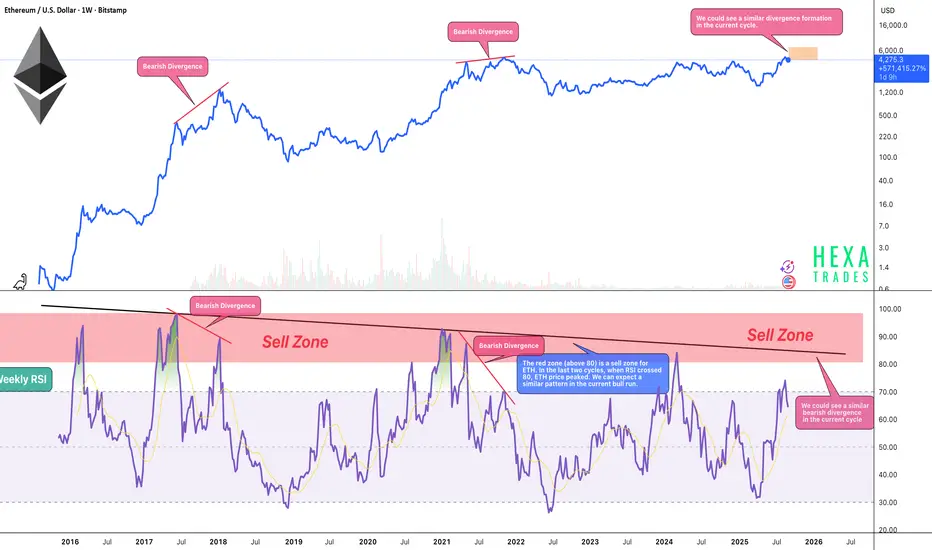
Ethereum Peak Incoming!The above ETH chart highlights the historical relationship between Ethereum’s weekly RSI and major cycle peaks. The red sell zone (RSI above 80) has consistently marked high-risk areas where ETH price eventually topped out.
📜Historical Patterns
🔷 2017 Bull Run
- RSI reached 98 (extreme overbought).
- ETH price peaked soon after.
- A bearish divergence followed, where ETH made higher highs while RSI made lower highs — signaling exhaustion before the major correction.
🔷 2021 Bull Run
- RSI peaked at 92, lower than the 2017 cycle.
- ETH price again topped within this red sell zone.
-A clear bearish divergence formed as ETH pushed to new highs while RSI declined. This preceded the end of the cycle.
🔷 Current Cycle (2025)
-RSI is trending higher and approaching the 80+ sell zone once again.
- Based on the cycle-to-cycle decline (98 → 92 → projected 85), this run could see its RSI peak around 85.
- If ETH price enters the 80+ RSI zone while forming a bearish divergence, ETH could be trading in the $6K–$7K range.
- The projected timing for this peak is late Q4 2025 or early Q1 2026.
📉 Declining RSI Peaks Show Market Maturity
-Each bull run has shown a lower RSI peak compared to the last (2017: 98 → 2021: 92 → projected 2025: 85).
-This reflects ETH’s market maturity: price continues to grow, but volatility and overbought extremes decline cycle by cycle.
🐻 Bearish Divergence Watch
- After previous RSI peaks, ETH displayed a consistent bearish divergence:
Price → higher highs
RSI → lower highs
- This pattern has historically signaled weakening momentum before a macro top.
- We could see a similar divergence formation in the current cycle, marking a potential exhaustion phase.
🎯 Trading Implications
- RSI above 80 = high-risk sell zone.
- A projected RSI peak near 85 could align with ETH’s cycle high.
- ETH may trade in the $6K–$7K range if this setup plays out.\
- Expected peak timing: end of Q4 2025 or beginning of Q1 2026.
- Monitoring RSI and divergence signals will be key in spotting the top.
Conclusion: In 2017, ETH peaked with the RSI hitting 98, while in 2021 the RSI topped at 92. For the current 2025 cycle, the projected RSI peak is around 85. This consistent decline in RSI peaks across cycles highlights ETH’s market maturity, with reduced volatility as the asset grows. Historically, each major top has also been preceded by a bearish divergence, and a similar setup could form again. Traders should remain cautious as ETH approaches the red sell zone above 80 RSI.
Cheers
Hexa
CRYPTOCAP:ETH BITSTAMP:ETHUSD BINANCE:ETHUSDT
ETHUSD: The Market Is Looking Up! Long!
My dear friends,
Today we will analyse ETHUSD together☺️
The price is near a wide key level
and the pair is approaching a significant decision level of 4,292.8 Therefore, a strong bullish reaction here could determine the next move up.We will watch for a confirmation candle, and then target the next key level of 4,308.2.Recommend Stop-loss is beyond the current level.
❤️Sending you lots of Love and Hugs❤️
ETHUSDTETH in support. So best for entry but control risk management because not confirmation of candle for buy.
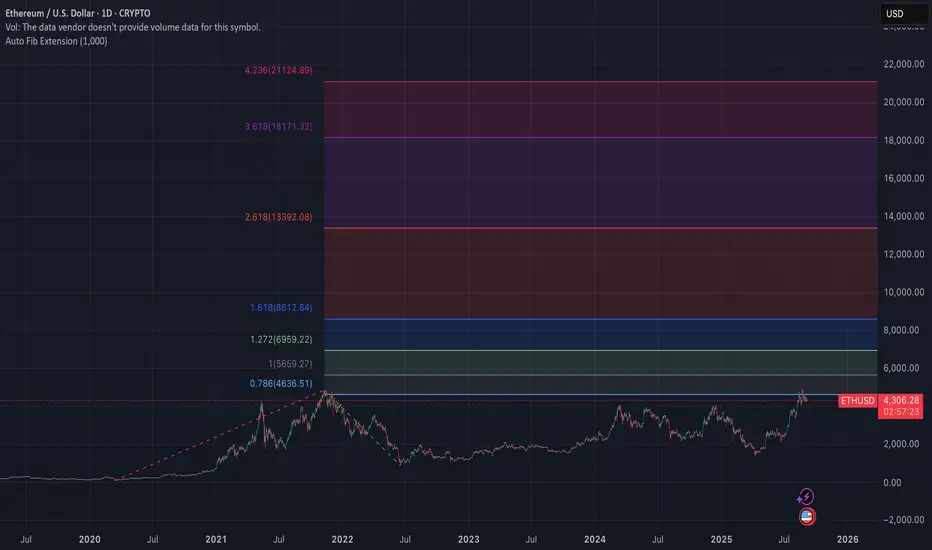
ETHUSD AUTO FIB 1000 DEPTH MACRO🔎 Key Fibonacci Levels (depth 1000 chart) / Set at 1000 to closely track 4 year cycle
0.618 → $3,839 (recently reclaimed, now support)
0.786 → $4,636 (current resistance zone)
1.000 → $5,659 (macro breakout confirmation)
1.272 → $6,959
1.618 → $8,612
2.618 → $13,392
3.618 → $18,171
4.236 → $21,124
📊 Probabilistic Outlook (based on history + structure)
0.786 ($4,636): Very close overhead. Odds of testing = 80–90% in this cycle.
1.000 ($5,659): Historically tagged in every ETH cycle. Odds = ~85% if bullish structure holds.
1.272 ($6,959): Tagged in all past ETH bull cycles. Odds = ~75%.
1.618 ($8,612): Historically hit in every run. Odds = ~65%.
2.618 ($13,392): Hit in both 2017 and 2021. Odds = ~45% (usually requires euphoric late-cycle blowoff).
3.618 ($18,171): Hit in 2/3 historical cycles. Odds = ~25–30%.
4.236 ($21,124): Extreme extension, only tagged in strongest cycles. Odds = ~15–20% (basically “mania top” territory).
⚖️ Summary
High confidence: ETH tests $5.6k–7k (1.0 → 1.272 Fib) this cycle.
Likely but needs momentum: ETH pushes to $8.6k (1.618 Fib).
Possible in full mania: $13k (2.618 Fib).
Euphoric blow-off only: $18k–21k (3.618–4.236).
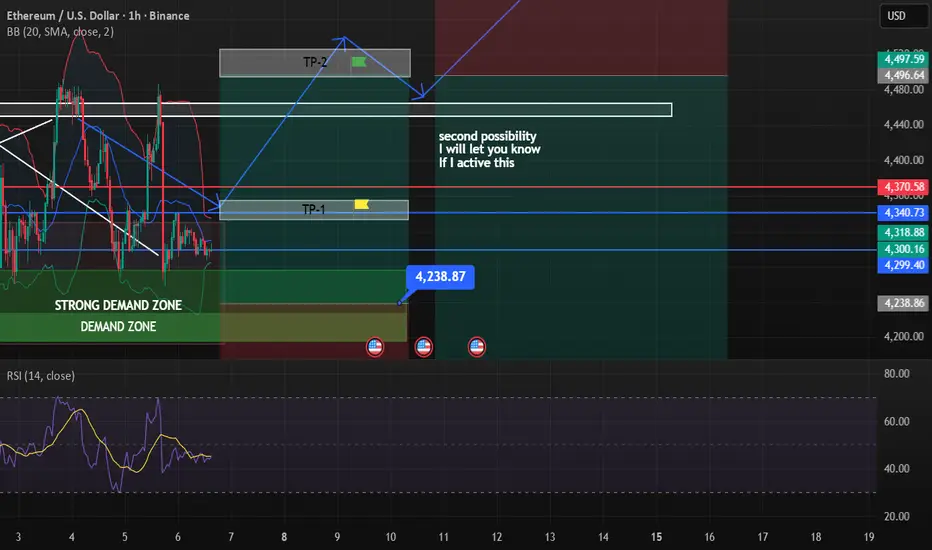
ETH UPDATEMy former analysis of ETH touch my support and resistance twice total %10 at least %5
But unfortunately it wasnt my path I expected direct and strong candles but we couldnt stay over the resistance and fall twice this may be sign for not the push my main target (red box)
Now we will see third one but if we fail again It wont be good for ETH. I will active my second order if I see weakness So you may want to close all your positions when we hit full target, after TP1 put stop loss to break even and wait this is your choice I will let you know for other uptades keep following
Always manage your own risks this is not a investment advise I am not responsible neither your loss nor profit.
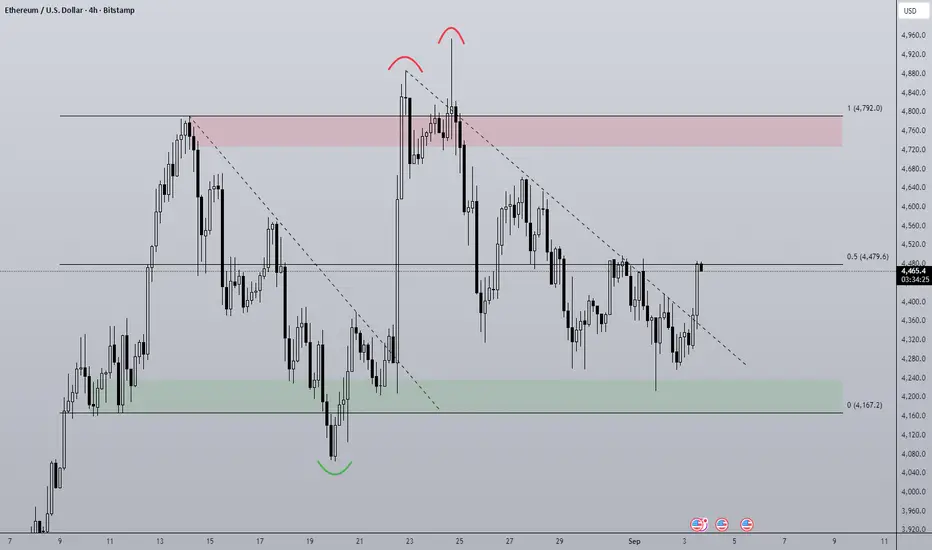
Ethereum 4H Range As we approach nearly a month in the range from $4000-4800 it looks like ETH is making a move once again.
Previously once hitting $4800 price gradually sold off back towards range low creating a bearish trendline, once the price broken above that level a rapid move up to range high within two candles.
Now looking at the chart we have a similar setup, strong breakout from the bearish trendline up into midpoint. Bitcoin currently retesting a key level of $112,000, should BTC flip this level I could see alts getting the greenlight to move up and Ethereum up to the highs.
Should BTC reject from $112,000 it makes sense that ETH range midpoint would be strong resistance, rejection could lead to a range low retest. Anything else that isn't either range high, range low or midpoint is noise and for me no action required, no need to over complicate it.
ETHUSD BUY 4350ETHUSD Long Setup – Eyeing Momentum Above 4350
📌 Entry: 4350
🛡️ Stop Loss: (Set based on your risk tolerance, e.g., below recent support)
🎯 Target: (Optional – define based on resistance zones or fib levels)
Ethereum is showing signs of strength after consolidating near a key support level. A clean break above 4350 signals bullish intent, supported by improving volume and short-term trend alignment. This setup favors momentum traders looking to capitalize on a potential leg up toward the next resistance zone.
Watch for confirmation on lower timeframes and monitor BTC correlation for added confluence. Ideal for intraday or swing entries depending on volatility.
#ETHUSD #CryptoTrading #Ethereum #BreakoutSetup #BullishBias #MomentumTrade #TradingViewIdeas
Want me to tailor this for meme-style engagement or algo-friendly tagging? I can remix it in seconds.
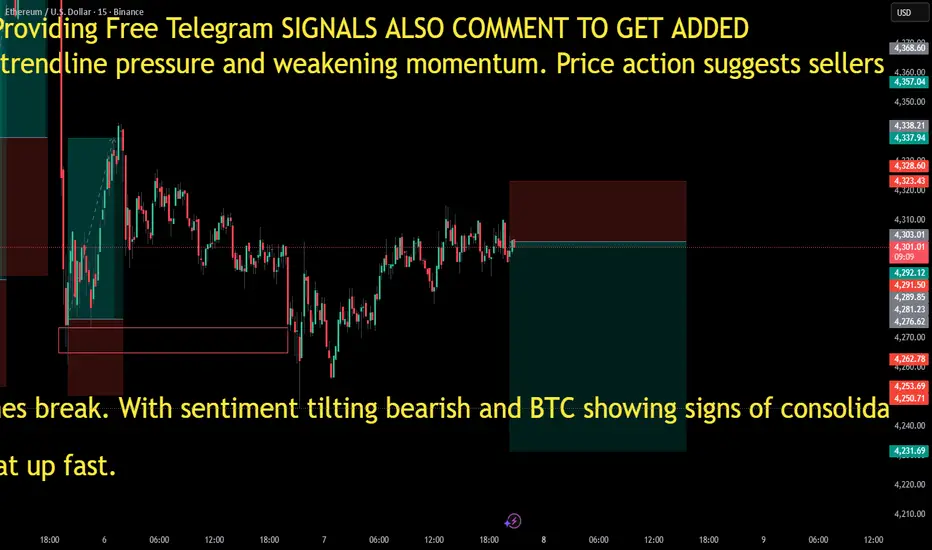
ETHUSD – Bearish Setup at 4300 Short Opportunity
🔴 ETHUSD – Bearish Setup at 4300 Short Opportunity
Ethereum is facing rejection near 4300, a key resistance zone aligned with descending trendline pressure and weakening momentum. Price action suggests sellers are regaining control, with lower highs forming and volume fading on bullish attempts.
🔻 Trade Idea: SELL ETHUSD @ 4300
- Entry: 4300
- Stop Loss: 4362 (above recent resistance)
- Take Profit: 4260 / 4215
- Risk/Reward: ~2:1
📉 Technical Confluence:
- Rejection from descending trendline
- Bearish divergence on RSI
- MACD histogram turning negative
- Volume drop on recent push
💬 Narrative:
ETH failed to hold above 4300, signaling potential downside toward 4215 if support zones break. With sentiment tilting bearish and BTC showing signs of consolidation, short bias remains valid unless bulls reclaim 4360+.