ETH to 10K , Long live the Alts !Hello Traders 🐺
I think it’s finally time to pop the champagne and celebrate the beginning of our favorite season — the one we’ve all been patiently waiting for! 🍾
As I mentioned in my previous idea (you can check it out here:
),
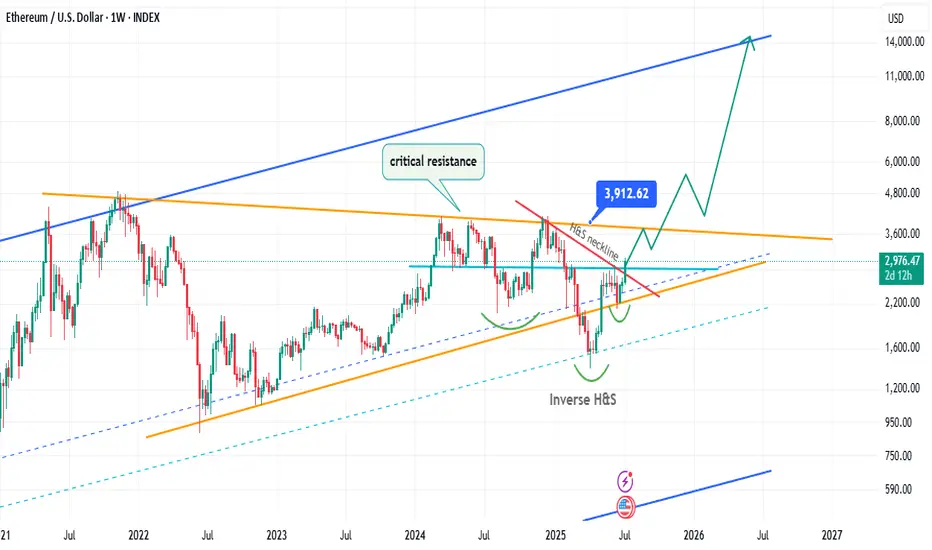
ETH has officially broken above the neckline of the inverse H&S pattern and cleared the major resistance at $2900.
In my opinion, this opens the door for a powerful move toward the $3900 zone — a major pivot level that could be a true game-changer.
But what happens if we actually reach that level?
Let’s shift from short-term to mid-term now, and talk about where I believe ETH could go in this upcoming altseason:
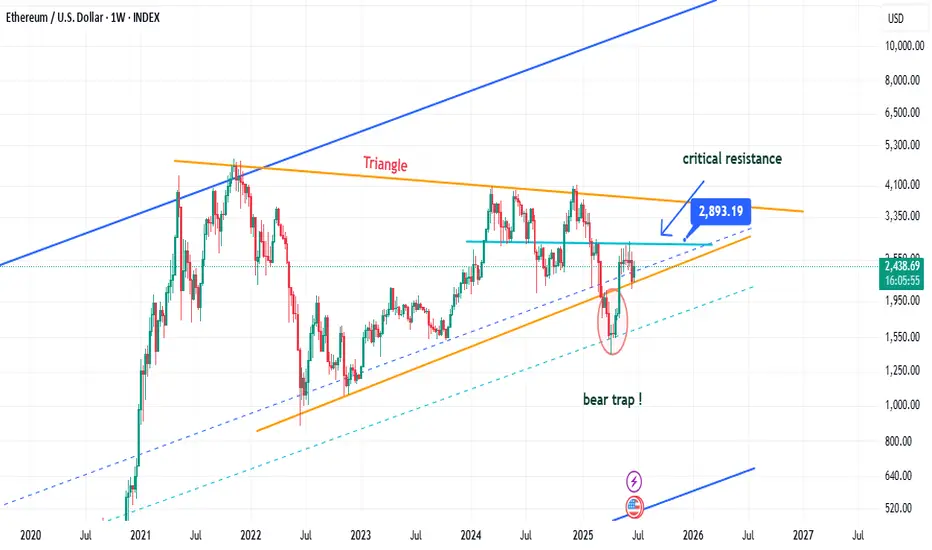
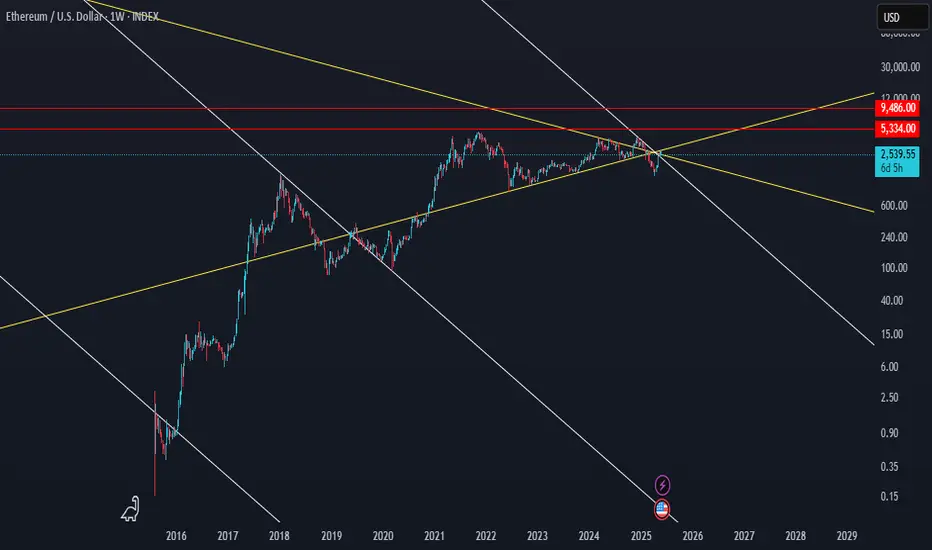
📈 On the weekly chart, we have a massive triangle structure that’s been forming for years.
And honestly? It looks like ETH is about to enter what I call the banana zone 🍌 again.
Yes — if ETH manages to flip $3900 and break its all-time high, there’s literally no strong resistance left on the chart until 10K.
Combine that with current market conditions and BTC.D setup — which I’ve discussed plenty of times (check here:
) —
and you’ve got all the ingredients for a full-blown ETH season.
This could shift the entire dynamic for altcoins.
I'll keep you updated as this plays out — but for now, keep your eyes on the key levels.
Let’s see how bulls and bears react here before we jump further.
And as always, remember:
🐺 Discipline is rarely enjoyable, but almost always profitable. 🐺
🐺 KIU_COIN 🐺
ETHUSD trade ideas
ETH – Critical Resistance Test Ahead! Hello Traders 🐺
In this quick update, I want to share my view on Ethereum (ETH) and walk you through the current short-term structure and price target.
📊 Technical Insight:
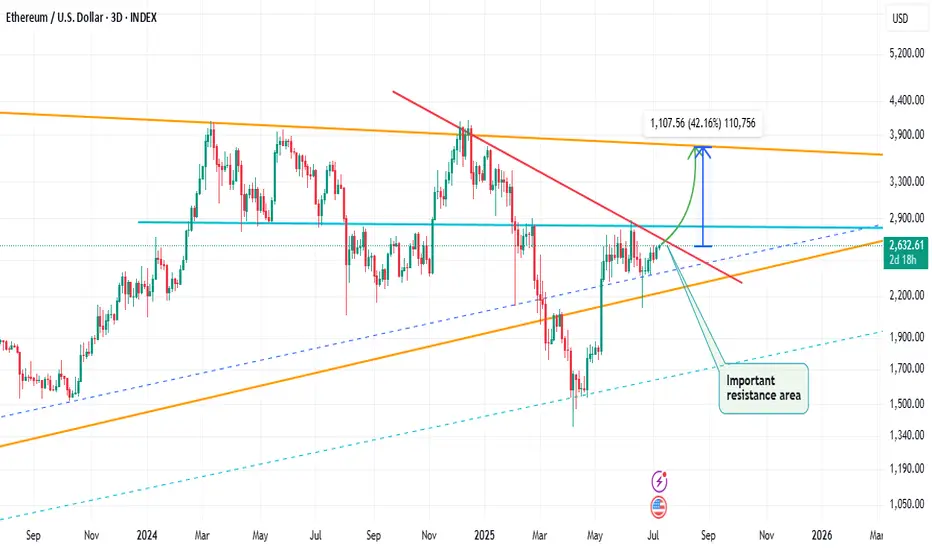
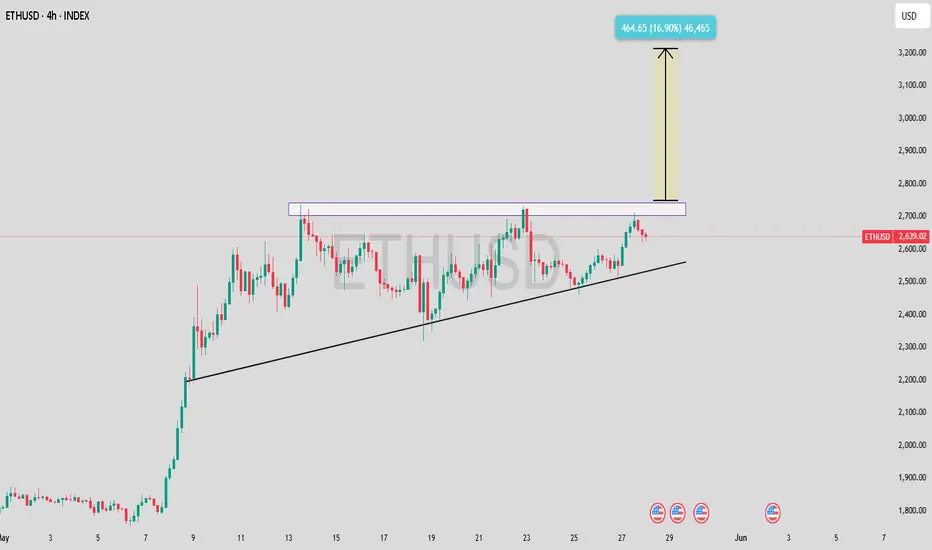
As shown on the chart, ETH is now trading just below a critical confluence zone of resistance between $2650 and $2850.
Here’s what makes this area significant:
🔴 A downward-sloping red trendline acting as dynamic resistance.
🟣 A weekly horizontal resistance sitting firmly at $2850.
This double-layered resistance zone is the main obstacle in ETH’s path right now.
But here’s the good news — if ETH manages to break above the red trendline, there’s a high probability that it could push through the weekly resistance as well. In that case, the next target would likely be the triangle resistance near the $3700 level — the previous swing high.
This could be a major technical breakout in the making.
📌 Key Levels:
Resistance: $2650 – $2850
Breakout Target: $3700
Let me know your thoughts in the comments 👇
And as always — stay sharp, stay patient, and stick to the plan.
🐺 Discipline is rarely enjoyable, but almost always profitable. 🐺
🐺 KIU_COIN 🐺
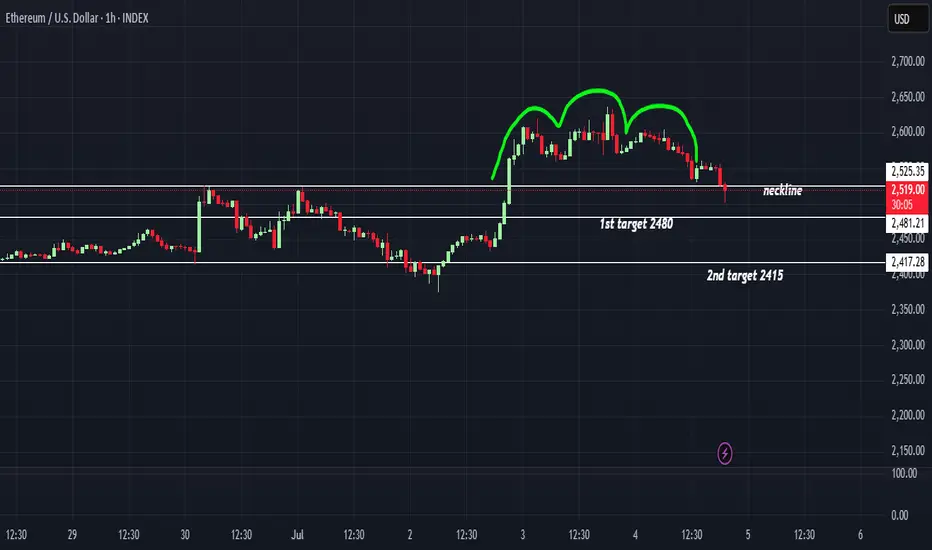
Head and Shoulder on ETHETH has formed H&S pattern on 1 hr time frame with neckline at 2525 which just got breached targets for this could be 2480 final target 2415 structure would become invalid if 2575 is crossed and ETH sustains above that for now its bearish and a decisive break below 2500 will result in further long unwinding and creating a cascading downward move
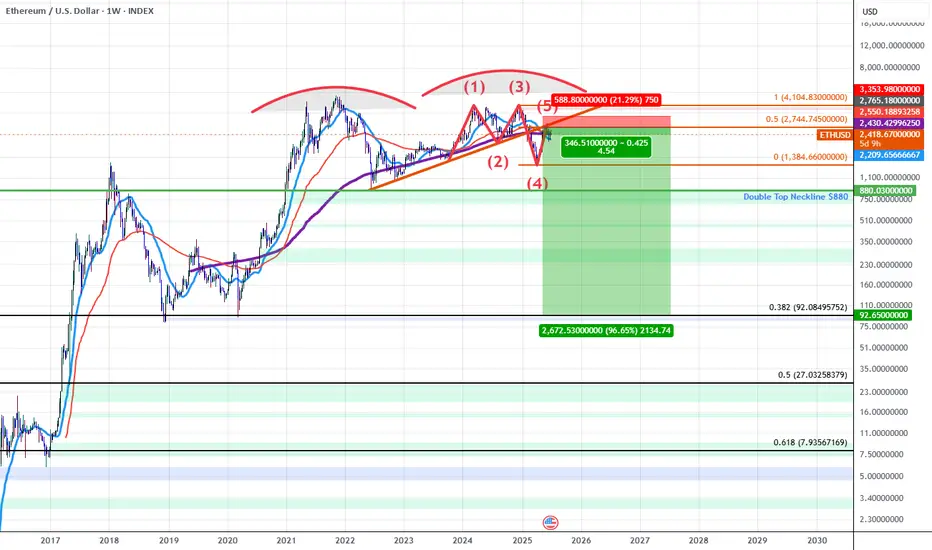
ETHUSD: Double Top into A Bearish 5-0 BreakdownETH for the last 5 years has been developing a Double Topping pattern which has put in a series of lower highs during the most recent 2nd run up. As we've confirmed these lower highs we've broken down below trendline and found resistance at the trendline which happens to have confluence with the PCZ of a Bearish 5-0 wave formation.
As we begin to find weakness and Bearish price action begins I suspect price will make it's way towards the neckline of the double top aligning with the $880 price level if ETH breaks below that level there will be no significant support until it reaches the all-time 0.382 retrace down at around $92.10.
In short it seems ETH is in the early stages of a macro breakdown which could result in value declines greater than 80%.
ETH still dancing below $2.9K...Hello Traders 🐺
It’s been a while since I posted anything. Wanna know why?
Because one of the most important principles in trading is patience.
You have to pause and ask yourself:
👉 Is the path I’m on really safe?
👉 Am I thinking like the crowd or am I seeing the bigger picture?
When you open a chart and do your TA, the real skill is in waiting to see if your analysis holds over time. Are your trendlines still valid? Is the pattern still intact?
If you go back and check my last ETH idea, you’ll see that everything is still on track — even after the Iran vs. Israel tensions!
That alone says a lot about the strength of the setup we’ve been watching, my friends.
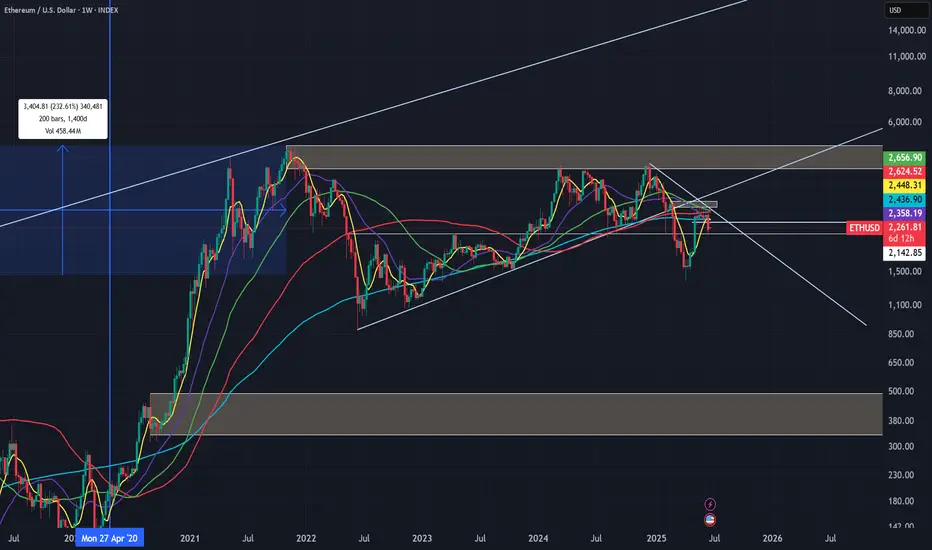
🔍 Weekly Outlook:
ETH is still trading below a major resistance level (the blue line near $2,900).
If we break above this line with strong confirmation, I believe it’s game on for Altseason — and maybe even a new All-Time High! 🎯
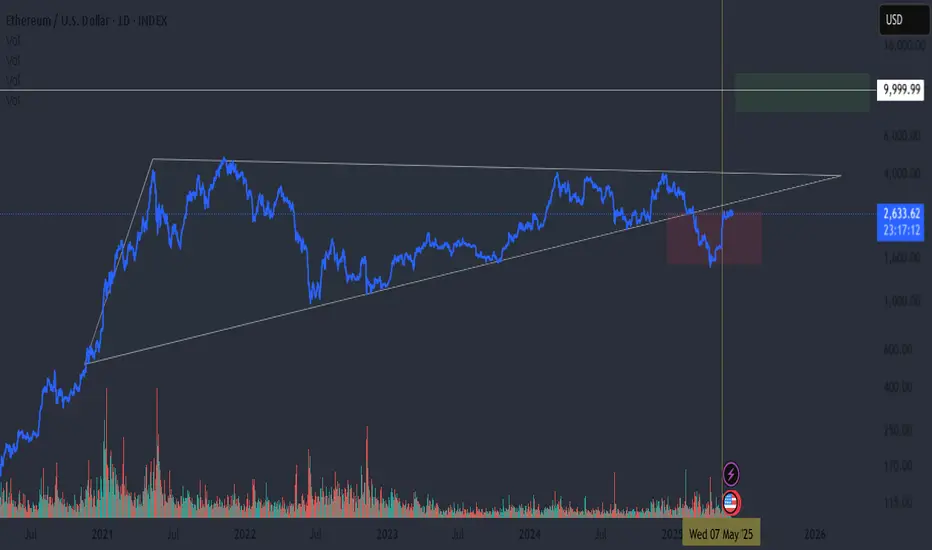
📉 Daily Chart Insight:
📸
On the daily, ETH is forming a potential Inverse Head & Shoulders pattern — and if it plays out, the target aligns with the upper trendline of the triangle, which is our next major resistance zone. 💥
As long as ETH remains below the blue resistance, we stay cautious.
We need a volume-backed breakout before we can say:
🟢 “Alright, it’s time to go all in!”
Hope you found this update helpful — and as always, stick to the golden rule:
🐺 Discipline is rarely enjoyable, but almost always profitable. 🐺
🐺 KIU_COIN 🐺
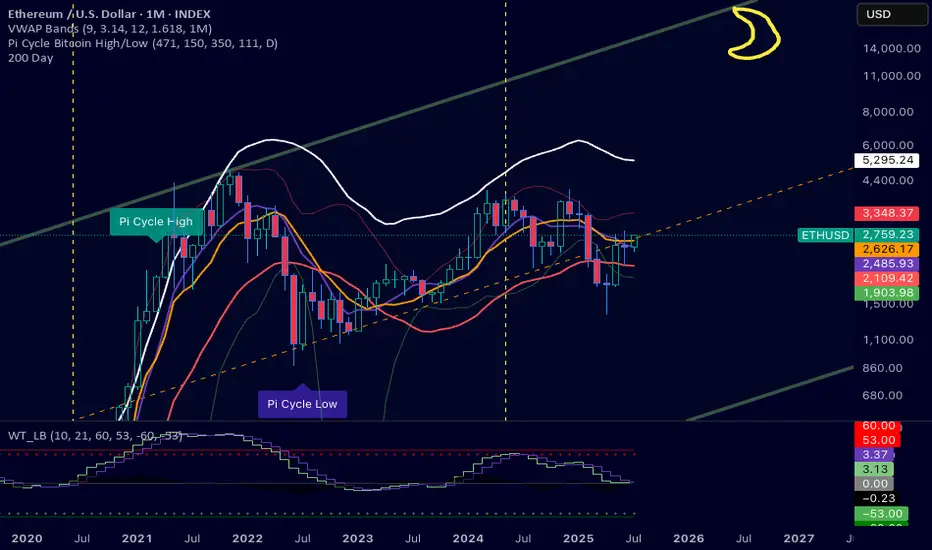
Moon artETH moon art. TY. I am just a guy on the internet. If you measure out prior ATH to ATH, it's over a 200% return, top to top. This is assuming business as usual which is not a great predictor
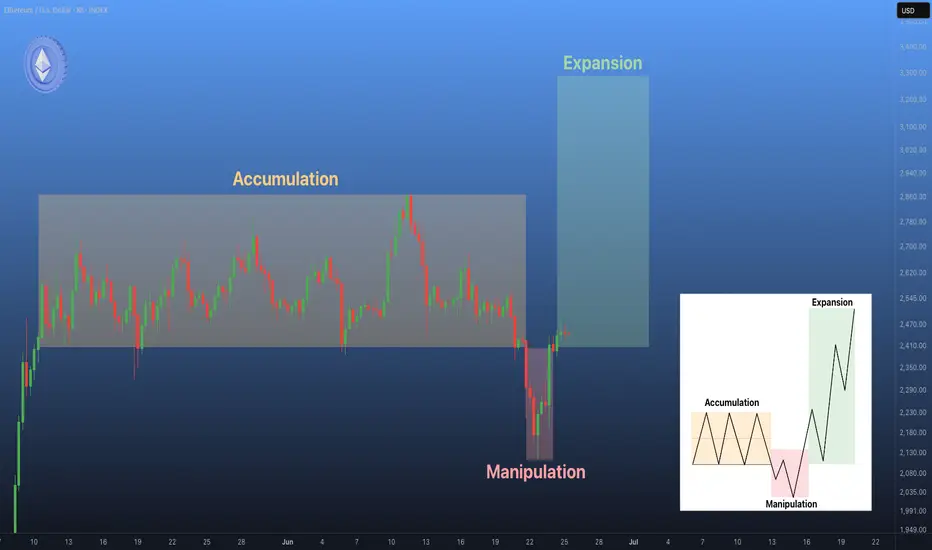
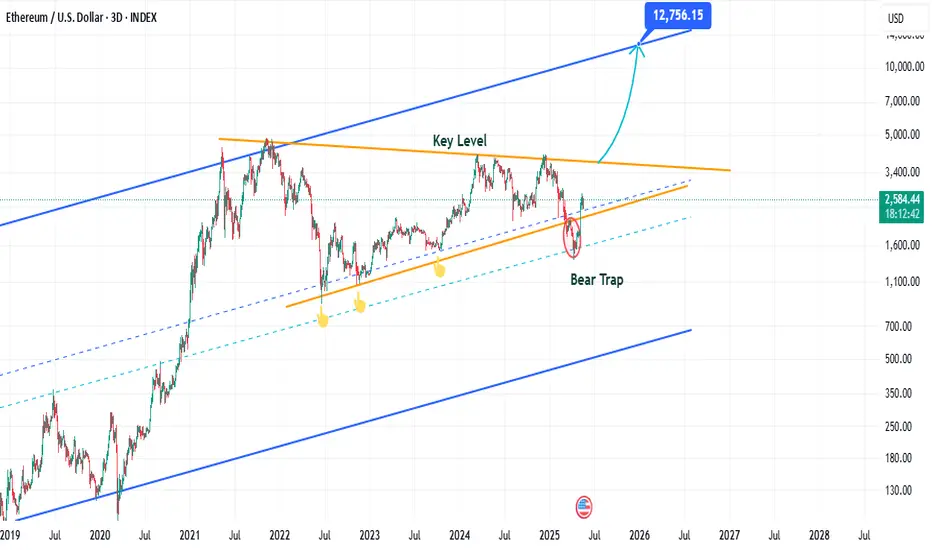
Ethereum: Power of Three in Motion🗞 The news backdrop is finally starting to improve.
〰️ After a prolonged #Ethereum accumulation phase, the recent wave of bearish headlines triggered a textbook manipulation move — shaking out weak hands and fueling fear across the market. 🙌🧻
Now, with disbelief and panic dominating sentiment, all signs point to the final stage of the Power of Three framework: expansion. 📈
🚀 The market often moves when the majority least expects it.
Are you positioned for what's coming next? 🙃
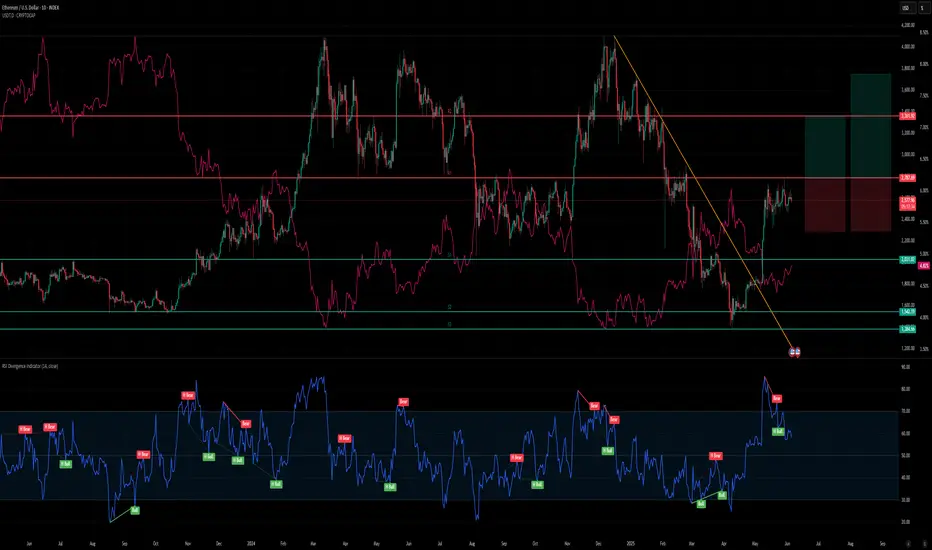
ETH As seen on the ETH chart, after breaking the upward trend, it performs a retest on the downward trend and creates the second peak of the downtrend by taking liquidity. All the moving averages (7, 25, 50, 100, 200) have converged, reinforcing and supporting the trend.
We have 3 scenarios here:
Wait for a break of the downtrend and enter a trade with a reversal candle.
Wait for the moving averages to act as support.
Wait for support from the block order zone around the 500 level — this is the worst-case scenario.
If the first two scenarios happen together, it could push us significantly higher.
At this point, only short positions are advisable — but they must be adjusted according to risk.
Everything written here is based on the weekly chart. It is possible to trade on lower timeframes, but don’t forget — the overall trend is still down.
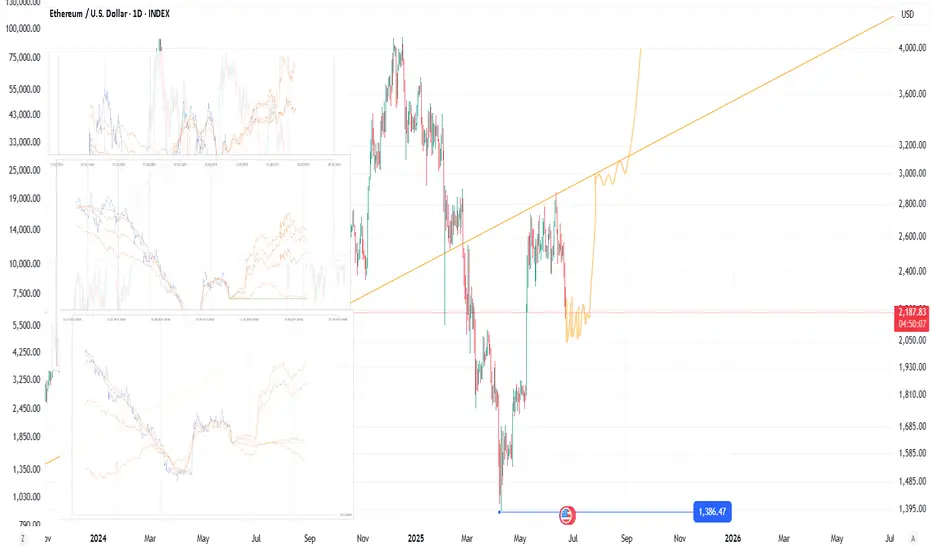
Anti-bart in July for ETHWherever it bottoms, this is THE dip to buy. Analogue forecasting with fractals similar to the ones I make for Bitcoin. Let's try this.
ETH Cup and handle patternETH has been trading on this big range since 2020 and we have form a cup and handle with the neckline around 4100 and the base around 850. With a breakout target of around 7100.
Once we don't go lower then April low it should move up into the 3.1K range and then 4.2K to test the neckline once this area is broken i expect ETH to run hard to over 5.2K.
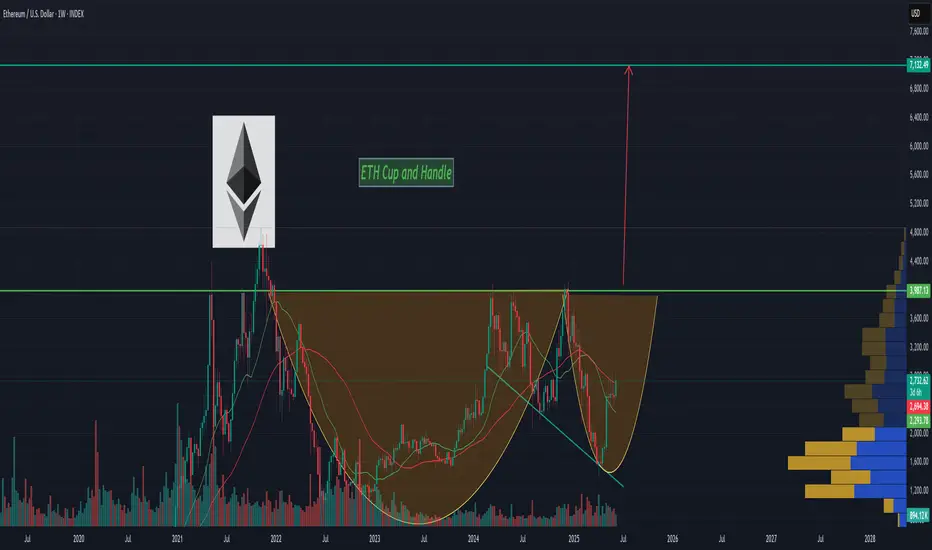
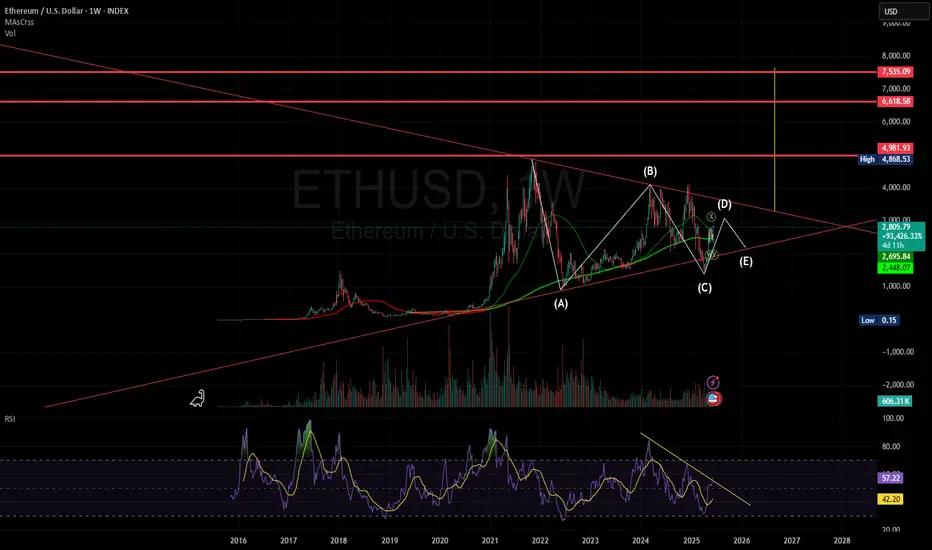
Chart Pattern Overview - bullish 🧠 1. Chart Pattern Overview:
The chart depicts a massive symmetrical triangle or contracting wedge formation stretching from early 2021 till now (mid-2025). This is a long-term consolidation pattern, suggesting a major breakout is likely imminent.
Elliott Wave Count (ABCDE Structure):
It follows a classic ABCDE triangle correction pattern:
A: Start of the bearish correction
B: Retracement rally
C: Capitulation dip (2022/2023 bottom)
D: Current push toward resistance (~$2,800)
E (potential): Expected minor pullback before a major breakout
💹 2. Key Levels (Support/Resistance):
Level Type Comment
$2,448 MA Support 200-week MA (in green)
$2,696 MA Resistance Price near golden cross zone
$2,814 Current Price Testing top of wedge (wave D)
$4,868 Historical High 2021 ATH zone
$4,981.93 Key Resistance Breakout target zone
$6,618–7,535 Target Zone Final measured move post-breakout
📐 Technical Indicators:
RSI (Relative Strength Index):
Weekly RSI at ~57: Trending upward, nearing breakout momentum.
Massive descending RSI trendline (since 2021) has been broken, suggesting long-term momentum shift to the upside.
RSI bullish divergence visible between waves C and E.
Volume:
Noticeable volume compression, common before explosive moves.
Watching for volume breakout confirmation (preferably on a weekly close above $3,000).
🔁 Scenario Analysis:
✅ Bullish Scenario (High Probability):
ETH breaks above wave D resistance (~$2,800–3,000).
Post-E breakout toward $4,900, followed by continuation toward $6,600–$7,500.
RSI breakout + triangle resolution = massive upside momentum.
Volume breakout will likely confirm the move.
⚠️ Neutral/Bearish Scenario:
ETH fails to break above wave D (~$2,800–3,000), rolls down toward wave E, which may retest $2,200–$2,400 support.
This forms the final leg (E) of the triangle before real breakout.
📏 Measured Move (Triangle Breakout Target):
Height of triangle: ~$3,500 (from ~$4,800 to ~$1,300)
Breakout target from apex: $6,500–$7,500, aligning with red horizontal resistance lines.
🎯 Conclusion & Strategy:
⚠️ Currently in a high-risk, high-reward zone. ETH is testing the triangle resistance and may either:
Break out above $3,000 → Strong long opportunity with target $4,900 → $6,600+
Reject and retrace to $2,200–$2,400 (wave E) → Final buying opportunity before breakout
📊 Actionable Summary:
Signal Status
Triangle Pattern Forming end of Wave D
RSI Bullish momentum
Volume Compression phase
MA Cross Bullish golden cross
Breakout Confirmation Weekly close > $3,000
Entry Zone $2,600–2,800 (partial)
Safer Entry On retest post-breakout
Long-term Target $6,600 – $7,535
free join my new community
ETH Breaking Key Resistance Is This the Beginning of Altseason ?Hello Traders 🐺
A few days ago, I posted an idea about ETH—and in my opinion, now it's your moment to decide. But why?
A lot of people still believe there's no Altcoin Season and that ETH or other large-cap alts won’t make significant moves.
However, the on-chain data and the chart are telling a completely different story 📊.
Here’s something I strongly believe in—beside trading skills, you must master your mindset.
If you truly believe in a market direction (up or down), don’t flip your opinion every time you read a different take from an analyst.
These ideas are meant to guide you, not confuse you. And if you’re still uncertain about your direction, maybe it’s time to stop staring at charts for a while and start building real knowledge about your journey and goals.
Sorry if this sounds a bit tough, but as a trader with a responsibility toward my audience, I must be honest and transparent with you.
That’s the only way we grow in this game.
🔍 Now, back to ETH:
If you read my previous ETH idea and took action, you’re probably already in profit ✅.
But I believe the best part might still be ahead!
As shown on the chart, ETH is breaking above a key daily resistance.
If we get a solid close above this level, we might see ETH making a big push—and I wouldn't be surprised to see it reclaim its all-time high against the dollar 🔥
🐺 Discipline is rarely enjoyable, but almost always profitable. 🐺
🐺 KIU_COIN 🐺

Ethereum in consolidation phase!Ethereum has recently broke its daily bearish trend line and is now trending bullish. Currently it is in consolidation phase just below its weekly resistance line of 2787.
Although there was a bearish divergence formed on RSI but was followed by bullish hidden divergence. So at the break of its weekly resistance line of 2787.69 I'll enter with half of the risk.
I'll wait for USDT.D to start falling before entering the trade so that the bias for Ethereum is bullish.
Stop loss will be below 2280 which is below this consolidation range.
TP1: 3361
TP2: 3762
ETH Bull Flag in Play – Eyes on the $3.8K Breakout Hello Traders 🐺
In my last ETH idea, I mentioned how Ethereum could outperform Bitcoin in the upcoming ETH season — but now it’s time to zoom into the short-term picture. 👇
On the daily chart, ETH is currently trading below a key support level, which has now flipped into resistance (the blue line).
Because of the bull flag formation right after the previous rally, I think we might see a small cooldown before the next leg up.
My short-term target is around $3.8K, where ETH will face a weekly resistance (orange line).
If that breaks, momentum could pick up fast.
Thanks for checking out this quick update — and as always, remember:
Discipline is rarely enjoyable, but almost always profitable.
🐺 KIU_COIN

ETH wyckoff again. Algo markers lazy, fractals galore!Until proven otherwise, ETH is acting like an asset that’s finished distributing and is now preparing for markdown. Don’t chase candles; sell the rallies that test supply, respect your invalidation, and let the structure do the heavy lifting.
618 retracement didn't get hit. that's unfinished business. I'm short but already took profit and stop is in profit. If BTC so much as sneezes towards up ETH could make another high. And high mark is a hard sell for me.
there are so many fractals, ill show you below. Each high has 2 attempts. I bet a lot of people see this too. so the big money could easily wreck them just before the biggest move down. I expect the lows below 2450 to be taken for sure. But will it pop to that htf 618. BTC could just bop around sideways and ETH could pop up and finish that 618.
I see BTC making a move lower but then ultimate up for one last hurrah, one last HH. Ill post that chart below also.
(Education only – manage your own risk.)

make up your mind !!!Look in my eyes and tell me you love me :)
Tell me you want me, or darling I'll be gone ;)
Look in my eyes and tell me that you're the one for me
And that our love will always be or darling I'll be gone
You still got time !!!
So make up your mind !!!
Ethereum – Ascending Triangle + Liquidity Grab?An ascending triangle is forming — a classic bullish pattern.
We’ve seen a break to the downside, but I consider it a clear manipulation before the participation phase.
📌 The yellow vertical line marks the Pektra update — possibly a catalyst.
Still watching for confirmation of strength
🧠 What does the Pectra update bring to Ethereum?
The Pectra update is the next important step in Ethereum's evolution. Here's what's changing:
1️⃣ Protocol Improvements (EIP)
All innovations come as Ethereum Improvement Proposals — they undergo discussion, testing, and are included in the update only after community approval.
2️⃣ Increased Staking Limit
Now a validator can stake up to 2048 ETH instead of the previous 32. This makes it easier for large players to participate.
3️⃣ Lower Fees
The update includes optimizations that reduce transaction costs on the network.
4️⃣ Smart Accounts (Account Abstraction)
One account — many actions. The ability to send multiple transactions at once and pay gas fees not only in ETH but also with other tokens.
5️⃣ More TPS — Higher Scalability
The network will process more transactions per second. This is critical for the growth of DeFi and the dApps sector.
💡 Summary:
Pectra makes Ethereum faster, cheaper, and more convenient — for both users and developers.
An infrastructure upgrade that could trigger a new wave of growth.
ETH CRYPTOCAP:ETH Ascending Triangle Formation in 4H Timeframe✅
When a Breakout Happens,Next Target will be +3000$✍️
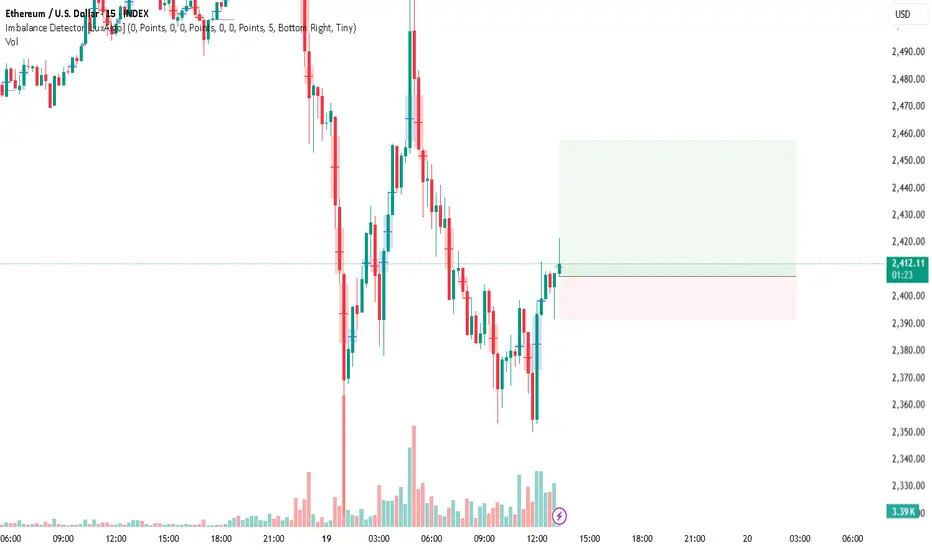
FvgThe market fills the imbalance at the order block by taking its liquidity and going back again to your direction after it takes you out. This is how we catch up with it when we are sure of the movement down
Eth usdtOk I'll let her go I'll let her go lyrics meaning ok I just wanted her go I'll let her go lyrics to I can do it again and it is the first day is good I think we will get to I will let him do the best we will
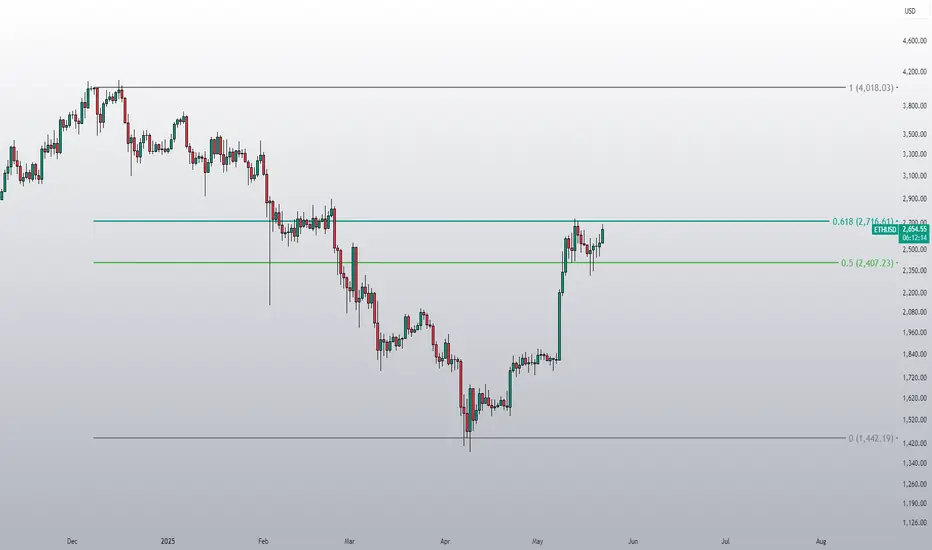
Is ETH ready?The ETH price is stuck in the golden pocket of the previous down trend. If it breaks above that, it'll confirm the trend change.
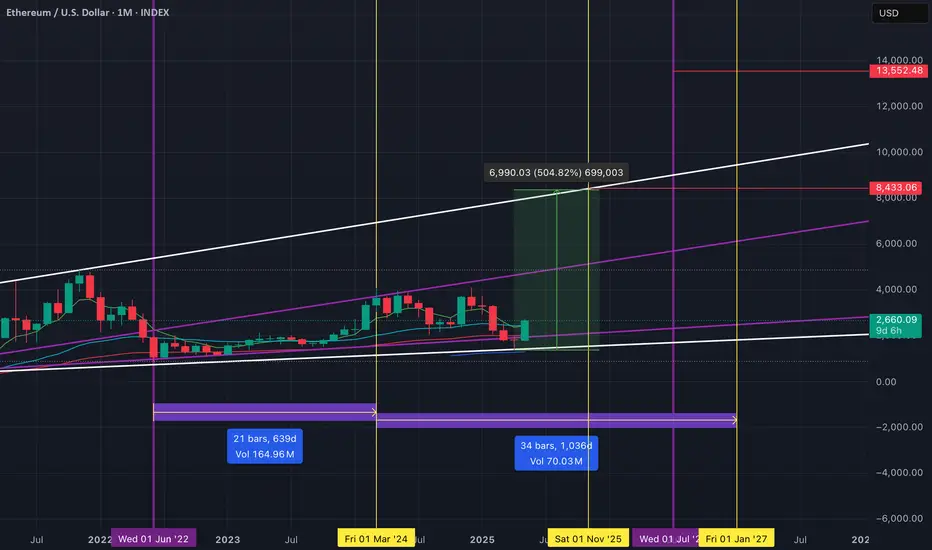
Ethereum’s Hidden Bullish Trap: A Technical Breakout to $15K Hello Traders 🐺
ETH — the biggest crypto out there after BTC itself...
You already know my personal opinion on it. However, I really need to talk about it once again to update you, my dear audience, and share the facts that are sleeping on the chart.
As you can clearly see, we had a massive shakeout during the Black Monday, which now seems to be turning into one of the rarest patterns — and one of the most powerful bear traps — I’ve ever seen for ETH.
You know why? Let me break it down for you:
Usually, after Phase 1 during a bull market, ETH starts to show strength against BTC — which is quite normal, as it marks the beginning of the Altcoin Season. ETH, being the leader, attracts most of the capital.
But before Phase 2 (ETH Season) kicks off, ETH often consolidates and starts to accumulate in a bullish pattern. In this case, we have a bullish triangle pattern with a wick below the support line — a classic bear trap — which makes it even more bullish to me.
If ETH can break above the current ATH (~$4700) and push through the key resistance line, we could witness a massive run-up to new highs, in my opinion somewhere between FWB:12K to $15K 🚀
I hope you enjoyed this idea — and as always, don’t forget our golden rule:
🐺 Discipline is rarely enjoyable, but almost always profitable. 🐺
🐺 KIU_COIN 🐺
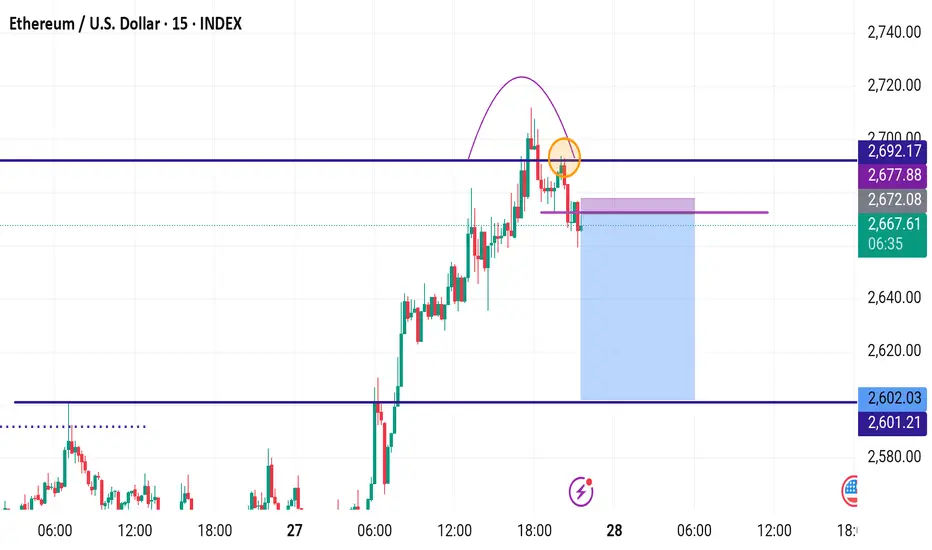
ETH LONG TRADE IN 15MIN FOR QUICK PROFITThis looks like a good short-term trade setup if your strategy is based on breakout or trend reversal confirmation. Just make sure you manage your risk properly and stay alert to sudden ETH volatility.