Ethereum at the Crossroads: Can Bulls Maintain the WMA 50 Grip?- Technical Pulse:
- Current price flirting with the WMA 50 ($2,521.54), suggesting a possible make-or-break moment.
- Highlight convergence zones: WMA 21 ($2,296.75) and EMA 200 ($2,277.07) forming a soft cushion below.
- Volume Snapshot:
69.19K weekly—enough activity to suggest accumulation
- Sentiment Analysis:
Gauge prevailing investor sentiment amid consolidation and macro uncertainty.
- Scenario Forecasts:
- Bullish Path: Sustained hold above WMA 50 opens room toward $2,800+.
- Bearish Reversal: Rejection from current level could retest EMA 200 support zone.
ETHUSD trade ideas
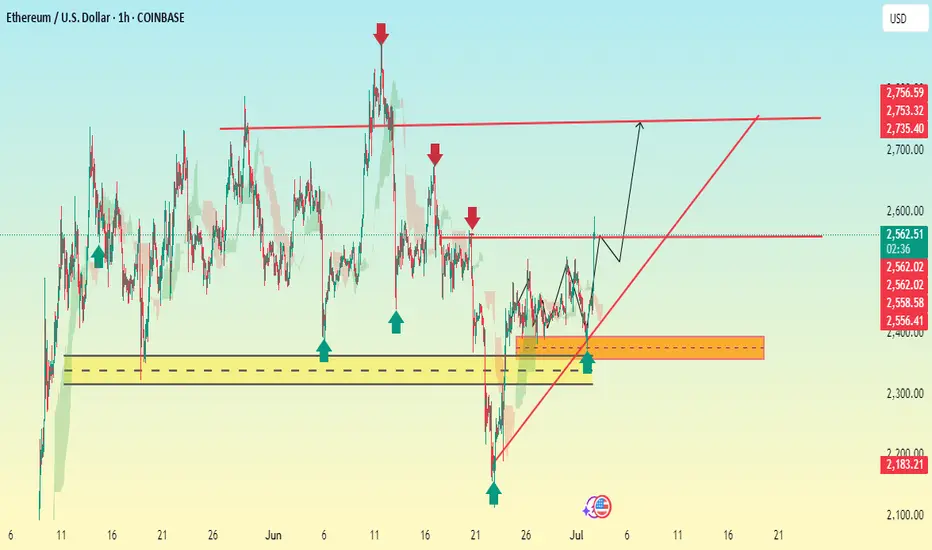
ETH/USD BUY SETUP 1-HOUR Based on the chart we provided (ETH/USD 1H from TradingView), here’s a technical analysis for potential Take Profit (TP) and Stop Loss (SL) levels:
🟢 Buy Setup Analysis (From the yellow demand/support zone)
Entry Zone:
Around $2,556 – $2,563 (current price zone and consolidation before projected breakout)
Stop Loss (SL):
Just below the yellow support zone:
🔻 $2,320 – $2,350
(Safe buffer under the strong support area marked by blue arrows)
Take Profit Levels (TP):
1. 🥇 TP1: $2,600 – $2,610
Just below the resistance level formed previously (also at the consolidation zone)
2. 🥈 TP2: $2,735 – $2,745
Matches previous significant rejection point (marked by red arrows)
3. 🥉 TP3 (Max Target): $2,754 – $2,760
Major resistance area, strong supply zone
🔴 Risk Management Summary:
Parameter Value
Entry $2,556 – $2,563
SL $2,320 – $2,350
TP1 $2,600
TP2 $2,735
TP3 $2,754
🛡 Risk/Reward Ratio: At least 1:2 or better if targeting TP2 or TP3.
ETH/USD Short TermA little copy paste.
Traders love their fractals... So much that they often become self-fulfilling prophecy.

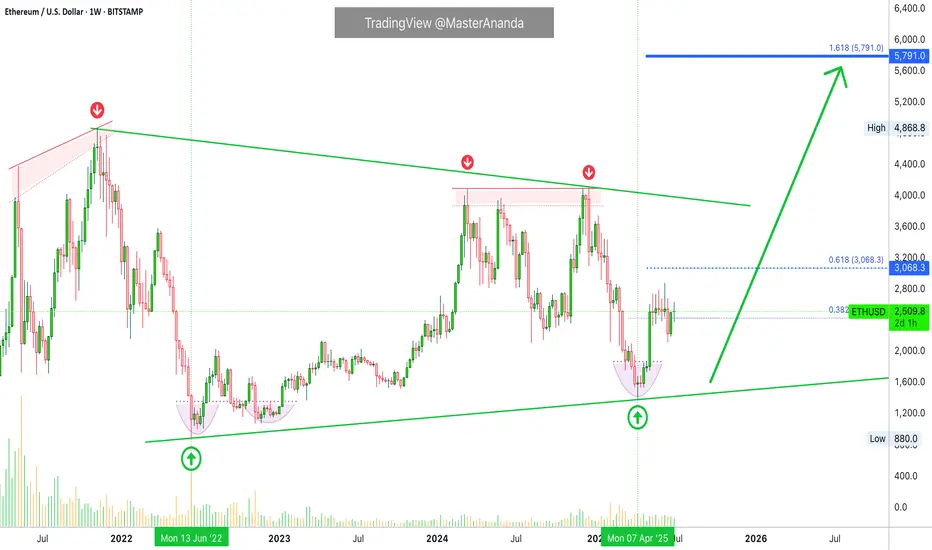
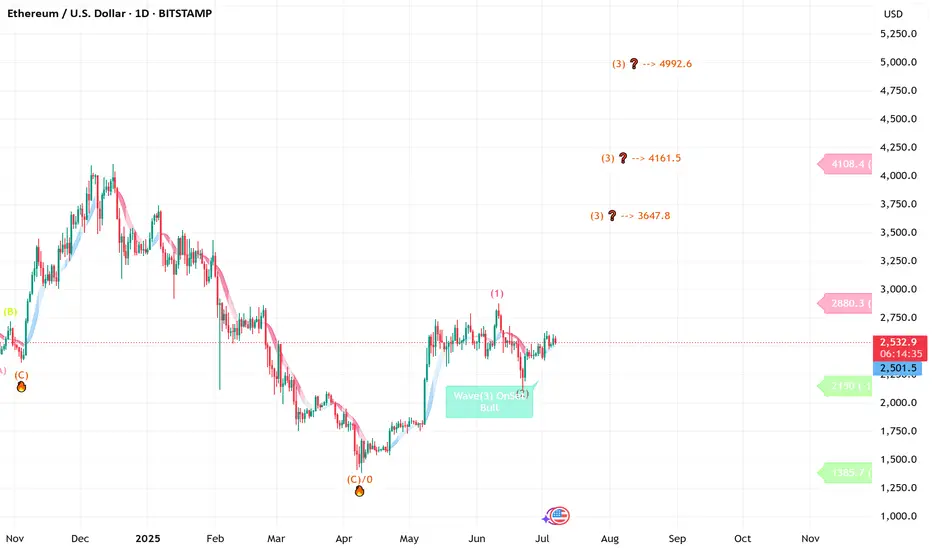
Ethereum $5,791 followed by $8,500 Late 2025Ethereum is due a major, major bullish wave. No new highs since March 2024. Double-top December 2024.
The bear market ended June 2022. April 2025 marks a long-term higher low.
So the peak remains flat, March 2024 vs December 2024. While the bottom is rising, June 2022 vs April 2025.
You could say the top is a lower high of course, November 2021 vs 2024. This is also valid. Even with a lower high top a bullish wave is due leading to a minimum of around $3,800 or $4,000; back to baseline.
Now, if we really want to talk about minimum because we really don't care about worst case scenario, the fundamentals are improving and everything is getting better, consider $5,791. This would be the minimum. With the Ethereum ETFs and the 2025 bull market, we then open up $8,500 and so on. Growth potential is unlimited and we will have to use our imagination. These numbers are good though and definitely a strong level where action will happen. You will see some resistance, some something going on when Ethereum reaches these numbers.
Ethereum is due a major, major bullish wave. It is not a question of "if," it is a question of "when." When will it happen? "If it happens?" No! When, will it happen?
It will happen in 2025. You can be certain about it... Just watch!
....
Ethereum (ETHUSDT) has been consolidating two months above support. Support being $2,425. One week it broke below this level just to recover the next week. More than 8 weeks sideways wicking lower and higher.
The 7-April low, candle and rounded bottom, as well as long-term higher low makes this date a clear bottom. From the bottom we grow. Once the bottom is hit, the trend changes. The trend has been bearish since March 2024. A long time in Crypto term. We are in the bull market year, 2025. What is not happening now, is what will happen next.
The market was bearish for a long time and that's ok. The good news are the waves within cycles... We just came out of a strong correction; we have a small recovery and consolidation. The initial breakout is being consolidated before additional growth.
Lots of thinking, lots of reasoning, lots of studying... Everything you need to know is already present on the chart. Ethereum will grow. Mark by words. It is already happening.
Thank you for reading.
Namaste.
Symplegades Part II – Ethereum at the Threshold of Breakout or B⚔️🌉 Symplegades Part II – Ethereum at the Threshold of Breakout or Breakdown 💥🧭
In the previous post, we explored Ethereum’s mythical challenge — the Symplegades, or Clashing Rocks. That post resonated, and now… here comes Part II.
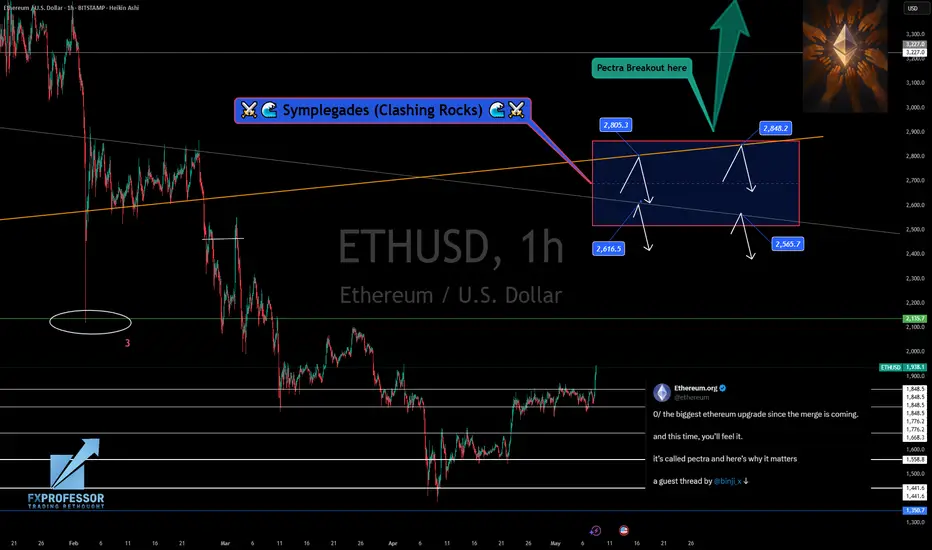
ETH is once again caught in a narrowing passage, this time defined by:
📌 $2,805 – $2,911 resistance overhead
📌 $2,616 – $2,565 support just below
💡 Pectra could be the fuel to break out — or just another wave that crashes on the rocks. The chart shows the potential for both:
➡️ A clean breakout could spark a move to “Destination 1” (~$4.8K)
⚠️ A rejection here might drag us back under $2.6K, even toward $2.1K and $1.8K zones
The Pectra breakout box is clear. But the market won’t hand it to us easily. It rarely does.
🧠 With Vitalik still “asleep,” it’s a tight spot. But if this move gathers momentum? We could be at the very start of Ethereum’s next wave.
📽️ The full video posted earlier today dives into this thesis and why macro + micro signals are conflicting but critical.
📊 Stay tuned — Bitcoin post is up next.
One Love,
The FXPROFESSOR 💙
Disclosure: I am happy to be part of the Trade Nation's Influencer program and receive a monthly fee for using their TradingView charts in my analysis. Awesome broker, where the trader really comes first! 🌟🤝📈
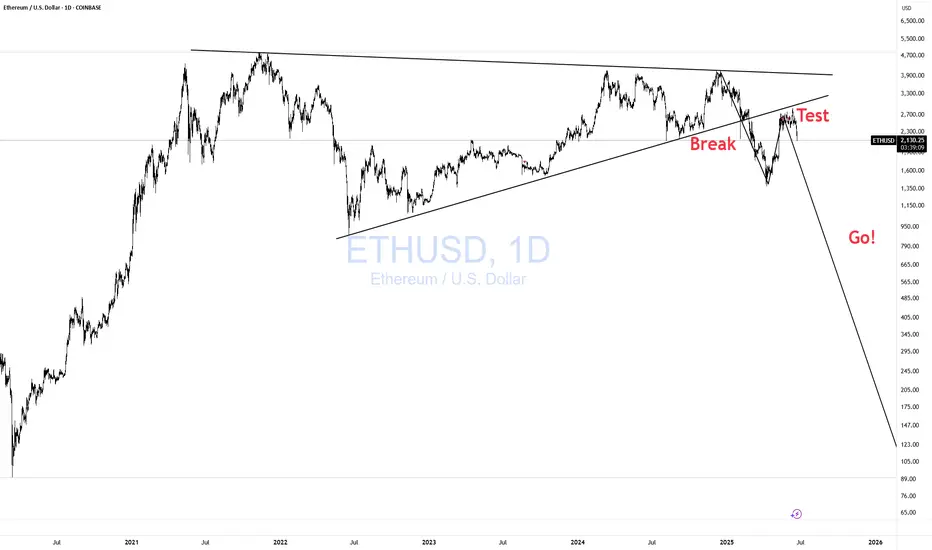
ETHUSD Break- Test- GO!!! Nothing Changed! 3rd EditionI have been warning about this for some time. Please visit my previous two posts for more info and updates.
Magic!
Click boost, follow, and subscribe for more. Let's get to 5,000 followers ))
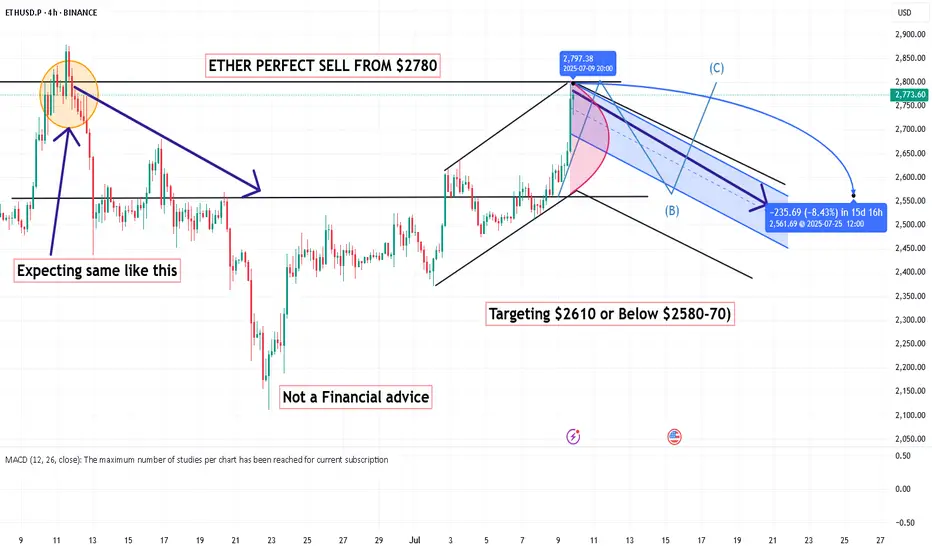
ETHER PERFECT SELL FROM $2780 ,Targeting $2610 or Below ETHER PERFECT SELL FROM $2780
Targeting $2610 or Below
Next level to consider for targets $2580-70 (According to market situation)
Not a Financial advice
"Ethereum Is The New Bitcoin" - Tom Lee ETH / Stablecoins Are the ChatGPT of Crypto
Stablecoins are exploding in adoption — just like ChatGPT took over AI and Ethereum is the engine driving that revolution. In this post, we break down 10 reasons why Tom Lee is extremely bullish on Ethereum and why it could be the single most important digital asset in the future of finance . If you're sleeping on ETH, this might be your wake-up call.
Top 10 Bullish Points from Tom Lee on Ethereum:
• Ethereum is the backbone of stablecoins , which Tom Lee compares to the “ChatGPT of crypto” due to their viral adoption and massive utility.
• Over 51% of all stablecoins operate on Ethereum , contributing to around 30% of the network’s total fees.
• Ethereum network fees could 10x as stablecoin usage grows from $250 billion to $2 trillion.
• Ethereum is positioned to lead the tokenization of real-world assets , including stocks and real estate.
• ETH could reach $10,000 if asset tokenization becomes a mainstream financial practice.
• Ethereum has a regulatory edge in the U.S. , making it the preferred platform for compliant financial innovation.
• A $250 million ETH treasury strategy is underway , aiming to use Ethereum as a long-term reserve asset.
• Institutions will buy and stake ETH to secure stablecoin networks, making ETH the “next Bitcoin.”
• Ethereum dominates the crypto ecosystem , with nearly 60% of activity including DeFi, NFTs, and dApps built on its chain.
• HODL ETH for long-term growth , as its utility, demand, and institutional support continue to rise.
Conclusion:
Ethereum isn’t just a Layer 1 blockchain — it’s becoming the core financial infrastructure for the digital age . As stablecoins expand and institutions enter, ETH could be the most asymmetric opportunity in crypto right now.
📢 Drop a like, leave your thoughts in the comments, and don’t forget to follow for more powerful macro + crypto insights. 👍👍

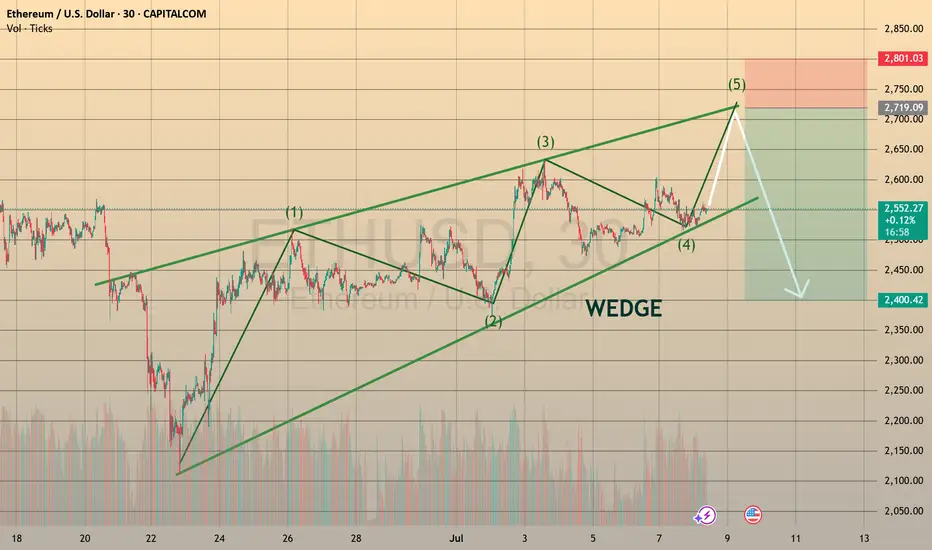
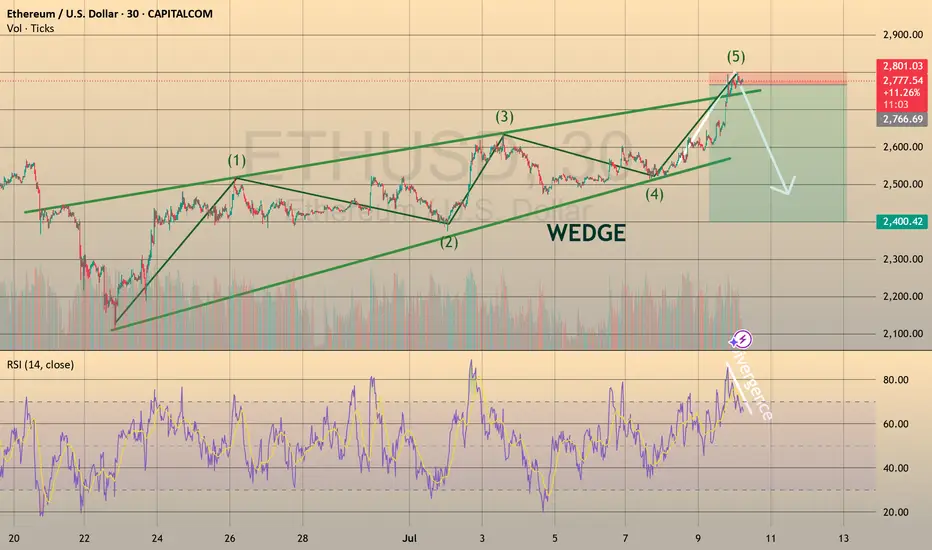
ETHUSD SHAPING THE BEARISH WEDGE, READY TO DECLINE
Ethereum has been forming the bearish wedge since the June 23th. The asset goes precisely according to Elliot 5-waves formation and is currently starting the wave E, rebounding from the lower border of the chart pattern.
What a trader may do?
We may go aggressive and trade long right immedia CAPITALCOM:ETHUSD tely with a take profit slightly below the 2,700.00 resistance level
🔼 a market buy order at 2544.19 with
❌a stop loss at 2489.90 and
🤑a take profit at 2691.35,
risk-reward ratio is 1:2.71 (nice one!)
However, I prefer to stay conservative and wait till the price tests the 2,700.00 level and enter the position there with
🔽 a pending sell stop order at 2691.35 with
❌a stop loss at 2759.92 and
🤑a take profit at 2409.89
risk-reward ratio here will be 1:4.1 (even better!)
In mid-term, I still expect ETHUSD to trade within a 2,400.00-2,700.00 range. So after assets reaches the 2,400.00, could be reasonable to look for new long opportunities! But will see.
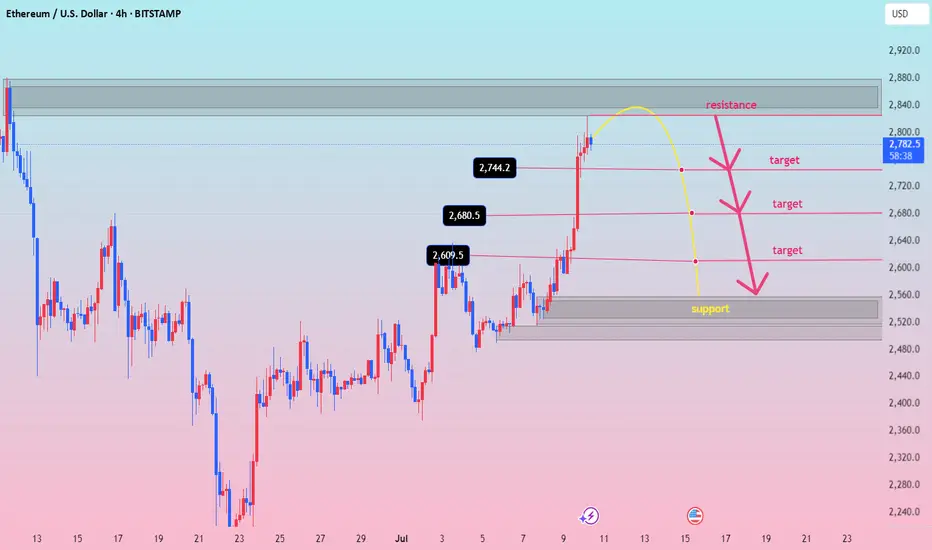
TRADING IDEA - ETHUSD SHORT
ETHUSD rose towards 2,700.00 level and reached the take profit. And even went further towards 2,800.00 resistance level despite my 2,700.00 retest predict! (pic 1)
So, congrats to everyone, who stayed long here, we took the cash!💵
I am preparing for the next trade. Here is the plan: if the price rises once again towards 2,800.0 resistance level and retests it, I will open the short position with
🔽 a pending sell stop order at 2796.84 with
❌a stop loss at 2818.86 and
🤑a take profit at 2740.05
Additionally, the RSI shows divergence on 30-m timeframe.
I suppose this to be quick trade. Will see how it will work out.
ETHUSD h4 next move downThe resistance at 1.36554 may be weak due to:
Multiple taps already
Reduced seller interest
A breakout above this zone could trigger short covering → sharp rally
✅ 2. Higher Low Structure
Recent low at 1.35475 held strong
Current consolidation appears like a bullish flag or accumulation range
Could indicate continuation, not rejection
✅ 3. Fakeout Reversal Setup
If price dips into the support at 1.35475 again, it might:
Trap breakout traders
Reverse and form a new impulse leg upward
Target = 1.3700–1.3750 zone
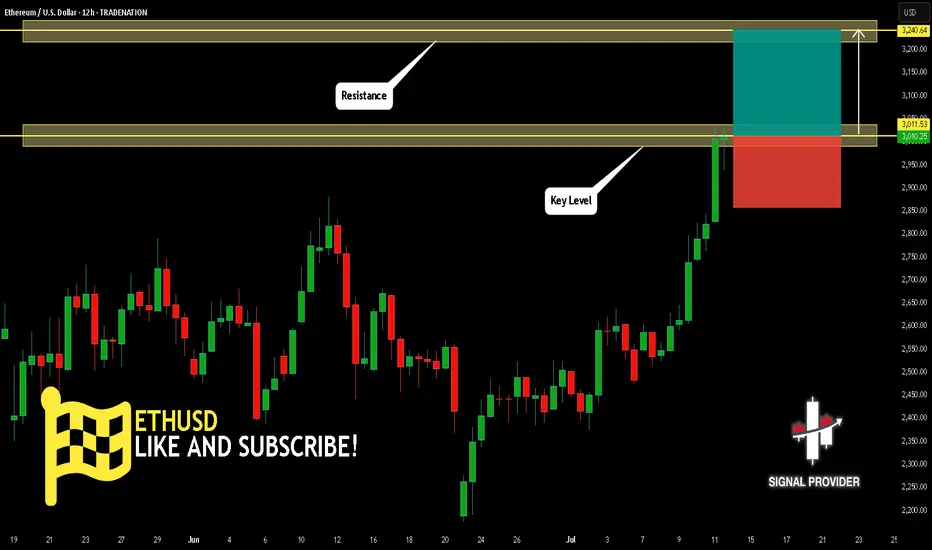
ETHUSD Is Going Up! Buy!
Please, check our technical outlook for ETHUSD.
Time Frame: 12h
Current Trend: Bullish
Sentiment: Oversold (based on 7-period RSI)
Forecast: Bullish
The market is approaching a key horizontal level 3,011.53.
Considering the today's price action, probabilities will be high to see a movement to 3,240.64.
P.S
The term oversold refers to a condition where an asset has traded lower in price and has the potential for a price bounce.
Overbought refers to market scenarios where the instrument is traded considerably higher than its fair value. Overvaluation is caused by market sentiments when there is positive news.
Disclosure: I am part of Trade Nation's Influencer program and receive a monthly fee for using their TradingView charts in my analysis.
Like and subscribe and comment my ideas if you enjoy them!
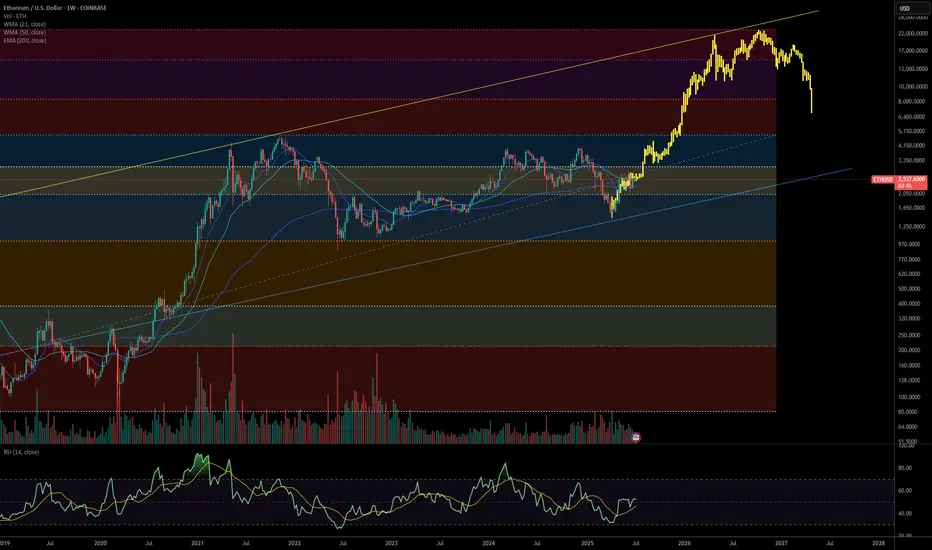
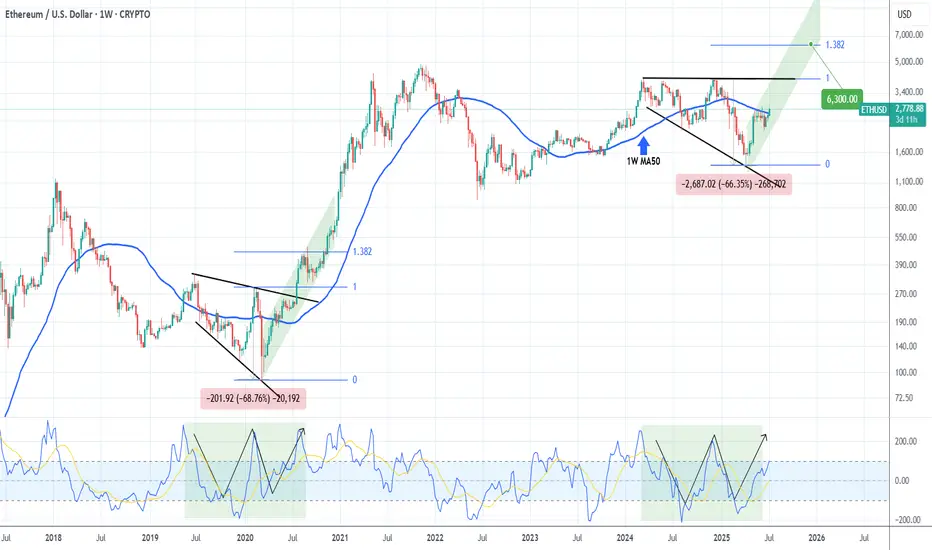
ETHEREUM ahead of the most critical break-out of the Cycle.Ethereum (ETHUSD) is on the cusp of a major bullish break-out as this week it is already trading above its 1W MA50 (blue trend-line). If it manages to close the 1W candle above it, it will be the first time since January 06 2025 to do so.
This whole price action remains inside a massive Megaphone pattern and resembles the same structure ETH had during June 24 2019 - July 20 2020. Both patterns had a final decline of around -67% with the 2020 structure eventually starting a (green) Channel Up that broke above the Megaphone and made a first Top on the 1.382 Fibonacci extension.
As a result, if the break-out does happen this time around also, we expect the emerging Channel Up to target at least $6300 (Fib 1.382 ext).
-------------------------------------------------------------------------------
** Please LIKE 👍, FOLLOW ✅, SHARE 🙌 and COMMENT ✍ if you enjoy this idea! Also share your ideas and charts in the comments section below! This is best way to keep it relevant, support us, keep the content here free and allow the idea to reach as many people as possible. **
-------------------------------------------------------------------------------
💸💸💸💸💸💸
👇 👇 👇 👇 👇 👇
ETH ( Ethereum ) lovers looking strong for long term ETH -----Daily counts indicate Excellent bullish wave structure.
Both appear to be optimistic and this stock invalidation number (S L) wave 2 low
target short / long term are already shared as per charts
correction wave leg seems completed
Investing in declines is a smart move for short/ long-term players.
Buy in DIPS recommended
Long-term investors prepare for strong returns over the next two to five years.
one of best counter
Every graphic used to comprehend & LEARN & understand the theory of Elliot waves, Harmonic waves, Gann Theory, and Time theory
Every chart is for educational purposes.
We have no accountability for your profit or loss.
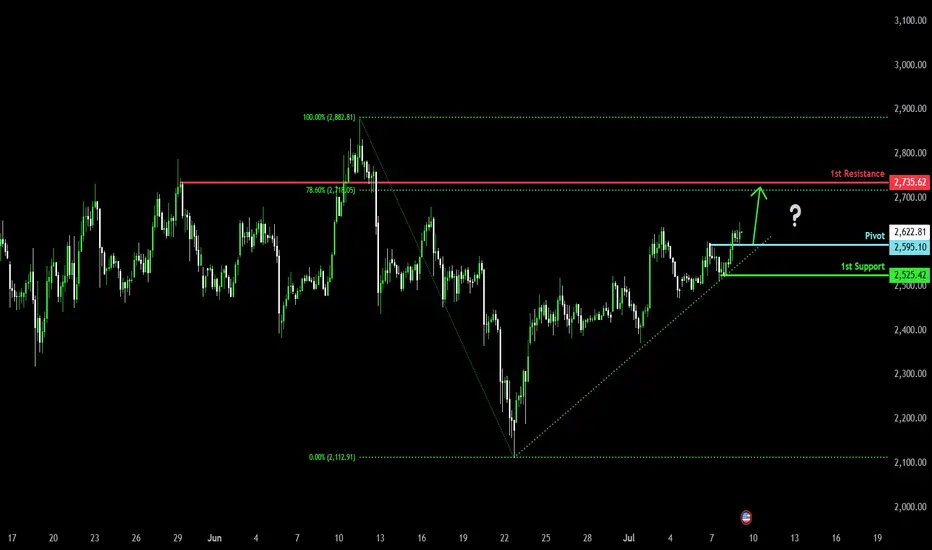
Bullish momentum to extend?Ethereum (ETH/USD) is reacting off the pivot which is a pullback support and could rise to the 78.6% Fibonacci resistance.
Pivot: 2,595.10
1st Support: 2,525.42
1st Resistance: 2,735.62
Risk Warning:
Trading Forex and CFDs carries a high level of risk to your capital and you should only trade with money you can afford to lose. Trading Forex and CFDs may not be suitable for all investors, so please ensure that you fully understand the risks involved and seek independent advice if necessary.
Disclaimer:
The above opinions given constitute general market commentary, and do not constitute the opinion or advice of IC Markets or any form of personal or investment advice.
Any opinions, news, research, analyses, prices, other information, or links to third-party sites contained on this website are provided on an "as-is" basis, are intended only to be informative, is not an advice nor a recommendation, nor research, or a record of our trading prices, or an offer of, or solicitation for a transaction in any financial instrument and thus should not be treated as such. The information provided does not involve any specific investment objectives, financial situation and needs of any specific person who may receive it. Please be aware, that past performance is not a reliable indicator of future performance and/or results. Past Performance or Forward-looking scenarios based upon the reasonable beliefs of the third-party provider are not a guarantee of future performance. Actual results may differ materially from those anticipated in forward-looking or past performance statements. IC Markets makes no representation or warranty and assumes no liability as to the accuracy or completeness of the information provided, nor any loss arising from any investment based on a recommendation, forecast or any information supplied by any third-party.
Ethereum Faces the 'Symplegades'– Will Pectra Propel It Through?Ethereum Faces the 'Symplegades' – Will Pectra Propel It Through?
⚔️🪨 Ethereum Faces the 'Symplegades' – Will Pectra Propel It Through? 🪨⚔️
In ancient Greek myth, the Symplegades — Clashing Rocks — tested Jason and the Argonauts with a narrow, deadly passage. Today, Ethereum faces its own mythic trial as price action presses into a critical zone.
📍 The $2,805–$2,848 resistance zone is acting like the Clashing Rocks — volatile, dangerous, and decisive. Beneath it, support rests near $2,616 and $2,565 . A breakout from this trap can open the way to $3,200+ , but rejection may mean another violent plunge. ⚠️
🔧 Enter: PECTRA – Ethereum’s Game-Changing Upgrade
Ethereum’s most ambitious upgrade since The Merge is nearly here. PECTRA isn’t just a backend update — it redefines how the network feels and functions:
🧠 Smarter Wallets
– Batch transactions
– Skip approval popups
– Pay gas in any token
⚡ Frictionless UX
– Fewer clicks
– No more endless “approve + confirm” loops
📉 Cheaper Transactions
– More blobs = better L2 scaling
– Lower fees, even during congestion
🌱 Staking Overhaul
– Validator cap raised to 2048 ETH
– Smart contract withdrawals
– Faster deposit recognition
🔓 Unlocking $490B in trapped value
– Assets become more accessible and usable
“The Merge changed how Ethereum works.
Pectra changes how it feels. ” – @ethereum
⛵ Will ETH Break Through the Clashing Rocks?
This is not just another consolidation box.
It’s a moment of mythic symmetry — where price action, fundamentals, and network transformation converge.
Sail through the Symplegades... or get crushed between them?
Stay sharp. Watch the breakout. The next move will be defining.
One Love,
The FXPROFESSOR 💙
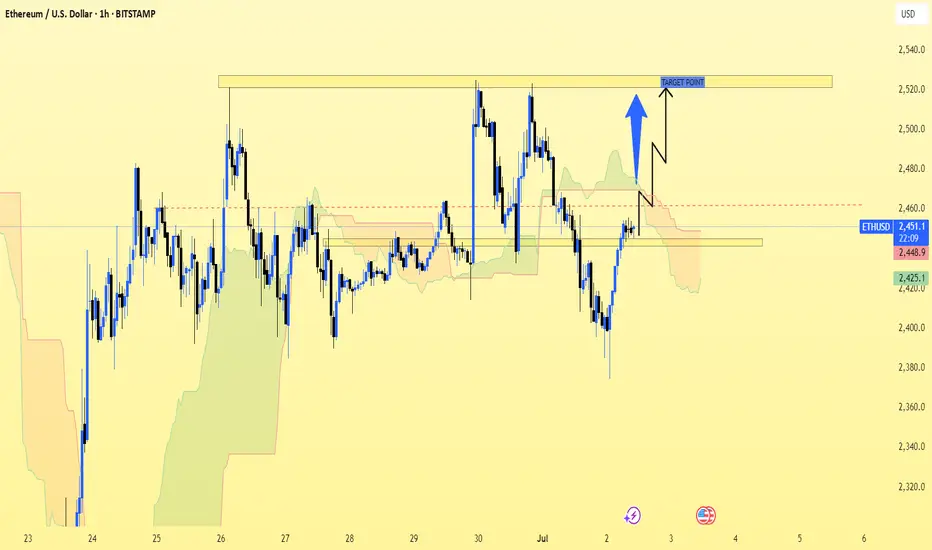
ETH/USD (Ethereum to US Dollar) on the 1-hour timeframe. ETH/USD (Ethereum to US Dollar) on the 1-hour timeframe.
Here’s a quick breakdown of what’s visible:
There is an Ichimoku Cloud indicator on the chart.
A resistance zone is marked at the top (around $2,540 – $2,550).
A support zone appears around $2,440 – $2,460.
There's a bullish arrow pointing toward the resistance zone, suggesting an expected upward movement.
🎯 Target:
Based on the chart setup and your markup:
Short-term bullish target (Take Profit): $2,545 – $2,550
Entry zone appears to be: Around $2,460
Stop loss (if managing risk): Below $2,430
This setup looks like a range play or breakout attempt, betting on ETH bouncing off support and retesting resistance.
.
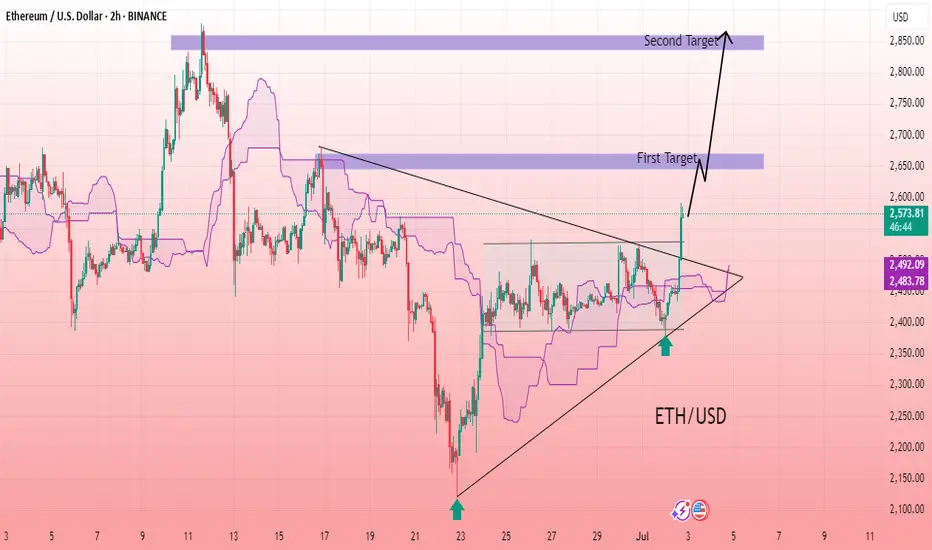
Ethereum Breakout Unleashed: Major Upside Targets in Sight The ETH/USD 2-hour chart reveals a classic ascending triangle formation, which has now been decisively broken to the upside. After consolidating within a tightening range for several sessions, Ethereum has surged past the horizontal resistance level, supported by Ichimoku cloud structure and rising trendline support. The breakout candle is strong, indicating bullish momentum and potential for further upward movement. The breakout aligns with increasing volume and market confidence. This technical setup suggests a possible rally continuation toward higher resistance zones marked above. The structure remains bullish as long as price holds above the breakout zone with minimal retracement.
Entry: 2,570
1st Target: 2660
2nd Target: 2,850
Ethereum Stalls at $3,101.0FenzoFx—Ethereum broke past $2,880.0 but stalled near a bearish fair value gap. The daily chart shows a longwick bearish candlestick, signaling increased selling pressure.
With Stochastic at 90.0, ETH is short-term overbought. Resistance is at $3,101.0—if it holds, ETH may retreat to $2,880.0 or $2,638.0.
A close above $3,101.0 would invalidate the bearish outlook and pave the way toward $3,330.0.

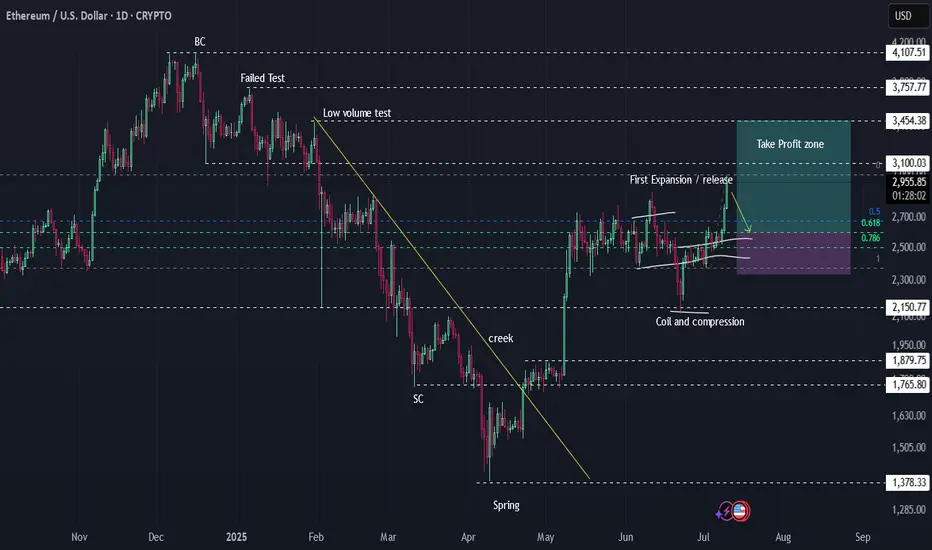
ETHUSD | Wyckoff Accumulation, Compression & Expansion PlaybookMapping out Ethereum’s journey through classic Wyckoff phases: from Buying Climax and Failed Test (distribution/markdown) to Spring and Accumulation (SC, creek, and “spring” event). After months of compression and failed breakout attempts, ETH unleashed its first expansion/release move, trapping late bears and rewarding patient entries.
Take note: The first expansion candle after a long coil is rarely the spot to FOMO. Best R:R comes from waiting for the retrace to the 0.618–0.786 zone, where smart money reloads and risk is tightly defined.
Key Levels:
Compression/Coil range = accumulation
Retest/retrace = sniper entry zone (purple box)
If you missed the first push, don’t chase—let the retrace come to you.
Chart markup: Wyckoff logic, supply/demand, coil/expansion, R:R zones.
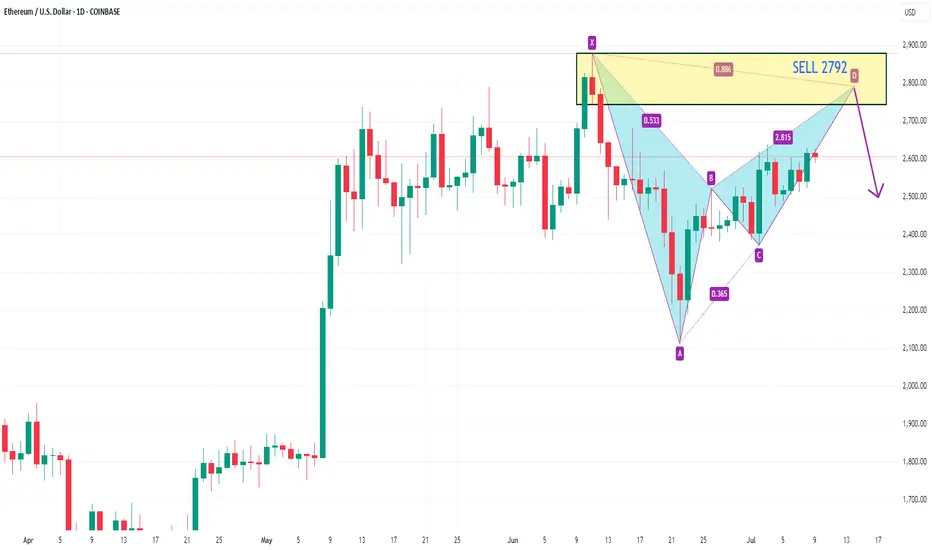
ETHUSD SELL 2792On the daily chart, ETHUSD stabilized and rebounded, and short-term bulls have the upper hand. At present, we can pay attention to the resistance near 2792 above, which is a potential short position of the bearish bat pattern, and this position is in the previous supply area.
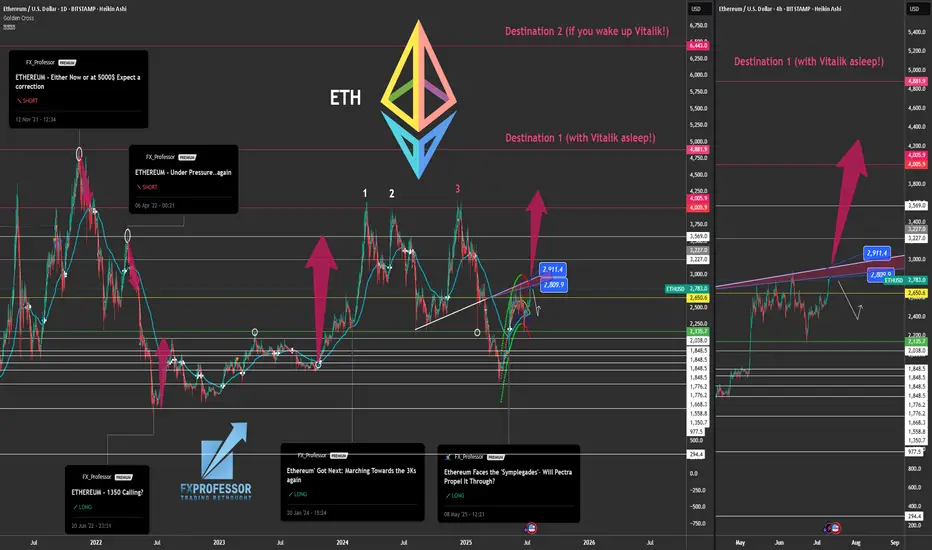
Major Breakout– Ethereum Broke Free from 'Clashing Resistances'🚀💥 Major Breakout – Ethereum Broke Free from the Clashing Resistances 🔓🟣
ETH has finally done it.
After months of battling overlapping resistances — the Clashing Stones, as we called them — Ethereum has broken out, and $2,912 is now acting as support, not resistance.
This breakout isn't just technical, it’s structural.
The previous 1-2-3 rejection setup has now been invalidated.
🔎 Chart Summary:
✅ $2,912 = confirmed breakout zone
🎯 Destination 1: $4,881 (if Vitalik’s asleep 😴)
🚀 Destination 2: $6,443 (if he wakes up 💡)
🔭 Scroll up for Destination 3
This is the real ETH breakout we’ve waited for — not hopium, not chop. This is clear structure.
If BTC stabilizes near 114,921+, ETH could enter outperformance mode and gain serious traction on the ETH/BTC chart.
📢 Keep your eyes on narrative catalysts:
ETH ETF, L2 growth, and Vitalik waking up...
We are officially off the resistance — and heading to where few have charted before.
One Love,
The FXPROFESSOR 💙
📌 Long — as long as $2,912 holds. If it fails, you already know what to do.
Disclosure: I am happy to be part of the Trade Nation's Influencer program and receive a monthly fee for using their TradingView charts in my analysis. Awesome broker, where the trader really comes first! 🌟🤝📈

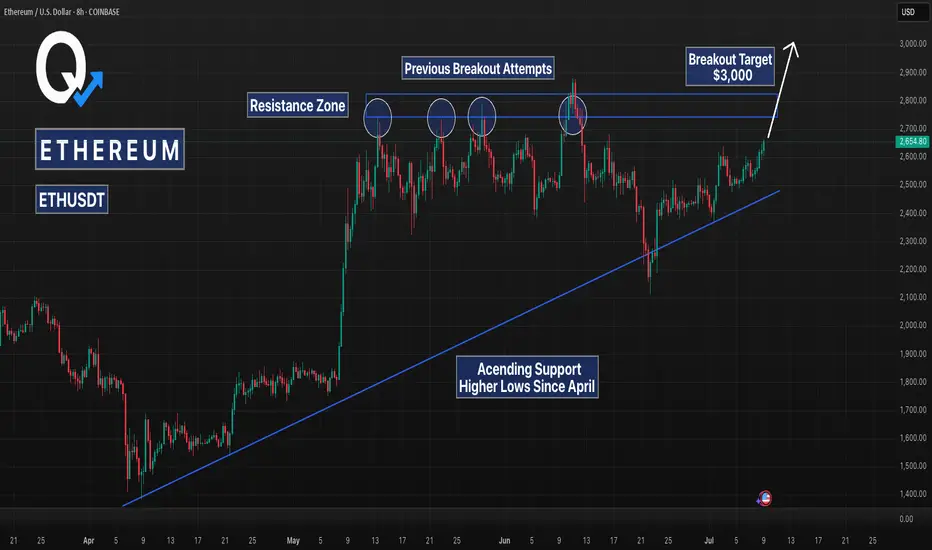
ETHUSD 8H – Moving Toward Breakout After Months of AccumulationEthereum has been trading within a large ascending structure since April, forming consistent higher lows while repeatedly testing overhead resistance between $2,730 and $2,850. This is a classic example of a compressed range setup where buyers gradually gain strength beneath a defined ceiling, leading into a potential breakout scenario.
The chart highlights the key structural components of this setup:
An ascending support trendline has been respected for over two months, showing persistent bullish pressure on each dip.
A multi-month resistance zone has capped every breakout attempt since early May, with multiple upper wick rejections confirming this level as major overhead supply.
Most recently, ETH bounced cleanly off the rising trendline again, forming yet another higher low, reinforcing the bullish structure.
If this pattern holds, Ethereum is approaching a technical inflection point. A breakout above $2,850 with strong volume and follow-through could trigger a rapid move toward the $3,000–$3,200 range. That move would align with the measured move from the height of the ascending triangle formation.
However, if price is rejected again from resistance, the ascending trendline remains a key support level to watch for another potential retest. A breakdown below $2,400 would invalidate the pattern and open the door to a deeper retracement.
Key Technical Zones:
Support: Rising trendline from April lows (~$2,400–$2,500)
Resistance: Horizontal zone between $2,730 and $2,850
Breakout Target (on confirmation): $3,000–$3,200
Strategy Notes:
Bias remains bullish while higher lows continue to hold
Breakout setups often benefit from confirmation (candle close above resistance with volume)
Rejections from resistance could offer opportunities to re-enter at trendline support