New phase of ETH adoption? holding longLot of bills and adoption of ETH ecosystem, i do like the idea of another 2017 like breakout, CRYPTOCAP:ETH COINBASE:ETHUSD
ETHUSD trade ideas
ETHUSD - Stretched price. Pullback to CL likelyPrice tagged the U-MLH, the stretch level.
Think of it like the 2nd STDV.
Now think Mean Reversion.
With such a stretch, price has a high chance to revert to the mean - down to the Centerline (CL).
What is this information good for?
a) take profit (...or 50% partial)
b) short on intrady signs
But if it is open and close above the U-MLH, then there's a good chance that price is advancing to the Warning Line, the extension of the Center to U-MLH.
Let's observe what happens.

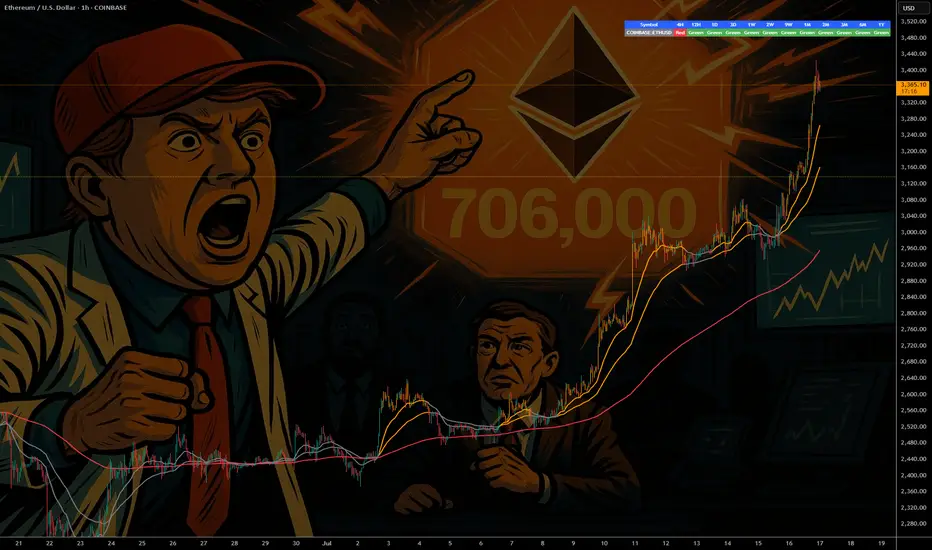
ETH - If You Know ...... You Know whats Coming
NYSE:BLK $BUIDL tokenized U.S.-Treasury fund launched on COINBASE:ETHUSD in Mar 2024—Wall Street is already settling real dollars on-chain.
NYSE:JPM JPMD stablecoin just went live on Base (an COINBASE:ETHUSD L2), piping wholesale payments from a $4 T balance-sheet straight through COINBASE:ETHUSD rails.
COINBASE:ETHUSD isn’t just riding the next crypto cycle—it’s becoming Wall Street’s settlement layer. From BlackRock’s on-chain Treasury fund to JPMorgan’s and soon Bank of America’s dollar tokens, a tidal wave of institutional stable-coin flows is lining up behind ETH. Fewer coins, more real-world volume—if you know, you know what’s coming.
NYSE:BAC CEO says they’ll issue a dollar-backed token the moment regulators nod—another tier-1 bank boarding the Ethereum train.
Stablecoin cap has blasted past $230 B , with 80 %+ of all on-chain transfers riding Ethereum (plus BSC) blocks.
Corporate settlements via stablecoins grew 25 % YoY in 2024 as multinationals replaced SWIFT with instant on-chain clearing.
Daily stablecoin throughput averages $7 B—each hop burning ETH and tightening supply.
BCG projects tokenized real-world assets to exceed $16 T by 2030 , with EVM chains as the default plumbing.
Over 500 M wallets already interact with stablecoins , a 30 % YoY surge led by emerging-market demand.
L2s like BINANCE:ARBUSDT & BINANCE:OPUSDT cut transaction fees 35 % yet still settle back to mainnet—meaning ETH captures the fee stream and the burn.
Bottom line: a tidal wave of bank-grade stablecoins + tokenized assets is lining up behind ETH; supply shrinks, demand soars—if you know, you know what’s coming.
quote] Marty Boots | 17-Year Trader — smash that , hit LIKE & SUBSCRIBE, and share your views in the comments below so we can make better trades & grow together!
Ethereum: Overbought Conditions Persist Near $3,746ETH is testing the volume point of interest at $3,417.0, while strong resistance and an order block reside at $3,746.0. Indicators remain in overbought territory, signaling short-term overpricing.
With little resistance shown in the volume profile, ETH is expected to fall back and retest the $3,404.0 support level. Traders and investors should monitor this zone closely for a potential bullish setup.

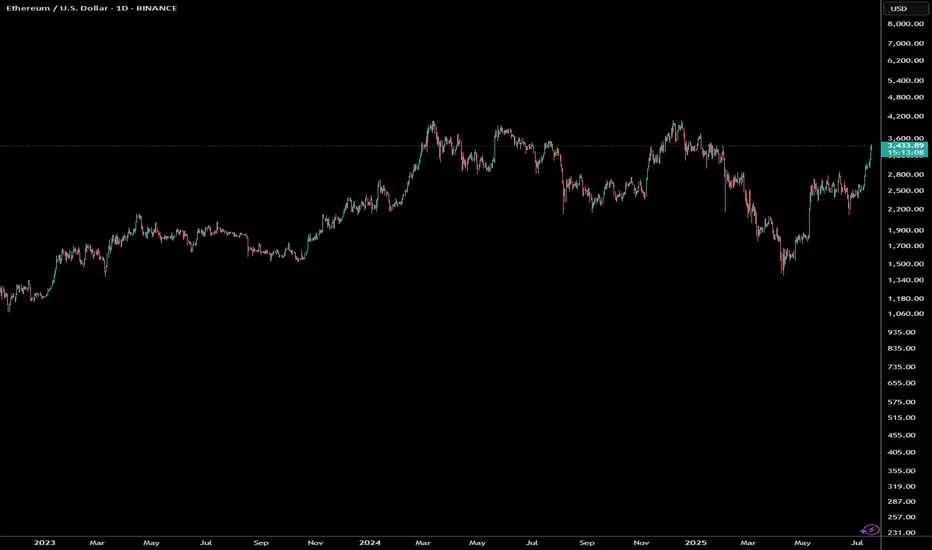
Ethereum – Calm Before the Next Leg Up?Ethereum had a disappointing start in 2025.
After pushing above $4,000 in mid-December 2024 — with headlines full of "$10K ETH coming!" — the new year began around $3,500, and what followed was a slow bleed.
By early April, Ethereum printed a shocking low at $1,380 — a level few believed was even possible.
But the bounce from there? ⚡
It was explosive — nearly +100% in just one month, with price topping around $2,700.
Since then, we’ve been consolidating — and that’s completely normal after such a vertical move.
🔍 So, what’s next?
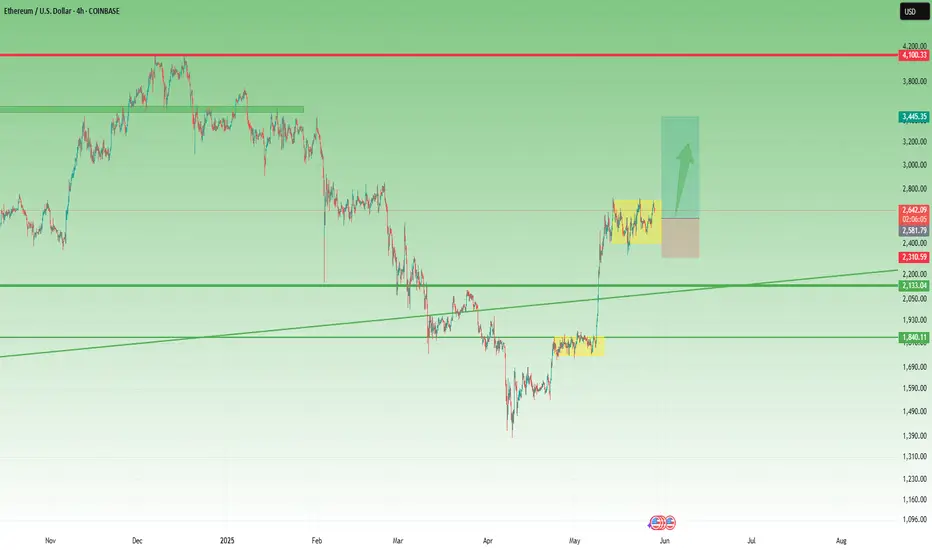
Technically, ETH is forming a rectangle, a structure that often resolves as a continuation pattern.
The spike down to the $2,300 zone on May 19th was telling — buyers stepped in aggressively and pushed price back above $2,500, which now acts as a comfort zone for bulls.
📌 Conclusion
I’m looking to buy dips, ideally near $2,550, and my target is the $3,500 zone.
No need to reconsider the bullish outlook as long as price holds above $2,300.
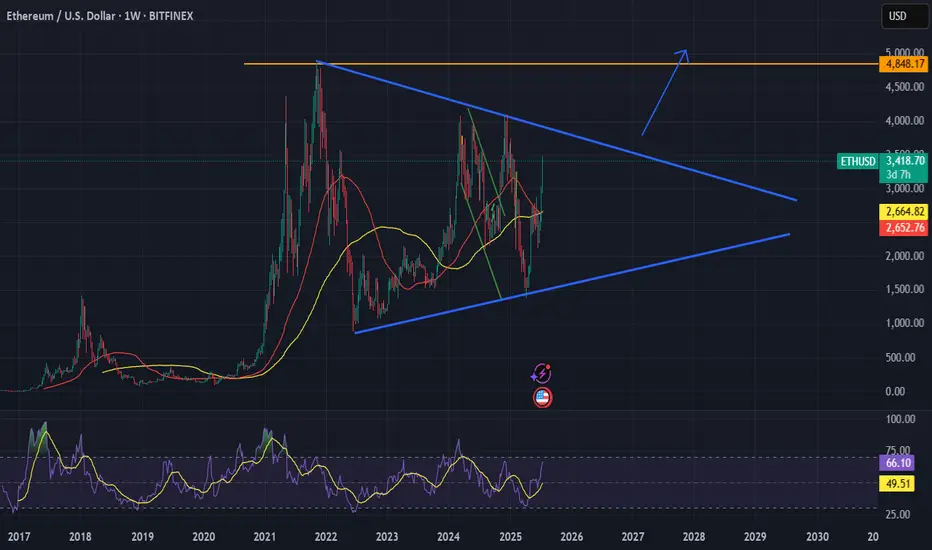
eth,long trend is comingmaybe last from 2025 to 2026
key points:4000,4800
Big big guess, value around $1 trillion, price near $8000

Ethereum UP UP UPThe Perfect Storm: Multiple Technical Indicators Align for ETH's Next Leg Up
With Ethereum currently trading at $3,429, a comprehensive multi-faceted technical analysis reveals compelling evidence for continued bullish momentum through the remainder of 2025. Let's dive into the convergence of powerful technical signals pointing to ETH's next major move.
RSI: Hidden Strength Behind the Momentum
While Ethereum's daily RSI hovers around 72-73, typically considered overbought territory, this actually represents strength rather than exhaustion in a powerful bull trend. Historical analysis shows that during Ethereum's strongest rallies, RSI can maintain readings above 70 for extended periods, often reaching 80-85 before meaningful corrections.
The weekly RSI at 66 is particularly telling—showing robust momentum without reaching extreme levels. This creates the perfect scenario: strong enough to maintain upward pressure, yet not overheated enough to trigger immediate profit-taking. This "Goldilocks zone" for RSI often precedes the most explosive phases of bull markets.
Wyckoff Accumulation: The Smart Money Footprint
The recent price action perfectly aligns with Wyckoff's "Re-accumulation After Spring" pattern:
The May 2025 low represented a classic "Spring" that flushed out weak hands
The subsequent rally formed a textbook "Sign of Strength" (SOS)
We've completed the "Backup" phase with higher lows
Current price action suggests we're at the "Last Point of Support" (LPS)
According to Wyckoff methodology, this LPS typically precedes the most powerful "Mark-Up" phase—where institutional accumulation transitions to public participation and price discovery accelerates dramatically. The completion of this pattern projects a move to the $4,500-$5,000 range within the forecast period.
Order Blocks: Institutional Footprints Reveal the Path Forward
Order block analysis reveals significant institutional buying between $3,000-$3,200, creating a formidable support zone. More importantly, there's a notable absence of major selling order blocks above current levels until approximately $3,800-$4,000.
This "clean air" above current prices suggests minimal resistance and the potential for rapid price appreciation once momentum builds. The most significant buy-side order blocks have been forming during recent consolidations, indicating smart money accumulation before the next leg up.
Volume Profile: The Silent Confirmation
Volume analysis provides the confirmation needed to validate our bullish thesis:
Rising prices accompanied by increasing volume (particularly on up-days)
Volume Profile shows thin areas above $3,500, suggesting potential for rapid price discovery
The Volume-Weighted Average Price (VWAP) continues to slope upward, confirming the strength of the trend
The Volume Point of Control (VPOC) has shifted higher in recent weeks, indicating accumulation at higher prices—a classic sign of institutional confidence.
Fibonacci Projections: Mathematical Roadmap to Higher Targets
Using the recent swing low of $2,150 (May 2025) to the current level as our base measurement:
The 161.8% extension projects a target of approximately $4,200
The 200% extension suggests a move toward $4,700
The 261.8% extension (often reached in strong bull markets) points to $5,400+
What's particularly bullish is that these Fibonacci extensions align perfectly with key psychological price levels and unfilled liquidity pools above the market.
Elliott Wave Structure: The Roadmap to $5,000
The current Elliott Wave count suggests we're in the early stages of a powerful Wave 3 of 5 from the May lows:
Wave 1: $2,150 to $2,800
Wave 2: Pullback to $2,450
Wave 3: Currently underway, targeting $4,200-$4,500 (typical Wave 3 = 1.618 × Wave 1)
Wave 4: Future consolidation likely in the $3,800-$4,000 range
Wave 5: Final push potentially reaching $4,800-$5,200
Wave 3 is typically the longest and most powerful in the Elliott sequence, suggesting we're entering the most explosive phase of this bull cycle.
Price Projection Timeline
July-August 2025:
Initial push through the $3,600 resistance level, followed by accelerating momentum toward $3,800-$4,000. Any pullbacks will find strong support at $3,200, creating ideal entry opportunities for those who missed the initial breakout.
September 2025:
Breakthrough of the psychological $4,000 barrier, triggering increased media attention and retail participation. This phase could see rapid price discovery to $4,200-$4,400 as volume expands dramatically.
October-November 2025:
Final wave extension pushing ETH toward the $4,800-$5,200 range, potentially culminating in a blow-off top characteristic of Wave 5 completions. This represents a 40-50% appreciation from current levels.
The Confluence That Cannot Be Ignored
What makes this analysis particularly compelling is the rare confluence of multiple technical frameworks all pointing to the same conclusion. When Wyckoff accumulation patterns, Elliott Wave projections, Fibonacci extensions, RSI momentum, and order block analysis all align, the probability of the projected outcome increases exponentially.
Smart money is positioning for this move now, as evidenced by the order block formation and volume patterns. For the strategic investor, the current price level—despite being near recent highs—represents an attractive entry point before the next major leg up in Ethereum's journey.
The technical roadmap is clear: Ethereum is poised for a significant appreciation through the remainder of 2025, with multiple technical frameworks projecting targets in the $4,500-$5,200 range by year-end.
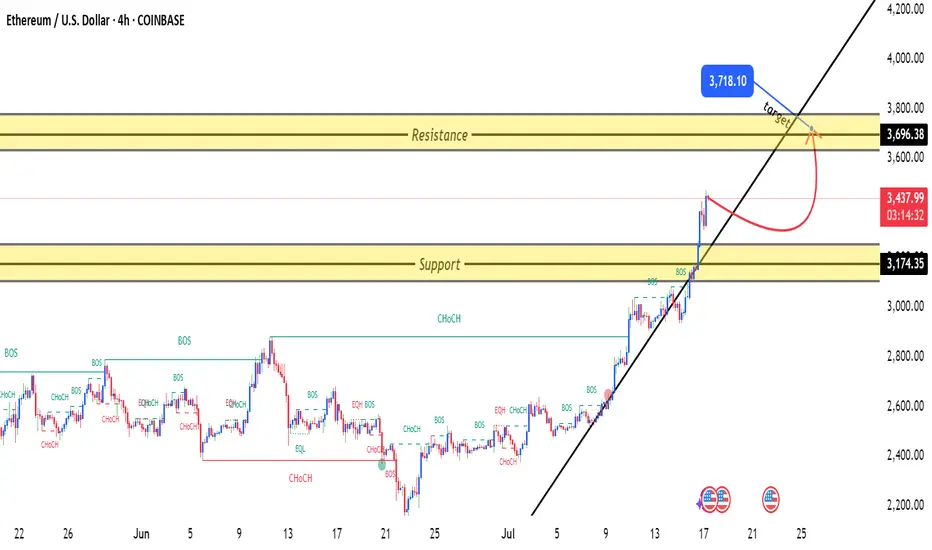
ETHUSD 4H TIME FRAME ETHUSD is showing bullish momentum on the 4-hour chart with a strong structure to support further upside. The setup targets a potential continuation to 3,718.8, with protective risk control below 3,250.4. Watch for a clean break above 3,540 to accelerate the bullish move.
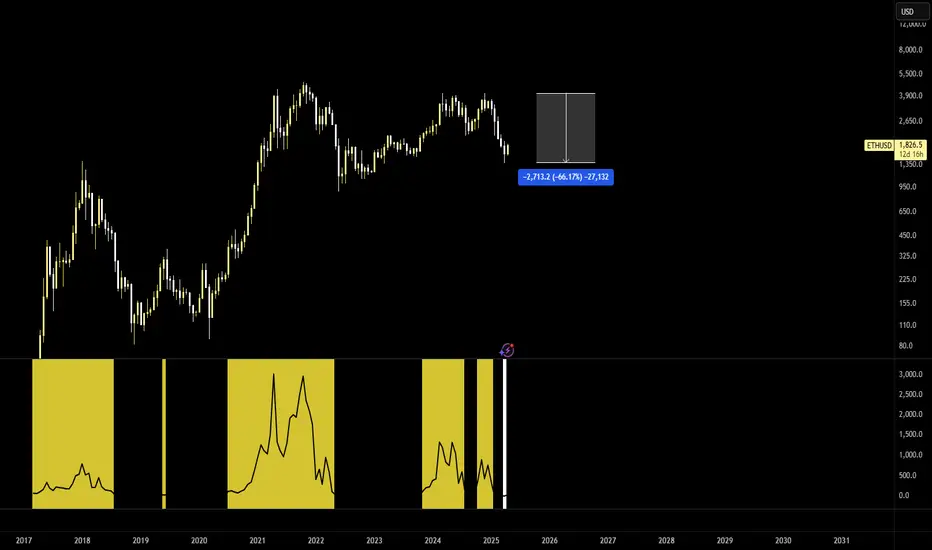
Ethereum´s local and possibly even macro bottom is in!- first ever White Stripe present on the 3W which is a very high time-frame
- Eth has experienced a more than 60% drop ever since the highs with no real relief inbetween
- at the very least, a strong bounce to 2400, 2500 is expected
- there is also the possibility that this is THE bottom before eventually Eth makes new ATHs, possibly this but probably next year
$ETH Bullish Set up Ethereum just started bull move .Five wave move could take it to all time high of 17k .....

Next Stop -> 4K4 out of 4 historical times -> Ethereum has hit 4K in 1 to 2 weeks after breaking 2K and 3K sequentially.

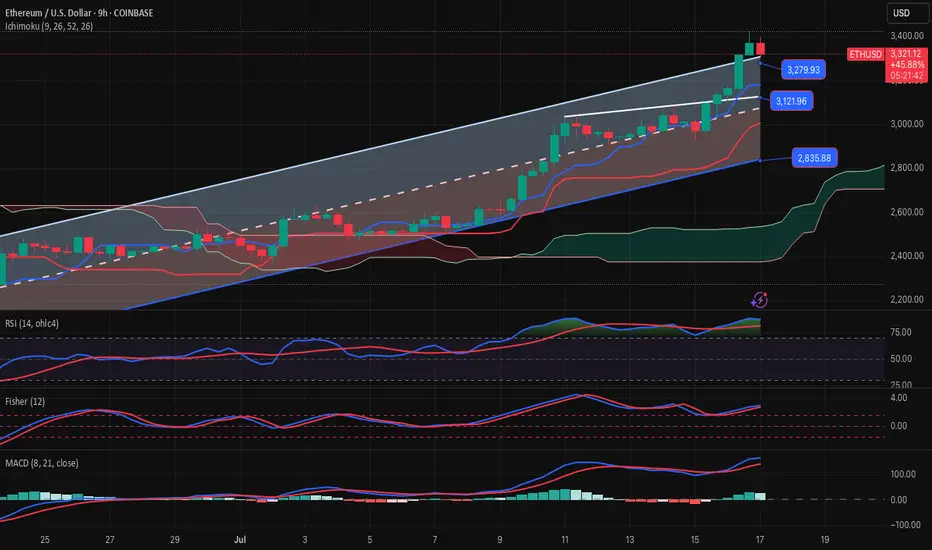
ETHUSD-SELL strategy 9 hourly chart Reg.ChannelNo doubt Crypto is more volatile than other asset classes, and even when very overbought it can run higher. It does not change the over all picture, and recovery is required over time. The correction is like to bring us back towards $ 2,875 area overall, but in steps .
Strategy SELL @ $ 3,300-3,375 and take profit near $ 3,025 at first, and re-sell after for a profit near $ 2,875.
ETHUSD one more downside motion possible follow entry rulesHey people,
no divergence showing up through the previous downside impulse, meaning, one more move down before long term upside is probable,

ETHUSD – Possible Correction from Channel Resistance!Pair: ETH/USD
Timeframe: 4H
Structure: Ascending Channel
Indicators: RSI Overbought, Bearish Divergence Forming
Volume: Spike into resistance
📉 What’s happening?
Ethereum just tagged the top of its ascending channel, showing early signs of rejection. RSI is hovering near overbought, with weakening momentum on the last push.
⚠️ Caution Zone:
$3,425 acting as upper resistance
Price may retrace to midline or lower channel support ($3,250 → $3,050 range)
📌 Confirmation:
Look for:
A strong bearish candle or
RSI breaking below 60
Volume divergence
Bias: Short-term bearish correction, bullish structure intact as long as price holds the channel.

ETH READY TO RIPAfter enduring a prolonged and painful correction, Ethereum has tested the patience of many crypto investors, particularly those anticipating the long-awaited arrival of altcoin season. Sentiment across the space has remained cautious, as repeated failed rallies and a lack of follow-through have left many questioning whether the broader alt market will ever regain momentum.
However, there are now early indications that conditions may be shifting. A notable bounce has occurred from the overall low anchored VWAP—a level that has historically acted as a key reference point for value and trend continuation. The presence of responsive buyers at this level suggests it may be establishing itself as a strong demand zone, potentially forming the foundation for a broader structural reversal.
Additionally, subtle but important changes in market structure are beginning to emerge. We're seeing higher lows form on shorter timeframes, alongside a reduction in selling pressure—both of which are early signs of a possible trend change. If Ethereum can sustain its hold above this support and reclaim key resistance levels with strength, it could ignite renewed confidence across the altcoin market.
Should this prove to be a meaningful low, it may very well set the stage for alt season to finally take shape—bringing with it a rotation of capital into high-beta assets and broader participation across the crypto space.
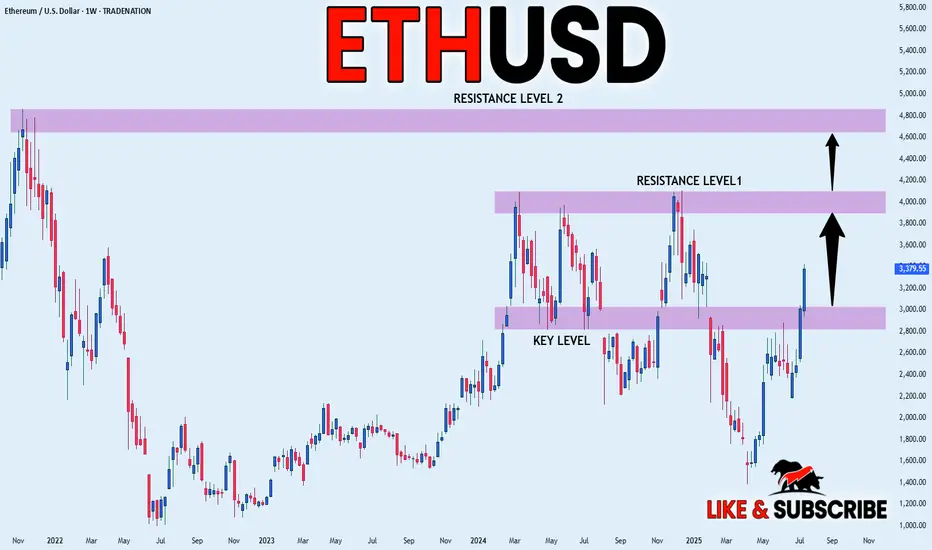
ETHEREUM WILL KEEP GROWING|LONG|
✅ETHEREUM is trading in a
Strong uptrend and the coin
Broke the important horizontal level
Of 3000$ which is now a support
And we are very bullish biased
And we think that ETH will
Reach at least the previous ATH
Of just short of 5000$ but the
First target is to reach and break
A resistance level of 4100$
LONG🚀
✅Like and subscribe to never miss a new idea!✅
Disclosure: I am part of Trade Nation's Influencer program and receive a monthly fee for using their TradingView charts in my analysis.
ETH — Trade Closed! Massive Profit SecuredI’m officially closing my Ethereum position — this trade is now a success story!
I posted right here that ETH was a buy at $2400, then doubled down at $1800. I even echoed the call on Reddit for good measure.
Today, I’m liquidating the entire position with a huge gain. No regrets, just clean execution. 🧠💸
To all the mad lads still holding — good luck and may your conviction be rewarded.
See you next year for the next big swing.
Take your profits, you lunatics! 😄🔥

ETHUSD - Bullish Flag PatternETHUSD is making Bullish Flag Pattern, will it move towards target after breakout?
Entry, Stop Loss & Take Profit are mentioned.
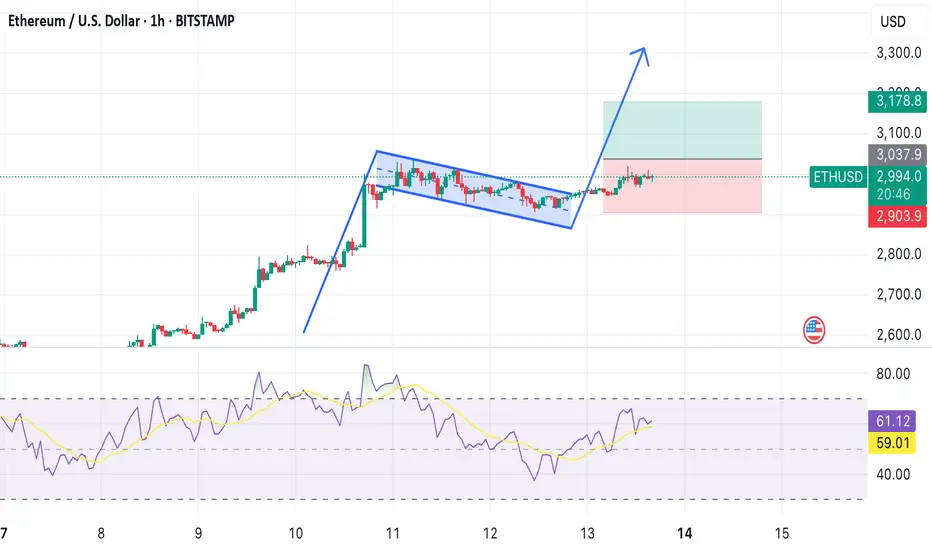
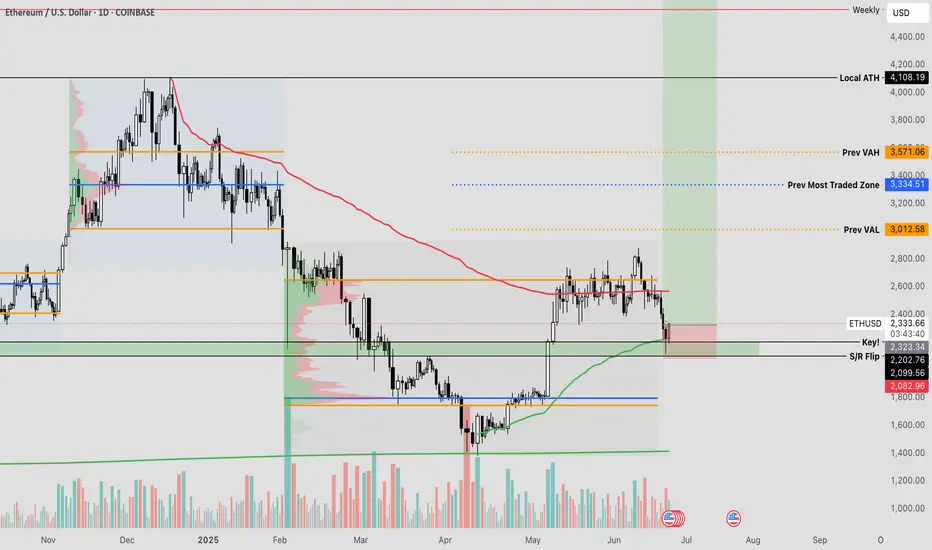
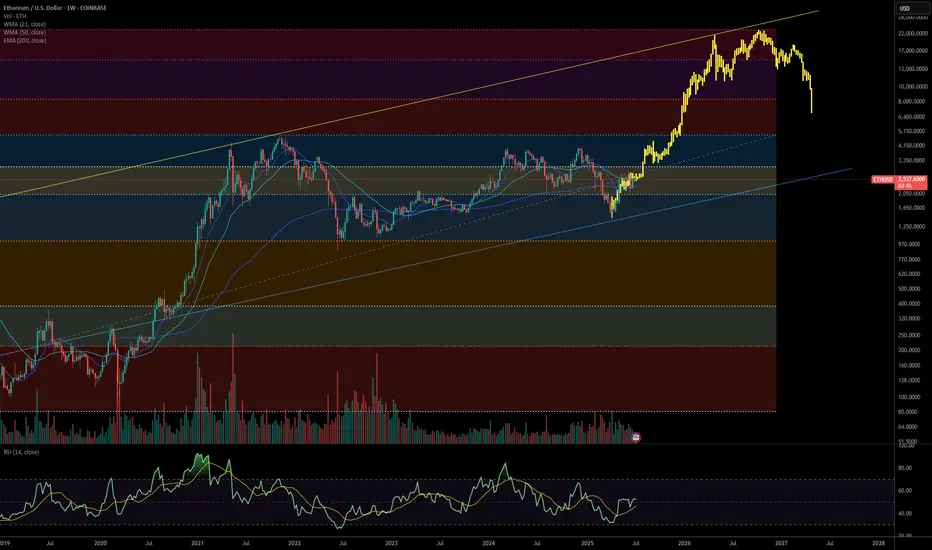
Ethereum at the Crossroads: Can Bulls Maintain the WMA 50 Grip?- Technical Pulse:
- Current price flirting with the WMA 50 ($2,521.54), suggesting a possible make-or-break moment.
- Highlight convergence zones: WMA 21 ($2,296.75) and EMA 200 ($2,277.07) forming a soft cushion below.
- Volume Snapshot:
69.19K weekly—enough activity to suggest accumulation
- Sentiment Analysis:
Gauge prevailing investor sentiment amid consolidation and macro uncertainty.
- Scenario Forecasts:
- Bullish Path: Sustained hold above WMA 50 opens room toward $2,800+.
- Bearish Reversal: Rejection from current level could retest EMA 200 support zone.
Major Breakout– Ethereum Broke Free from 'Clashing Resistances'🚀💥 Major Breakout – Ethereum Broke Free from the Clashing Resistances 🔓🟣
ETH has finally done it.
After months of battling overlapping resistances — the Clashing Stones, as we called them — Ethereum has broken out, and $2,912 is now acting as support, not resistance.
This breakout isn't just technical, it’s structural.
The previous 1-2-3 rejection setup has now been invalidated.
🔎 Chart Summary:
✅ $2,912 = confirmed breakout zone
🎯 Destination 1: $4,881 (if Vitalik’s asleep 😴)
🚀 Destination 2: $6,443 (if he wakes up 💡)
🔭 Scroll up for Destination 3
This is the real ETH breakout we’ve waited for — not hopium, not chop. This is clear structure.
If BTC stabilizes near 114,921+, ETH could enter outperformance mode and gain serious traction on the ETH/BTC chart.
📢 Keep your eyes on narrative catalysts:
ETH ETF, L2 growth, and Vitalik waking up...
We are officially off the resistance — and heading to where few have charted before.
One Love,
The FXPROFESSOR 💙
📌 Long — as long as $2,912 holds. If it fails, you already know what to do.
Disclosure: I am happy to be part of the Trade Nation's Influencer program and receive a monthly fee for using their TradingView charts in my analysis. Awesome broker, where the trader really comes first! 🌟🤝📈

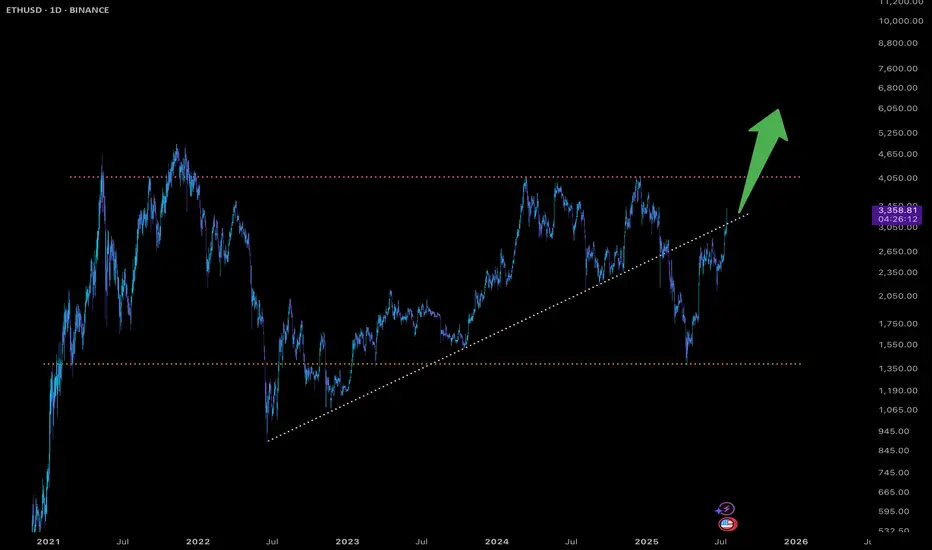
ETH Breakout Incoming:10K+ with Altcoin Rally, BTC to 140KEthereum (ETH) has returned to the trend, signaling strong bullish momentum. A confirmed breakout could propel ETH to 10K+, igniting the long-awaited altcoin run.
Bitcoin (BTC) is targeting 140-145K in this cycle.
I’ll provide the next update once I reassess the market after BTC hits this price target
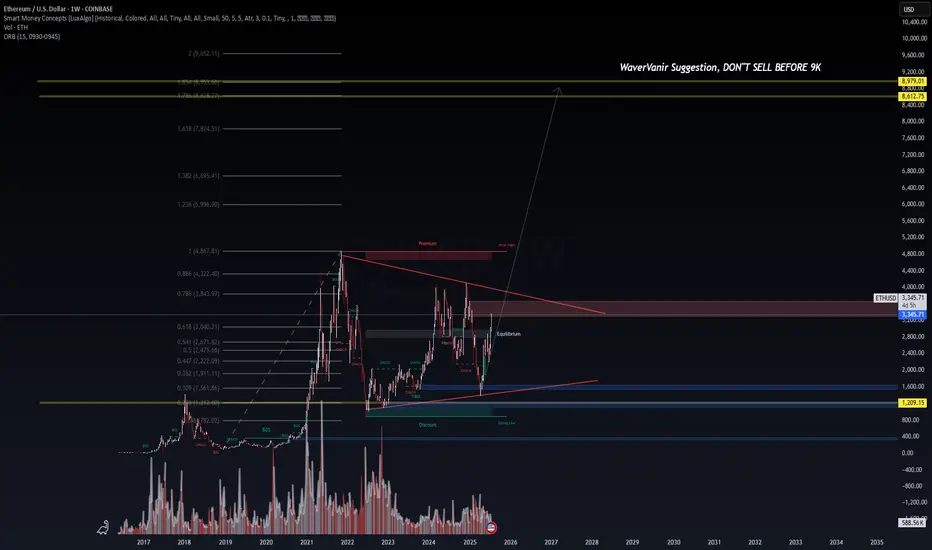
ETHUSD | WaverVanir Macro Map🧠 ETHEREUM: DON'T SELL BEFORE $9K
Weekly compression breakout confirmed.
Accumulation → Equilibrium → Expansion.
🚀 Targets based on long-term Fibonacci extension:
• 1.618 = $7,824
• 1.786 = $8,612
• 2.0 = $8,979 (WaverVanir threshold)
• 2.618 = $10,652
🔴 Premium zone around $4.8K will be the next key battle.
Volume base forming, volatility coiling.
If ETH clears this range, we expect full trend development through 2025.
WaverVanir DSS Protocol | ETHUSD Weekly | July 2025
#Ethereum #ETHUSD #MacroTrading #SmartMoneyConcepts #WaverVanir #VolanX #CryptoOutlook #LongTermThesis #TrendForecast
ETH - UpdateETH has been "crashing" lately but I think it is in the end state of a long rally. In fact I think we are in the last stage of Wyckoff distribution and we could see a major rally soon. Looking at the 300 SMA we bottomed there in June 22 and if we hold there, it could be the spring board for a massive rally to new highs.
Also I think GLD will top in a week or so which will be good for BTC and ALTS.
Not investment advice. Please like and share and leave a comment.
