ETH/USD: The Great Ethereum Bounce is HERE!🚀 THE MOON MISSION (Resistance Zone)
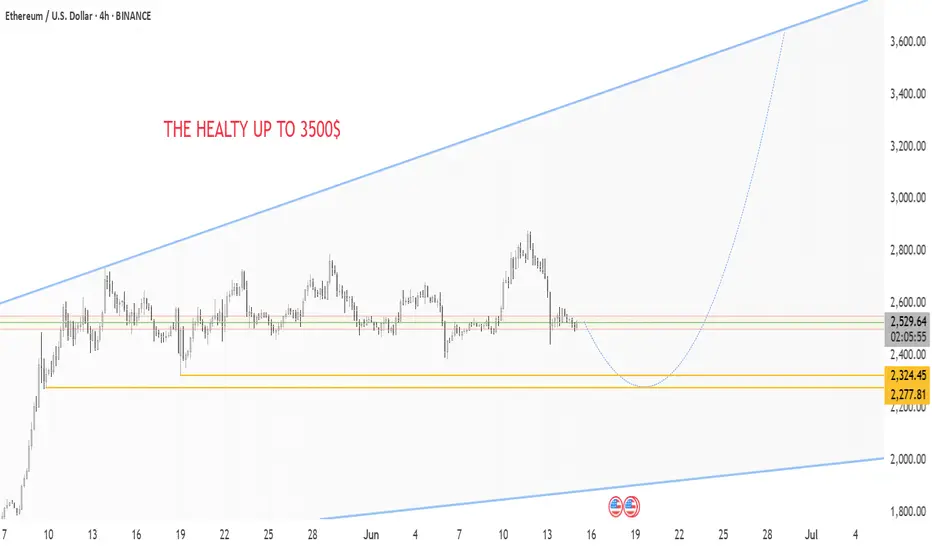
HEALTY TARGET: $3,500 - Your text says it all!
Upper Trendline: Acting as launch pad
Psychological Resistance: $3,000 round number
🟢 CURRENT LAUNCH PAD
Price: $2,529.15 - Breaking above key resistance
Previous Resistance: $2,324.45 - Now turned support
Support Zone: $2,277.81 - Strong foundation
🔴 DANGER ZONE (Abort Mission)
Critical Support: Lower trendline around $2,000
Major Support: $2,277.81 level must hold
💡BUY ZONE: $2,100 - $2,180 🎯
⚠️STOP LOSS: $1999 (Previous resistance) ⚠️
TAKE PROFIT 1: $2,650 (Take 50% profits) 🔥
TAKE PROFIT 2: $3,300 (Let winners run!) 🔥
ETHUSD trade ideas
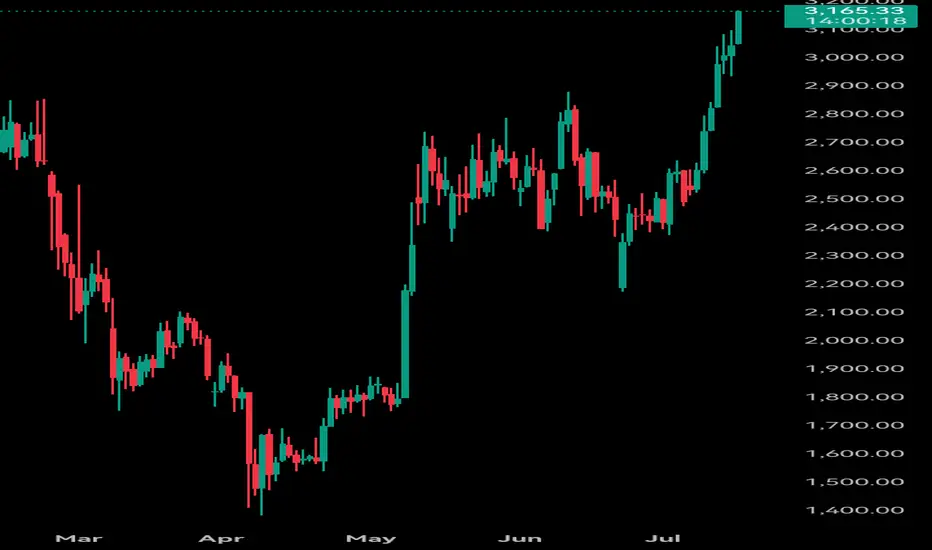
Ethereum $ETH – Perfect Accumulation to Rally Move!
🔸 Ethereum CRYPTOCAP:ETH – Perfect Accumulation to Rally Move!
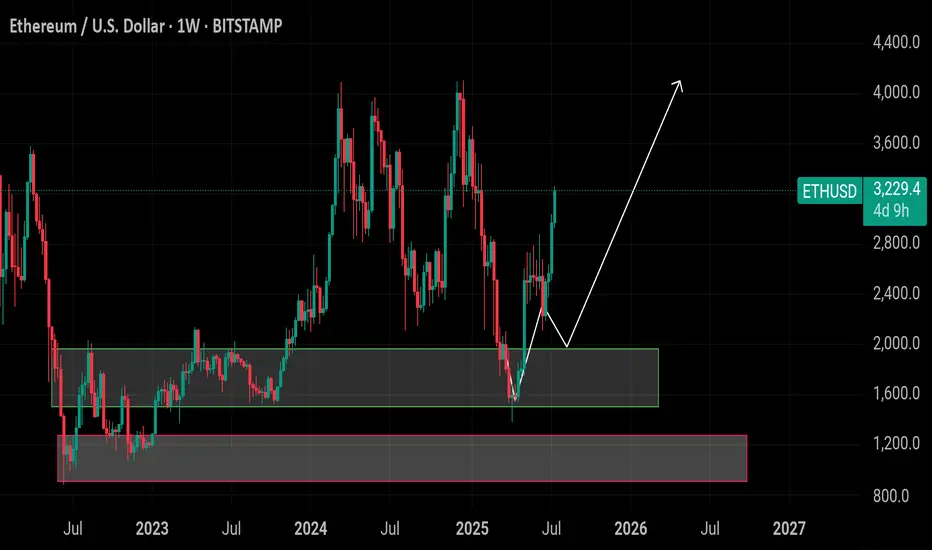
ETH perfectly hit our long-term buying zone between $1,900 – $1,500, where we accumulated heavily. This range once again acted as a strong demand zone and launchpad.
🔸 Target: $4,000 – $4,500
After hitting our buying range, ETH has now rallied to $3,250 — showing strong bullish momentum. If price continues to hold above $3,000, the next target zone is $4,000 – $4,500.
🔸 Risk Level:
Any breakdown below $2,200 would weaken the structure and shift the bullish outlook. This is our invalidation level on a higher time frame.
🔸 Outlook:
Partial profit-taking around $3,200 – $3,500 zone
Hold remaining positions for $4,000+ targets
Use $2,900 – $3,100 zone for fresh or re-entries on dips
Maintain tight stop loss under $2,200 if adding new exposure
Eth looks ready to meThe range is going to break soon, price looks primed to test 3200 area. Lots of wicks cleared overhead resistance. My plan is to take 25% off at 3200 and let the rest run. I like Eth to hit ATH by around Thanksgiving. On the TD indicator (momentum), eth is hitting green 2s on a lot of bigger timeframes, this is not something that happens too often. Last time i came across such a confluence it was Zoom pre-covid.
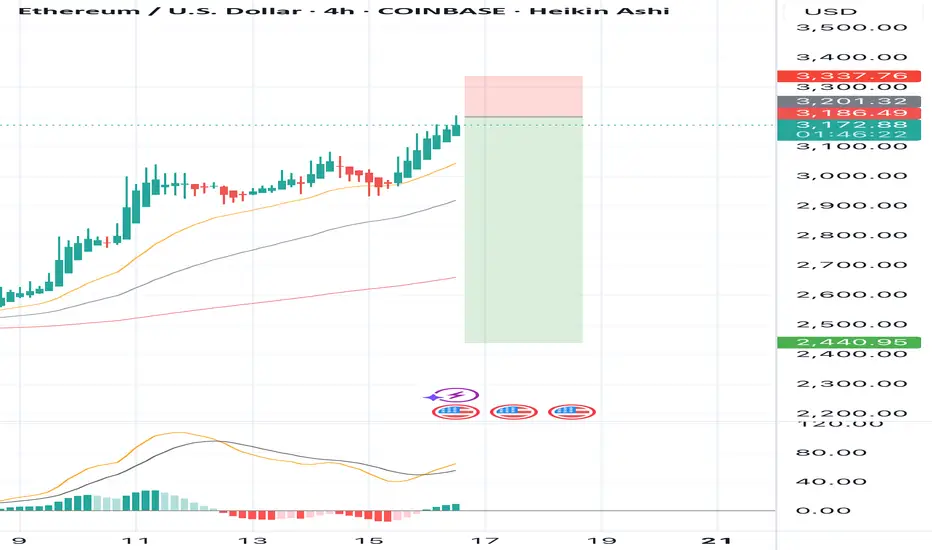
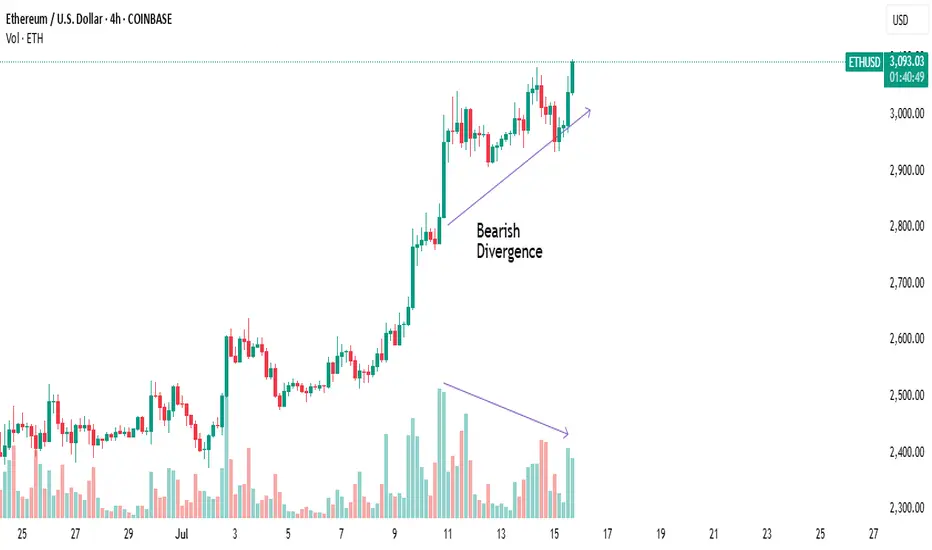
SELL ETHUSD for bullish divergence trend reversal STOP LOSS: 3,3SELL ETHUSD for bullish divergence trend reversal STOP LOSS: 3,337
Regular Bearish Divergence
In case of Regular Bearish Divergence:
* The Indicator shows Lower Highs
* Actual Market Price shows Higher Highs
We can see a strong divergence on the MACD already and There is a strong trend reversal on the daily time frame chart.....
The daily time frame is showing strength of trend reversal from this level resistance so we are looking for the trend reversal and correction push from here .....
TAKE PROFIT: take profit will be when the trend comes to an end, feel from to send me a direct DM if you have any question about take profit or anything
Remember to risk only what you are comfortable with........trading with the trend, patient and good risk management is the key to success here...
Ethereum LFGFractal from beginning of last cycles bull market. Estimated target $20K by November/December 2025. Significant pull-back around physiological level of $10K in autumn.

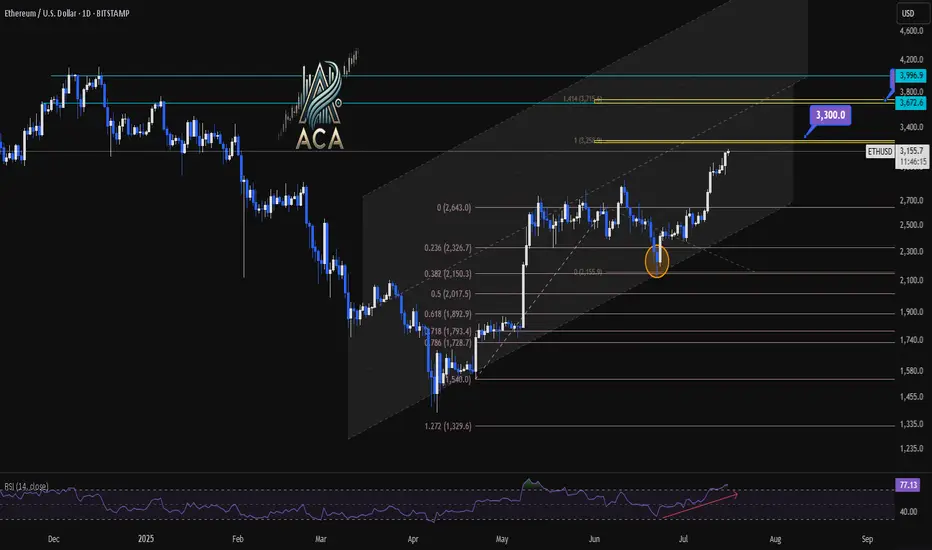
ETHUSDT 1D Chart Analysis | RSI Strength & Fibonacci TargetsETHUSDT 4H Chart Analysis | RSI Strength & Fibonacci Targets in Play
🔍 Let’s break down the latest ETH/USDT setup — bullish momentum is building with confluences pointing toward key upside targets.
⏳ 4-Hour Overview
Ether continues climbing within a well-defined ascending channel, with recent candles holding above mid-level support. Price is pressing higher from a clean bounce at the 0.5 and 0.618 Fibonacci retracement zone ($2,017–$1,899), signaling the correction has likely ended.
📉 Fibonacci Levels & RSI Confirmation
- The strong recovery aligns with rising volume and a bullish structure.
- RSI is pushing into overbought territory (above 73), often a sign of strength during trends—not exhaustion.
- ETH is now positioned for a breakout continuation move if momentum holds.
🎯 Bullish Targets Ahead
- Immediate resistance: $3,300 (1.414 Fib extension + historical supply)
- Next major target: $3,700 (1.618 extension + upper channel confluence)
- Pullback zones: $2,950 (mid-channel) and $2,017 (Fib support base)
📊 Key Highlights:
- Price is respecting the rising channel structure — higher lows, higher highs in play.
- Volume supports the breakout narrative, rising on green candles.
- RSI breakout supports trend continuation, not exhaustion.
- Targets at $3,300 and $3,700 remain actionable on a confirmed breakout.
🚨 Conclusion:
ETH is showing a multi-variable bullish setup with clear continuation potential. A strong move above $3,300 could quickly send price toward $3,700. Pullbacks to $2,950–$2,017 could offer high-risk/reward re-entry zones. Momentum favors bulls — stay alert.
Wrong call!I have absolutely ate shit calling for lower drop couple days ago
Keep in mind, per Elliott Wave this still could be lower high - not that I am rooting for it, just giving possibility here.
Invalidation is the red line

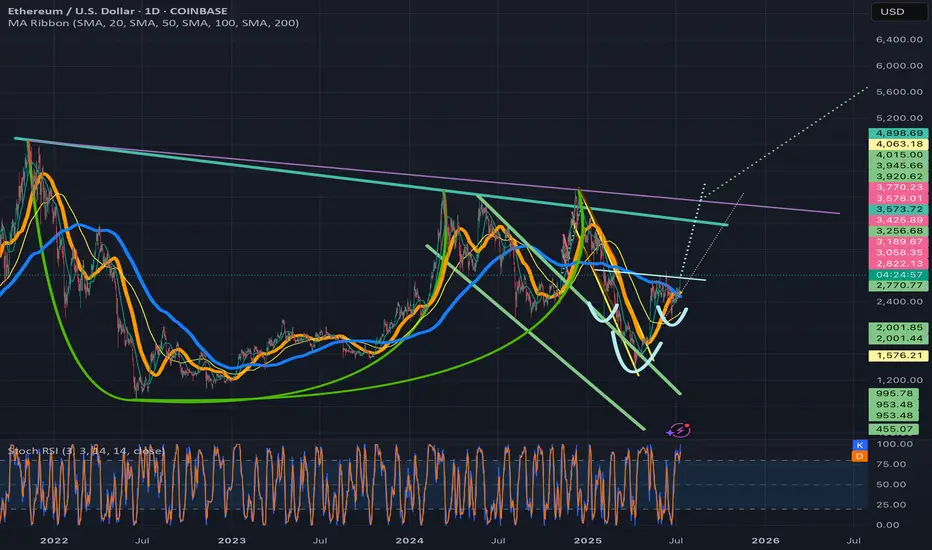
Ethusd breaking above invh&sEthusd chart has a similar set upas the total2 chart, a cup and handle that is breaking up from a smaller inverse head and shoulders that will complete the handle to the cup. Ethereum actually has two potential to trendlines for its cup and handle and I wouldn’t be surprised if both are valid. The breakout target for the inverse head and shoulder pattern will take price action above both of them. Once we solidify the top trendline for the cup and handle patterns as support the breakout target for it is $7161. Ethereum just recently had a golden cross on the daily which adds to the probability the inverse head and shoulder pattern breakout will be validated. *not financial advice*
Short Sell ETHUSD For Swing TradingShort Sell ETHUSD , It looking over bought on daily chart RSI is above 75.
Short Sell at 3160 Stop Loss at 3185 Target at 3120.
### **Bearish Analysis of Ethereum (ETH)**### **Bearish Analysis of Ethereum (ETH)**
Here is a bearish outlook on Ethereum (ETH) based on current market dynamics, incorporating technical, liquidity, and fundamental factors:
---
### **1. Technical Resistance & Topping Signals**
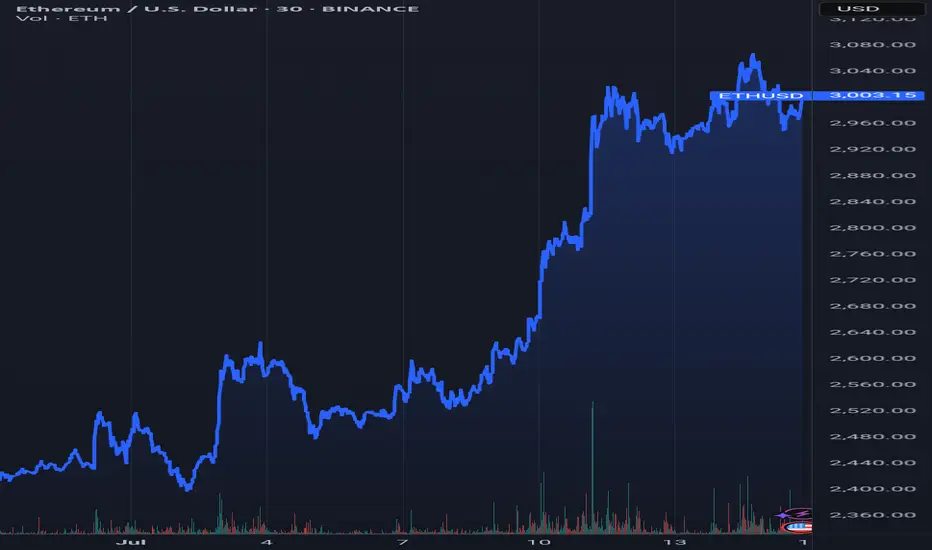
- **Key Resistance Zone**: ETH has repeatedly tested the **$3,000–$3,080** resistance level but failed to sustain a breakout. If it cannot hold above this range, a pullback toward **$2,865** or even **$2,710** is likely.
- **Daily Chart Topping Pattern**: Some analysts suggest the current rally may form a "daily top." While an immediate reversal is unlikely, the trend could shift to bearish dominance, with potential resistance near **$3,160**.
- **Overbought Risk**: The RSI has exceeded 70, indicating short-term overbought conditions. A loss of momentum could trigger a correction.
---
### **2. Heavy Shorting by Hedge Funds & Basis Arbitrage**
- **Surge in Short Positions**: CFTC data shows hedge funds have amassed **$1.73 billion** in ETH short positions on CME, marking a record high in net leveraged short exposure.
- **Basis Arbitrage Strategy**: Institutions are executing delta-neutral strategies by shorting futures while buying spot ETFs (annualized arbitrage ~9.5%). However, heightened volatility (e.g., a "Black Thursday"-like event) could trigger a short squeeze.
- **Whale Shorting Activity**: High-leverage (4.1x) short positions by whales (e.g., 0xSifu) reflect market skepticism about ETH's long-term competitiveness.
---
### **3. Fundamental Weaknesses**
- **Ecosystem Underperformance**: In 2025, ETH was among the worst-performing top-five crypto assets (down 51% YTD), lagging behind competitors like Solana. DeFi TVL has dropped **43%**, signaling declining user engagement.
- **Staking Risks**: While **29% of ETH is staked**, reducing liquid supply, high staking ratios may constrain market liquidity. A price drop could trigger panic unstaking.
- **Institutional Selling Pressure**: The Ethereum Foundation recently sold **1,206.7 ETH (~$3.6 million)**, fueling concerns about insider divestment.
---
### **4. Market Sentiment & Capital Flows**
- **BTC Dominance Pressure**: Bitcoin’s recent all-time high (**$118,000**) may divert capital away from ETH and other altcoins.
- **Extreme Short Positioning**: ETH’s open interest shows **62% short bias**, the highest since 2021. While this raises short-squeeze risks, it also reflects doubts about the sustainability of the rally.
---
### **5. Key Risks & Outlook**
- **Downside Triggers**:
- A break below **$2,865** could accelerate a drop toward **$2,530**.
- A Fed policy shift or global liquidity tightening.
- Competitors (e.g., Solana) gaining further market share.
- **Potential Reversal Signals**:
- A sustained breakout above **$3,080** may force short covering.
- If the **ETH/BTC ratio** surpasses **0.026 BTC**, an altcoin season could emerge.
---
### **Conclusion**
In the short term, ETH faces headwinds from technical resistance, institutional shorting, and capital rotation into Bitcoin. The bearish thesis holds for now, but extreme short positioning raises the risk of a squeeze. Traders should monitor:
- The **$3,080** resistance and **$2,865** support levels.
- Bitcoin’s market dominance and macroeconomic policy shifts.
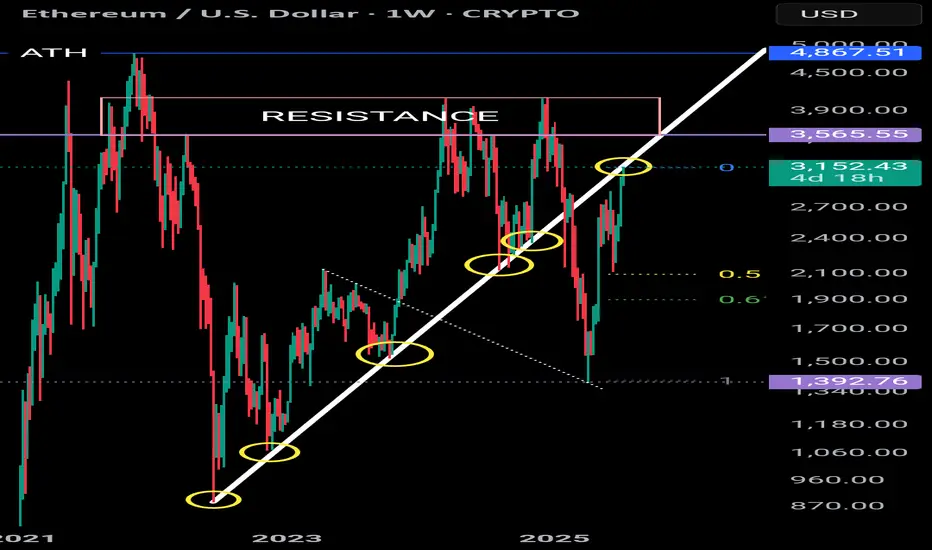
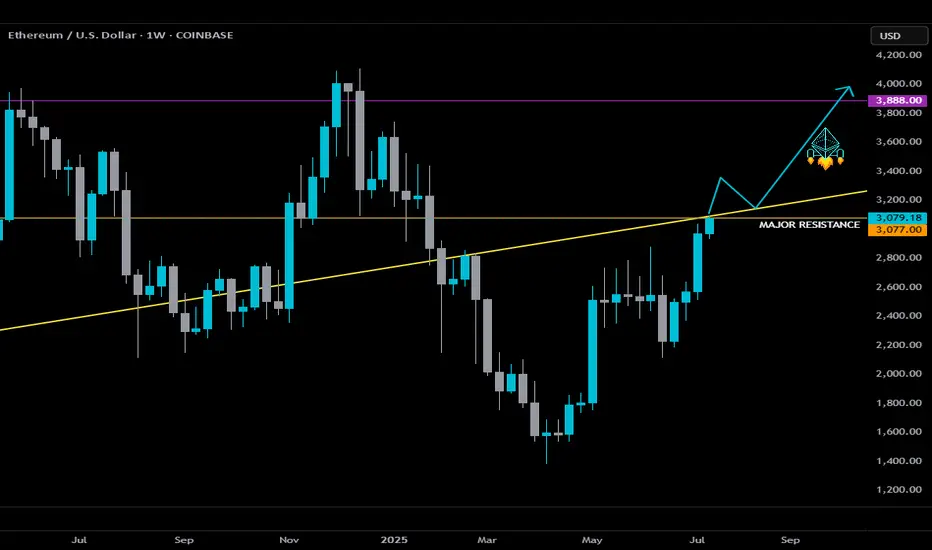
ETH - what next??Ethereum is perfectly touching a macro uptrend (5 touches acting as Support). Price has recently rallied but is currently pausing for breath. Could the uptrend begin to act as resistance? A break above this line would invalidate this thesis. Equally there is a huge resistance zone @ 3,550 - 4,100
And then there is the ATH
So there are a few hurdles in the way of printing a new ATH.
If Ethereum fails to break above the uptrend the fib retracement tool could take price to 1,900 (.618).
The next few days/weeks will give us an indication as to which direction we are headed.
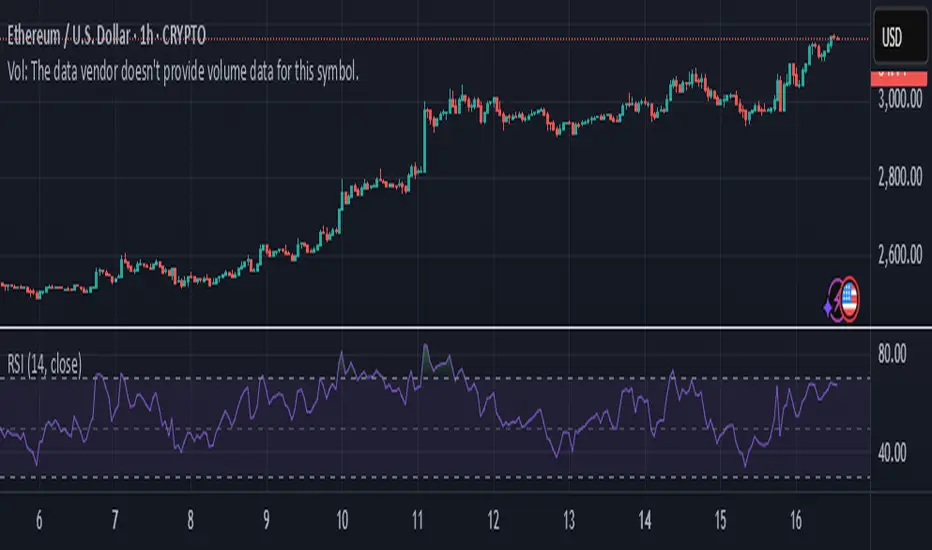
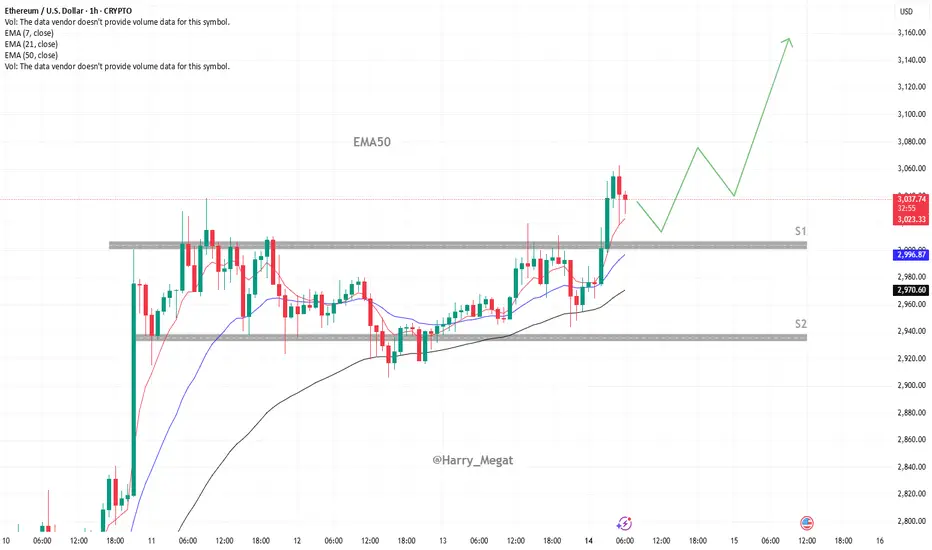
Bullish Outlook for Ethereum (ETH/USD)The chart shows a **bullish outlook for Ethereum (ETH/USD)** on the 1-hour timeframe, suggesting a potential continuation of the uptrend after a recent breakout.
Chart Breakdown:
* **Current Price:** \~\$3,038
* **Key Levels:**
* **S1 (Support 1):** Around \$2,996 — a key breakout and retest level.
* **S2 (Support 2):** Around \$2,945 — secondary support and accumulation zone.
* **EMAs:**
* EMA 7: \$3,023
* EMA 21: \$2,996
* EMA 50: \$2,970
The price is currently above all three EMAs, signaling **short-term bullish momentum**.
Bullish Scenario:
* The price recently **broke out above a strong resistance zone (\~\$2,996)**.
* If ETH successfully **retests and holds S1 as support**, we could see a continuation move toward:
* **\$3,080 → \$3,120 → \$3,160** as short-term targets.
* The green path suggests a **healthy pullback and continuation pattern**, which aligns with bullish market structure.
Invalidation/Bearish Scenario:
* A **break below S1 (\$2,996)** may shift bias toward S2 (\~\$2,945).
* Loss of S2 support could open the door for deeper correction..”
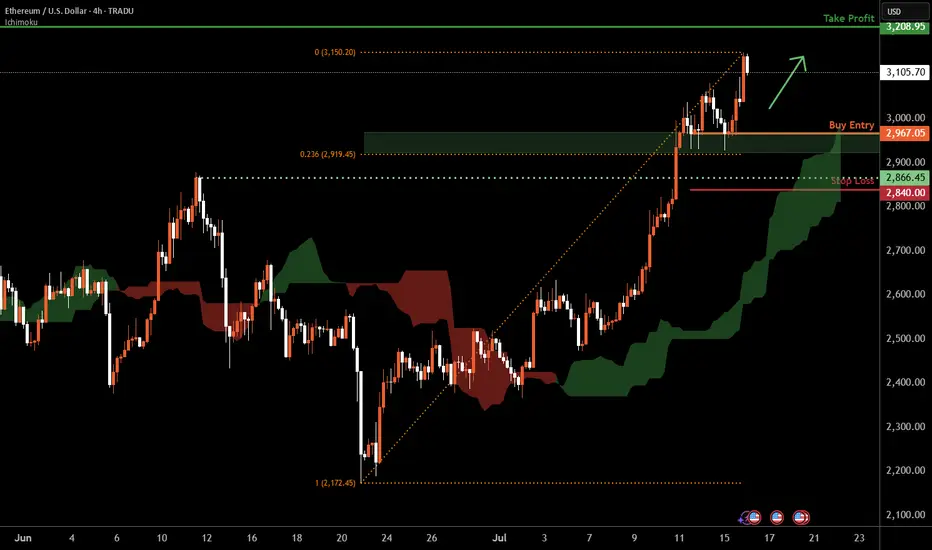
Ethereum H4 | Falling toward a multi-swing-low supportEthereum (ETH/USD) is falling towards a multi-swing-low support and could potentially bounce off this level to climb higher.
Buy entry is at 2,967.05 which is a multi-swing-low support that aligns closely with the 23.6% Fibonacci retracement.
Stop loss is at 2,840.00 which is a level that lies underneath a pullback support.
Take profit is at 3,208.95 which is an overlap resistance.
High Risk Investment Warning
Trading Forex/CFDs on margin carries a high level of risk and may not be suitable for all investors. Leverage can work against you.
Stratos Markets Limited (tradu.com ):
CFDs are complex instruments and come with a high risk of losing money rapidly due to leverage. 63% of retail investor accounts lose money when trading CFDs with this provider. You should consider whether you understand how CFDs work and whether you can afford to take the high risk of losing your money.
Stratos Europe Ltd (tradu.com ):
CFDs are complex instruments and come with a high risk of losing money rapidly due to leverage. 63% of retail investor accounts lose money when trading CFDs with this provider. You should consider whether you understand how CFDs work and whether you can afford to take the high risk of losing your money.
Stratos Global LLC (tradu.com ):
Losses can exceed deposits.
Please be advised that the information presented on TradingView is provided to Tradu (‘Company’, ‘we’) by a third-party provider (‘TFA Global Pte Ltd’). Please be reminded that you are solely responsible for the trading decisions on your account. There is a very high degree of risk involved in trading. Any information and/or content is intended entirely for research, educational and informational purposes only and does not constitute investment or consultation advice or investment strategy. The information is not tailored to the investment needs of any specific person and therefore does not involve a consideration of any of the investment objectives, financial situation or needs of any viewer that may receive it. Kindly also note that past performance is not a reliable indicator of future results. Actual results may differ materially from those anticipated in forward-looking or past performance statements. We assume no liability as to the accuracy or completeness of any of the information and/or content provided herein and the Company cannot be held responsible for any omission, mistake nor for any loss or damage including without limitation to any loss of profit which may arise from reliance on any information supplied by TFA Global Pte Ltd.
The speaker(s) is neither an employee, agent nor representative of Tradu and is therefore acting independently. The opinions given are their own, constitute general market commentary, and do not constitute the opinion or advice of Tradu or any form of personal or investment advice. Tradu neither endorses nor guarantees offerings of third-party speakers, nor is Tradu responsible for the content, veracity or opinions of third-party speakers, presenters or participants.
ETH CUP & HANDLE BOWith the cup‑and‑handle pattern that started in February 2025 now pierced above $2,800, the measured move targets the next ceiling around $4,000.

ETHUSD - Bullish RectangleETHUSD is making Bullish Rectangle Pattern, will it break & move towards target price?
Entry, Stop Loss & Take Profit are mentioned.
ETH might just be setting up for a monster move!Something BIG is brewing with #Ethereum...
👀 And it’s being quietly triggered by a law almost no one was talking about, till today.
A new rally could be closer than you think. Here's the full story 🧵👇
Last month, the U.S. Senate passed the Genius Act — the first serious law aimed at regulating stablecoins.
Sounds boring? It's not.
Because this act could light a fire under ETH... and hardly anyone sees it coming.
Stablecoins like CRYPTOCAP:USDC will soon have clear rules to follow.
That opens the doors for banks, funds, and institutions to use them legally — and massively.
And who benefits most from that? You guessed it: Ethereum.
Ethereum hosts nearly 50% of ALL stablecoin supply.
It's the core infrastructure of the stablecoin economy.
That means:
More stablecoin adoption → More activity on ETH → More gas fees → More ETH burned.
And it doesn’t stop there.
Right now, Ethereum handles about 60% of all stablecoin transactions.
Tron is in second place… with just 15%.
This is ETH's game to lose.
Here’s where it gets juicy:
ETH gas fees = ETH getting burned.
Rising stablecoin usage doesn’t just mean more revenue for the network…
It means less ETH in circulation.
And you know what that does to price.
Oh — and the smart money knows.
Since mid-2024, ETH whales have been quietly accumulating.
Whale holdings just hit their highest level since 2021.
Last time that happened?
Right before a massive rally.
Also… Ethereum activity is already spiking on-chain.
Transaction volume is rising, fast.
The last two times we saw this setup?
🔹 2016–2017
🔹 2020–2021
ETH went on to crush ATHs both times.
Circle — the company behind USDC — just IPO’d in June.
Their stock? Skyrocketed!
The stablecoin dominoes are falling fast...
And Ethereum is sitting at the center of it all.
To sum it up:
✅ Regulatory clarity (Genius Act)
✅ Institutional greenlight for stablecoins
✅ ETH is the foundation
✅ Whales accumulating
✅ On-chain activity heating up
✅ Supply burn kicking in
The House just rejected a key vote on the GENIUS Act.
🚨 Regulatory momentum just hit a speed bump — but the charts will tell you the real story.
Pass or fail... ETH might just be setting up for a monster move.
Here’s the set up…
If ETH can secure a Weekly close above the orange major resistance and confirm a breakout above the yellow ascending trendline, we could experience LIFTOFF. 🚀
NFA... For edutainment purposes only!
Ethereum is not going up?The impact of the crypto bull run is not trickling down to altcoins, and despite major buying, why Ethereum (ETH) price is not going up?
Read more here: www.cointrust.com
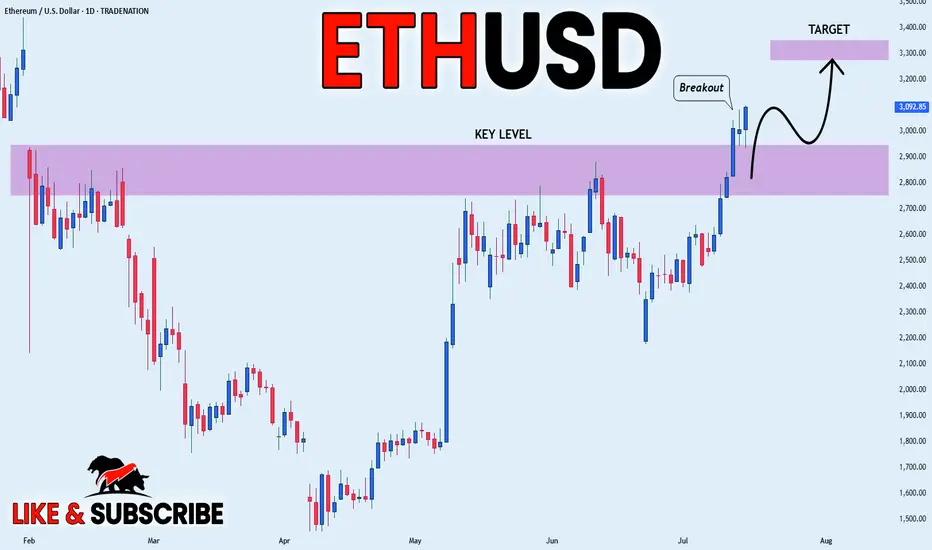
ETHEREUM WILL KEEP GROWING|LONG|
✅ETHEREUM is going up
Now and the coin made a bullish
Breakout of the key horizontal
Level of 3000$ and the breakout
Is confirmed so we are bullish
Biased and we will be expecting
A further bullish move up
LONG🚀
✅Like and subscribe to never miss a new idea!✅
Disclosure: I am part of Trade Nation's Influencer program and receive a monthly fee for using their TradingView charts in my analysis.
Eth killer Today was a solid trading day with some interesting moves across the markets:
S&P 500: The market trended upwards from the open, gradually moving into and above the prior day’s value area, closing near the high of that range.
NASDAQ 100: After some initial back-and-forth, it climbed above the prior day’s high and value area, showing strength into the close.
Russell 2000: This market was quite choppy and balanced for a good part of the session, but eventually pushed up to close near the prior value area high.
Gold: It stayed range-bound, moving between the CVA high and the prior day’s value area without breaking out.
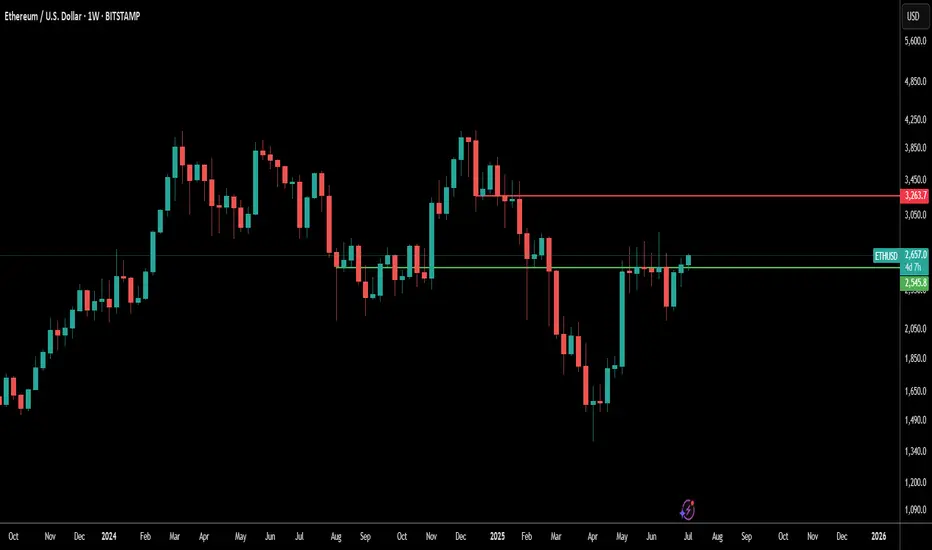
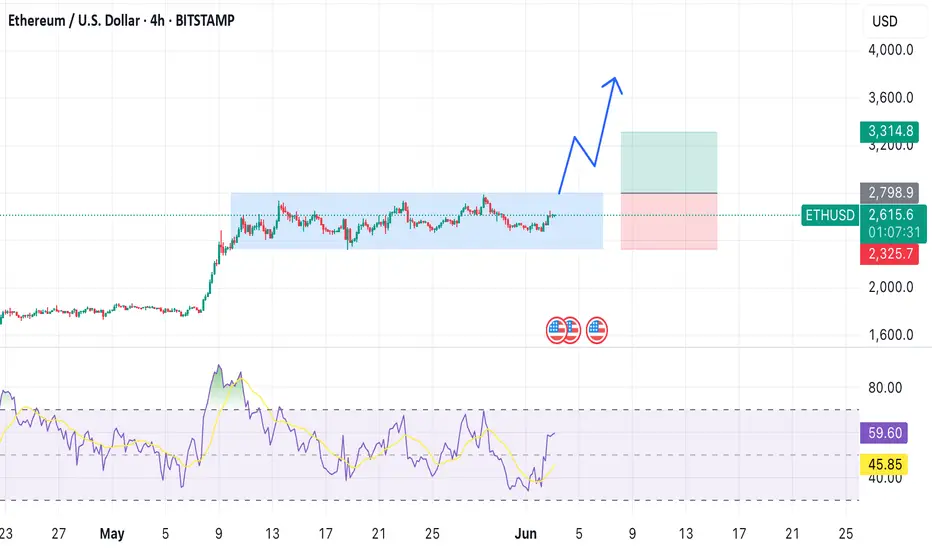
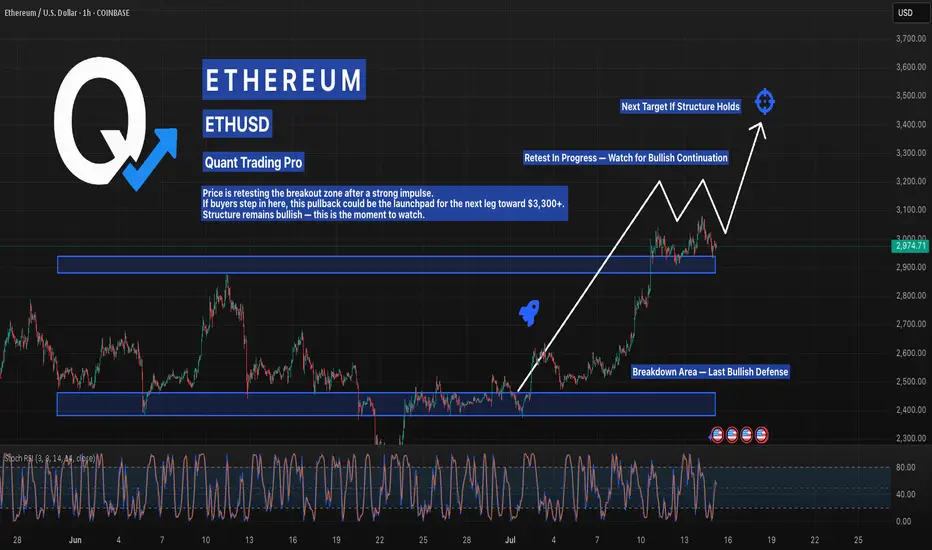
Ethereum Is Coiled and Ready — Pullback or Launchpad?ETH is pulling back into a key breakout zone after a strong leg up — and the next move could be explosive. Price action remains clean, with bullish structure intact and a textbook retest underway. If support holds, a surge toward $3,300–$3,500 is on the table.
Momentum has reset, giving bulls the fuel they need. This is where traders prepare — not chase.
#ETHUSD #EthereumBreakout #CryptoTrading #BacktestYourEdge #QuantTradingPro #TradingView #TechnicalAnalysis
Ethereum - It's about damn time!Ethereum has been slacking for a couple of years.
The strong catalyst to excel Ethereum just seems to be lingering compared to the first 5 years.
So, it looks like it's just following suit with Bitcoin current rally, as it hits all time highs and shines confidence to the rest.
So the update with Ethereum remains to be the same.
Price>20 and 200
Cup and Handle
Breakout above brim
Target $3,794
Disclosure: I am part of Trade Nation's Influencer program and receive a monthly fee for using their TradingView charts in my analysis.

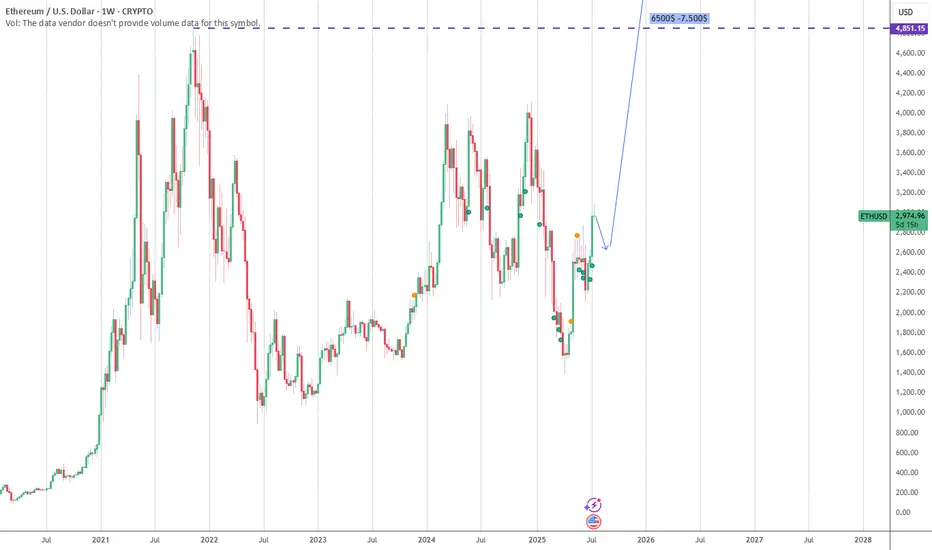
ETHUSDHonestly, I’ve seen a lot of people say Ethereum isn’t what it used to be — not as active, not as hyped, maybe even “dying” compared to a couple of years ago. 🚶♂️📉
But here’s the thing: I didn’t get into ETH for the quick hype. I got in around $1,300, and I’m not planning on touching it until we’re somewhere around $6,500 or more. 🚀💎🙌
Ethereum is still the backbone of most real innovation in Web3 — smart contracts, DeFi, layer 2s, NFTs (yes, still alive), and massive institutional interest brewing beneath the surface. 🧠🔥
People forget: the best gains come when no one’s paying attention. The crowd’s asleep now… perfect. 😴🕵️♂️
I'm not here for short-term noise — I'm here for long-term value.
I’d rather hold strong while the market underestimates it, than chase FOMO later when it’s back on headlines. 💼🕰️📈
Let them doubt — I’m holding.
Let them forget — I’m positioning.
Let them sell — I’m accumulating. ⚖️🧘♂️
$6,500 isn’t a dream, it’s just the beginning.
ETH isn’t dead — it’s just recharging. ⚡️💻🧬
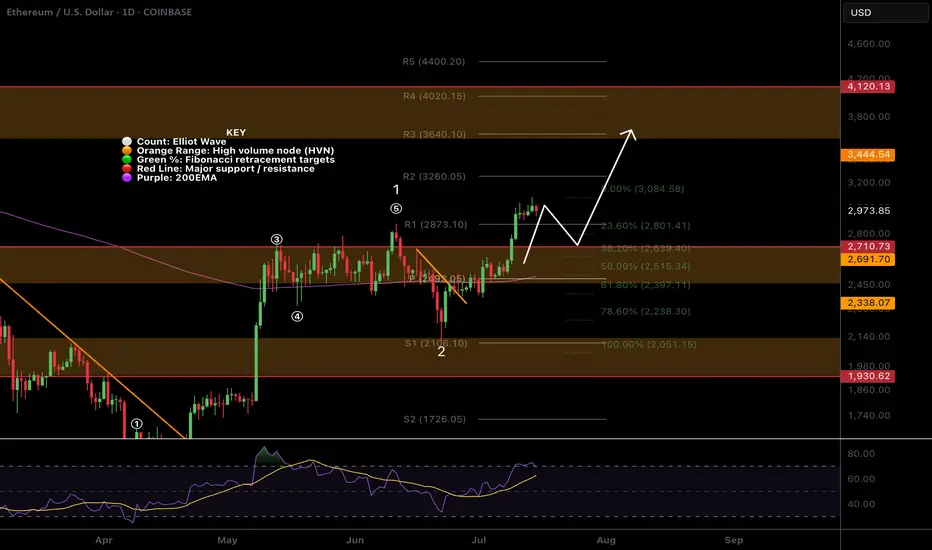
$ETH Pullback to $2630 Support?CRYPTOCAP:ETH has a great week pushing through resistance and making new local highs after testing the daily 200EMA and daily pivot as support.
Price is likely to retest the swing high and previous resistance as support around $2600-2700, also the .382 Fibonacci retracement.
RSI is printing daily bearish divergence in overbought from the wave (3) top to current as it did at the wave (5) top seeing large rejection. The retest of $2600 would reset RSI.
Price is ultimately set to test $3600 as the next resistance if the Elliot wave count is correct.
Analysis is invalidated below $2050
Safe trading