#ETHUSD Buy 2624.65#ETHUSD Buy 2624.65
SL 2564.65
TP 2644.65
TP 2724.65
TP 2864.65
Trade at your own risk
Protect your capital
The Wizard 🧙♂️ SWFX
ETHUSD trade ideas
Etherium is forming MeghahorneKey Elements in the Chart:
Wave Count (Possibly 1,2,3,4,5):
The chart shows a potential Elliott Wave formation inside a "Megaphone" (broadening wedge) pattern.
The current wave appears to be completing Wave 4, heading toward Wave 5.
Buy Zone and No Trading Zone:
A "Buy Above" level is marked just above $2,763, indicating a bullish breakout confirmation.
A "No Trading Zone" is identified between ~$2,378 and ~$2,763, suggesting uncertainty or consolidation.
Downside Targets (If bearish breakout occurs):
Target 1: Around ~$1,900.
Target 2: Much lower, near ~$1,000.
Indicators:
Bollinger Bands are applied, suggesting increased volatility within the megaphone pattern.

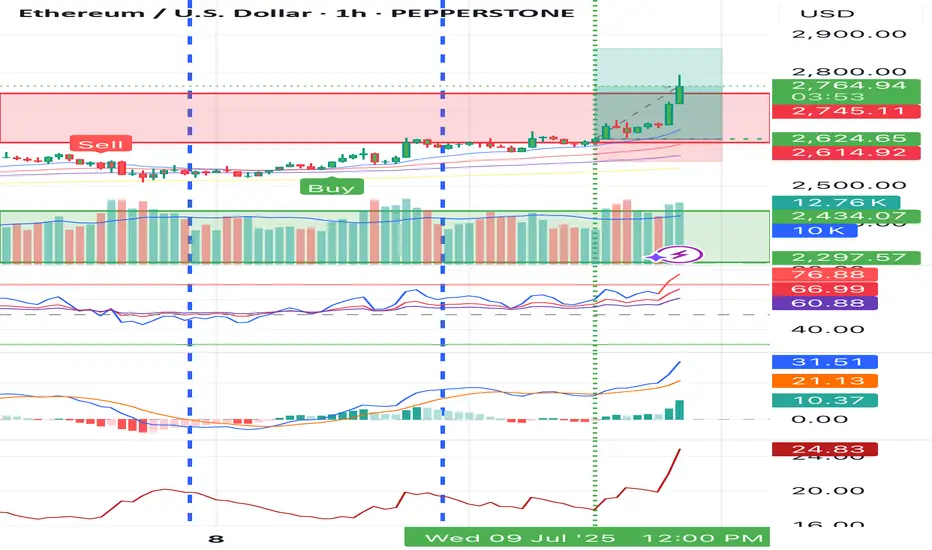
Ethereum (ETH) to U.S. Dollar (USD) 4-Hour Chart - Binance4-hour candlestick chart from Binance displays the price movement of Ethereum (ETH) against the U.S. Dollar (USD) from late June to early July 2025. The current price is $2,608.76, reflecting a +$65.53 (+2.58%) change. The chart includes buy and sell indicators at $2,608.76, with a highlighted resistance zone around $2,700-$2,760 and a support zone around $2,540-$2,600. The chart also shows a recent upward trend with fluctuating volatility.

Ethereum (ETH) Market UpdateOrder Flow Signals Bullish Momentum
The current order flow structure for Ethereum is decisively bullish. Buy-side liquidity is dominant, indicating strong demand from market participants. This suggests that institutional and smart money flows are favoring long positions, providing solid support for higher price continuation.
Daily Fair Value Gap (FVG) Holding as a Strong Support Zone
The daily timeframe shows a key Fair Value Gap (FVG) that has been respected multiple times. This zone has acted as a significant area of demand, absorbing selling pressure and fueling upward momentum. As long as price holds above this level, the bias remains strongly in favor of continued bullish price action.
Correlation with Bitcoin’s Strength
Bitcoin’s current bullish structure is reinforcing ETH’s outlook. As BTC continues to maintain upward momentum and structure, ETH is benefiting from the positive market sentiment and correlation. Historically, Ethereum often follows Bitcoin’s macro trend, and this synchronized bullish movement adds further conviction to ETH’s upside potential.

ETHUSD: Bullish Momentum, SUPPORT:2400/2100 TARGET=3400/3700The ETH/USD chart looks bullish, with room to move higher toward $3,400 and possibly $3,700. If the trend loses steam, support near $2,400 could come into play.
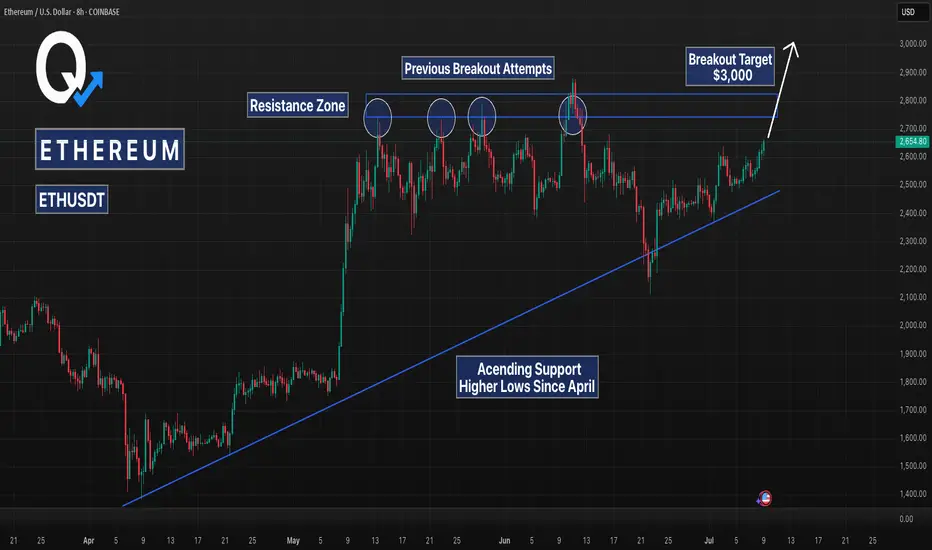
ETHUSD 8H – Moving Toward Breakout After Months of AccumulationEthereum has been trading within a large ascending structure since April, forming consistent higher lows while repeatedly testing overhead resistance between $2,730 and $2,850. This is a classic example of a compressed range setup where buyers gradually gain strength beneath a defined ceiling, leading into a potential breakout scenario.
The chart highlights the key structural components of this setup:
An ascending support trendline has been respected for over two months, showing persistent bullish pressure on each dip.
A multi-month resistance zone has capped every breakout attempt since early May, with multiple upper wick rejections confirming this level as major overhead supply.
Most recently, ETH bounced cleanly off the rising trendline again, forming yet another higher low, reinforcing the bullish structure.
If this pattern holds, Ethereum is approaching a technical inflection point. A breakout above $2,850 with strong volume and follow-through could trigger a rapid move toward the $3,000–$3,200 range. That move would align with the measured move from the height of the ascending triangle formation.
However, if price is rejected again from resistance, the ascending trendline remains a key support level to watch for another potential retest. A breakdown below $2,400 would invalidate the pattern and open the door to a deeper retracement.
Key Technical Zones:
Support: Rising trendline from April lows (~$2,400–$2,500)
Resistance: Horizontal zone between $2,730 and $2,850
Breakout Target (on confirmation): $3,000–$3,200
Strategy Notes:
Bias remains bullish while higher lows continue to hold
Breakout setups often benefit from confirmation (candle close above resistance with volume)
Rejections from resistance could offer opportunities to re-enter at trendline support
ETHUSD – From Dip to DecisionETH swept lows at $2,460 then began a steady stair-step recovery. After reclaiming $2,580, it climbed into $2,630 and is consolidating just under resistance. Bulls need to break $2,645 to maintain momentum — failure to do so might bring a retest of $2,600.
$ETH UPDATE 2 (series 11) bull incoming. altseasonWe are very close to pressing insane ranges on bitcoin and eth starting the super cycle of alts and memecoins. i first want to indicate all my longs i called have been made here on the trading view and with full transparecey. not confusing people with bull crap chart patterns.
realistic scaling and simple common sense on these longs. QLM zone is obvious here. RSI looked healthy and good. only overbought a couple times.
lets hope tomorrow we see a trump pump from the tariff announcements on apparent deals!

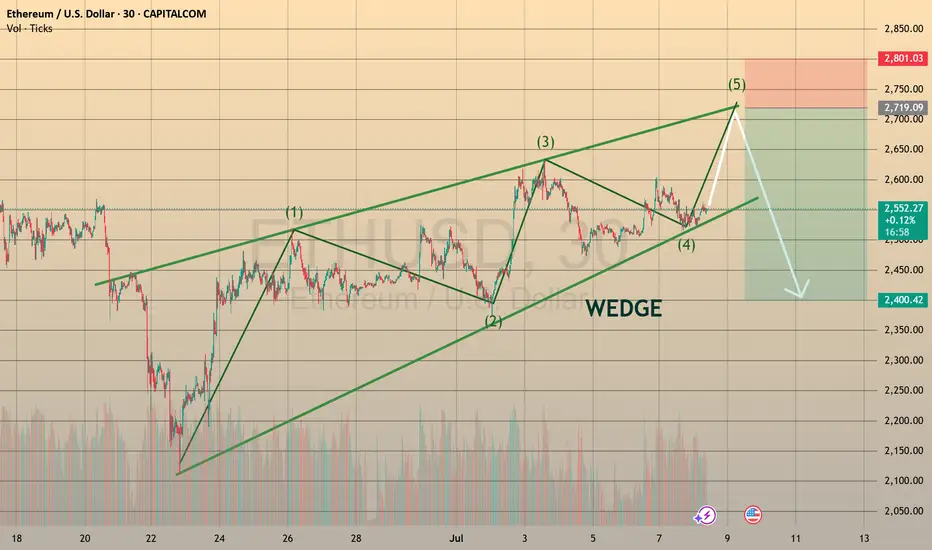
ETHUSD SHAPING THE BEARISH WEDGE, READY TO DECLINE
Ethereum has been forming the bearish wedge since the June 23th. The asset goes precisely according to Elliot 5-waves formation and is currently starting the wave E, rebounding from the lower border of the chart pattern.
What a trader may do?
We may go aggressive and trade long right immedia CAPITALCOM:ETHUSD tely with a take profit slightly below the 2,700.00 resistance level
🔼 a market buy order at 2544.19 with
❌a stop loss at 2489.90 and
🤑a take profit at 2691.35,
risk-reward ratio is 1:2.71 (nice one!)
However, I prefer to stay conservative and wait till the price tests the 2,700.00 level and enter the position there with
🔽 a pending sell stop order at 2691.35 with
❌a stop loss at 2759.92 and
🤑a take profit at 2409.89
risk-reward ratio here will be 1:4.1 (even better!)
In mid-term, I still expect ETHUSD to trade within a 2,400.00-2,700.00 range. So after assets reaches the 2,400.00, could be reasonable to look for new long opportunities! But will see.
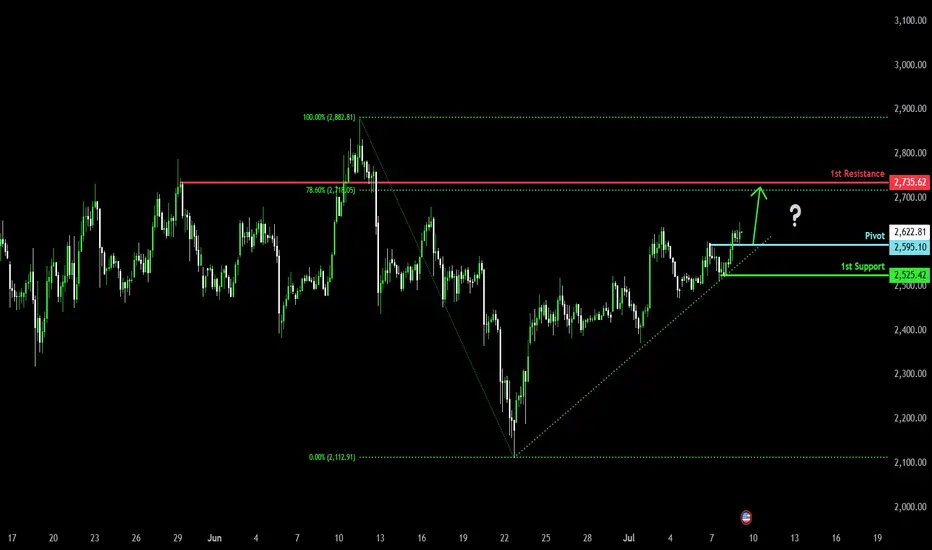
Bullish momentum to extend?Ethereum (ETH/USD) is reacting off the pivot which is a pullback support and could rise to the 78.6% Fibonacci resistance.
Pivot: 2,595.10
1st Support: 2,525.42
1st Resistance: 2,735.62
Risk Warning:
Trading Forex and CFDs carries a high level of risk to your capital and you should only trade with money you can afford to lose. Trading Forex and CFDs may not be suitable for all investors, so please ensure that you fully understand the risks involved and seek independent advice if necessary.
Disclaimer:
The above opinions given constitute general market commentary, and do not constitute the opinion or advice of IC Markets or any form of personal or investment advice.
Any opinions, news, research, analyses, prices, other information, or links to third-party sites contained on this website are provided on an "as-is" basis, are intended only to be informative, is not an advice nor a recommendation, nor research, or a record of our trading prices, or an offer of, or solicitation for a transaction in any financial instrument and thus should not be treated as such. The information provided does not involve any specific investment objectives, financial situation and needs of any specific person who may receive it. Please be aware, that past performance is not a reliable indicator of future performance and/or results. Past Performance or Forward-looking scenarios based upon the reasonable beliefs of the third-party provider are not a guarantee of future performance. Actual results may differ materially from those anticipated in forward-looking or past performance statements. IC Markets makes no representation or warranty and assumes no liability as to the accuracy or completeness of the information provided, nor any loss arising from any investment based on a recommendation, forecast or any information supplied by any third-party.
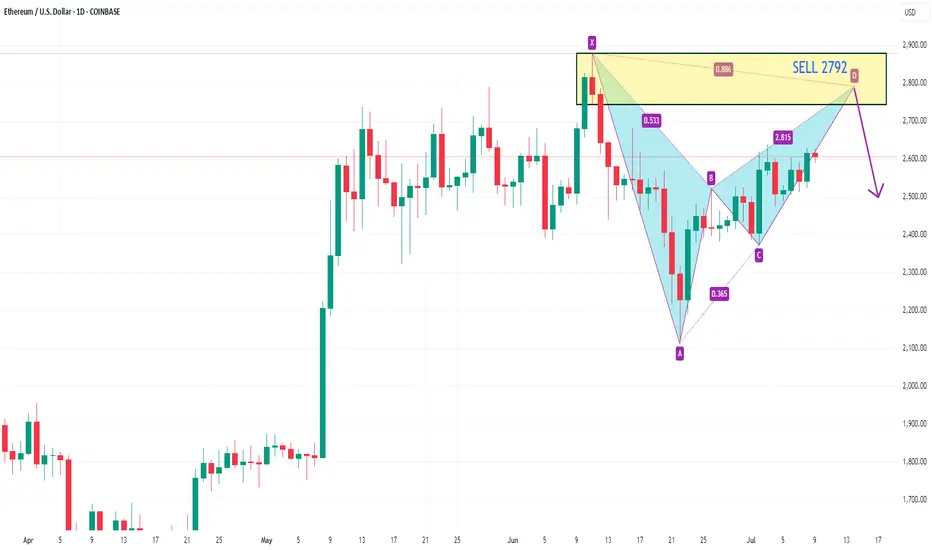
ETHUSD SELL 2792On the daily chart, ETHUSD stabilized and rebounded, and short-term bulls have the upper hand. At present, we can pay attention to the resistance near 2792 above, which is a potential short position of the bearish bat pattern, and this position is in the previous supply area.
ETH///LONG///4h TIME FRAMEETH braking trend lines on 4h. Trendline is from 30 days. 1:2 risk to reward. GL

Crypto Don't sleep on ETHHI it me again
don't you like my chart it's so beautiful right just look at the profits and % the everything well I'm drop something like this all week
COINBASE:ETHUSD

$ETH Price Will Rising $3098 in Q3, Bullish Flag Inverse AngleCRYPTOCAP:ETH price will Rising $3098 in Q3 in 2025, Price Showing a Bullish Flag Inverse Angle. it's a Reversal Pattern and Manipulation Price. See more on Chart.
Crypto News: An Ethereum address holding 900 ETH started moving coins Monday after spending nearly 10 years dormant.
The holder received these genesis coins in 2015 when ETH traded below 50 cents.
These pre-mined tokens were distributed to early Ethereum contributors before mining began.
Their current value reaches 2.2 million with ETH trading around 2,529 per coin.
This represents potential gains exceeding 5,000% from the original sub-dollar entry price.
The move follows similar whale activity, including a 27.6 million Ethereum sale in April.
Last week saw a Bitcoin whale move 8 billion after 14 years of hodling.
ETH remains 48% below its 2021 all-time high of 4,878 despite recent stability.
The holder technically isn't a whale, which requires a minimum of 10,000 ETH at current prices.
#Write2Earn #BinanceSquareFamily #ETH #SUBROOFFICIAL
Disclaimer: This article is for informational purposes only and does not constitute financial advice. Always conduct your own research before making any investment decisions. Digital asset prices are subject to high market risk and price volatility. The value of your investment may go down or up, and you may not get back the amount invested.

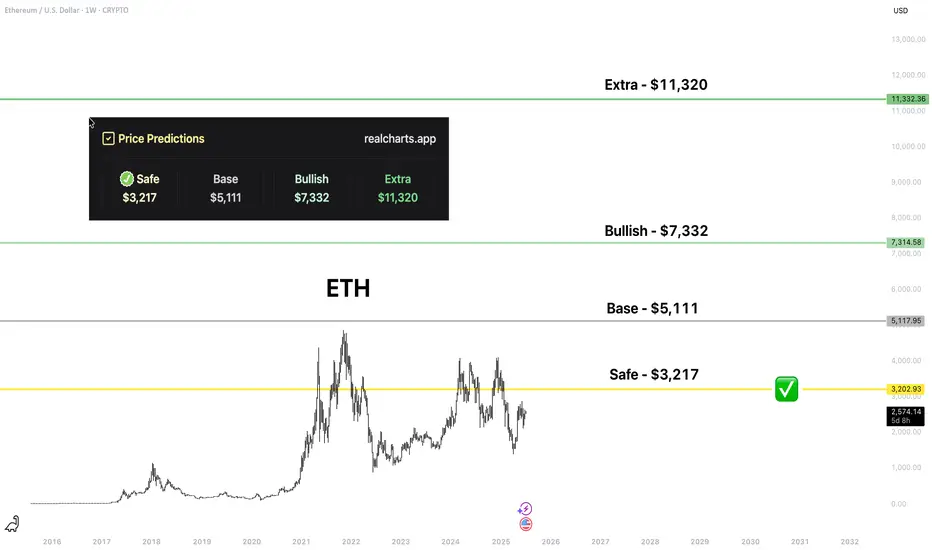
ETH | Price PredictionI believe that COINBASE:ETHUSD is the most important ecosystem for crypto and am bullish on it. The price of many great assets is absolutely dependent on ETH, because those assets have ETH as the key liquidity. I love assets from the ecosystem: OKX:MORPHOUSDT , BINANCE:WLDUSDT , BINANCE:OPUSDT , BINANCE:ARBUSDT , BINANCE:LDOUSDT , $BINANCE:STRKUSDT.
Those levels are from my platform. I believe that up to "Bullish" is really easy to hit this "cycle".
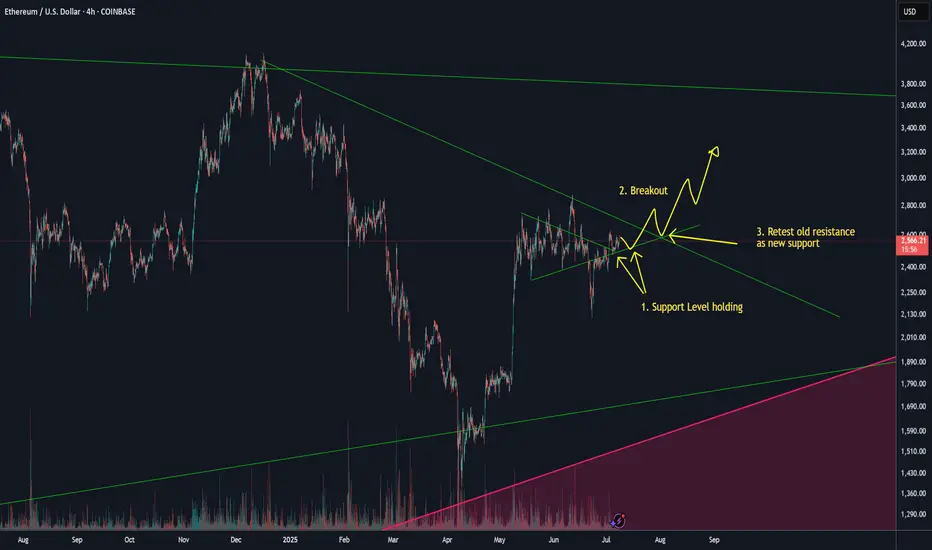
ETH to 3KETH is looking set to challenge the 3k level.
You can see by the small breakout and old resistance acting as new support levels at fig 1 that ETH is building towards a leg up.
Look for ETH to move higher with a small breakout (fig 2), retest (fig 3) before moving higher towards the 3K range.
Update on postAs expected chart is going for the buying liquidity
Buying can be done at 2480-90 levels with astoploss around 2450

Major direction ethI think eth 2nd wave local bottom is created around 2100.now we r moving in the third wave

Ethereum H4 | Potential bearish reversalEthereum (ETH/USD) is rising towards a swing-high resistance and could potentially reverse off this level to drop lower.
Sell entry is at 2,601.80 which is a swing-high resistance.
Stop loss is at 2,700.00 which is a level that sits above a swing-high resistance.
Take profit is at 2,397.10 which is a multi-swing-low support that aligns with a 50% Fibonacci retracement.
High Risk Investment Warning
Trading Forex/CFDs on margin carries a high level of risk and may not be suitable for all investors. Leverage can work against you.
Stratos Markets Limited (tradu.com ):
CFDs are complex instruments and come with a high risk of losing money rapidly due to leverage. 63% of retail investor accounts lose money when trading CFDs with this provider. You should consider whether you understand how CFDs work and whether you can afford to take the high risk of losing your money.
Stratos Europe Ltd (tradu.com ):
CFDs are complex instruments and come with a high risk of losing money rapidly due to leverage. 63% of retail investor accounts lose money when trading CFDs with this provider. You should consider whether you understand how CFDs work and whether you can afford to take the high risk of losing your money.
Stratos Global LLC (tradu.com ):
Losses can exceed deposits.
Please be advised that the information presented on TradingView is provided to Tradu (‘Company’, ‘we’) by a third-party provider (‘TFA Global Pte Ltd’). Please be reminded that you are solely responsible for the trading decisions on your account. There is a very high degree of risk involved in trading. Any information and/or content is intended entirely for research, educational and informational purposes only and does not constitute investment or consultation advice or investment strategy. The information is not tailored to the investment needs of any specific person and therefore does not involve a consideration of any of the investment objectives, financial situation or needs of any viewer that may receive it. Kindly also note that past performance is not a reliable indicator of future results. Actual results may differ materially from those anticipated in forward-looking or past performance statements. We assume no liability as to the accuracy or completeness of any of the information and/or content provided herein and the Company cannot be held responsible for any omission, mistake nor for any loss or damage including without limitation to any loss of profit which may arise from reliance on any information supplied by TFA Global Pte Ltd.
The speaker(s) is neither an employee, agent nor representative of Tradu and is therefore acting independently. The opinions given are their own, constitute general market commentary, and do not constitute the opinion or advice of Tradu or any form of personal or investment advice. Tradu neither endorses nor guarantees offerings of third-party speakers, nor is Tradu responsible for the content, veracity or opinions of third-party speakers, presenters or participants.

Eth liquidity huntingFirst eth to take upside liquidity and then downside after that continuation yo upside

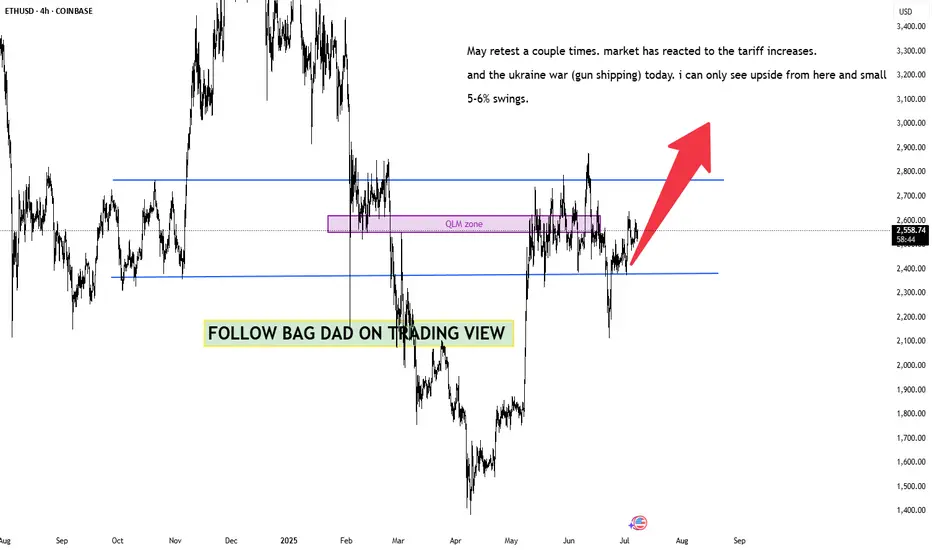
$ETH market prediction and analysis - BAG DAD here we have entered and already made 30% profits on this recent eth long. looking for a small retest and then we will break the QLM zone yet again for a increase and more profit margin oppertunity.
we handle SL in the range aswell to assure minimal loss of funds if we miss time the 2nd entry.
bag dad saves the day yet again !
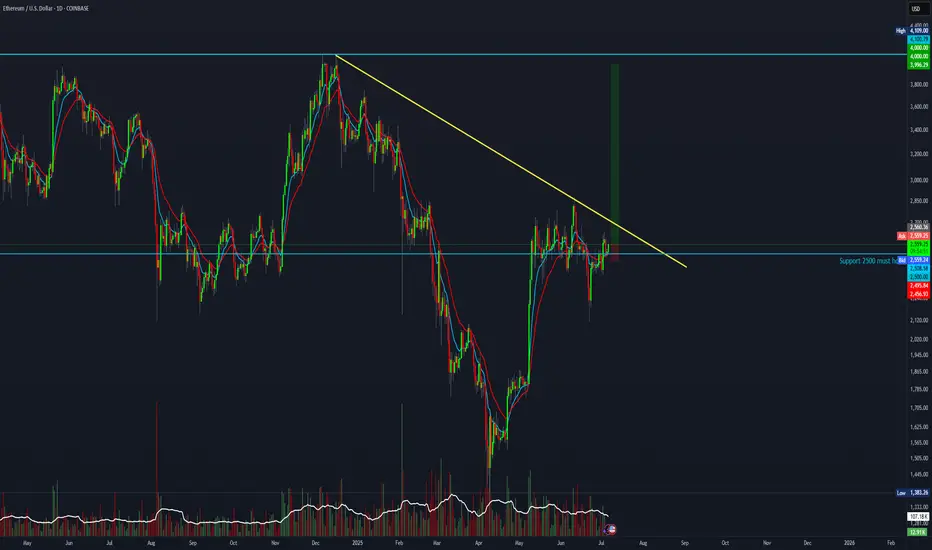
Ethereum setup with a 14 R:R.Let’s see if this time marks the beginning of bullish momentum.
This setup offers a 14:1 risk-to-reward ratio
Entry at 2560
Stop loss 2457
Target at 4000.
Ethereum: Potential for Long Trend as Bulls Eye Key Levels Current Price: $2581.17
Direction: LONG
Targets:
- T1 = $2645
- T2 = $2710
Stop Levels:
- S1 = $2530
- S2 = $2480
**Wisdom of Professional Traders:**
This analysis synthesizes insights from thousands of professional traders and market experts, leveraging collective intelligence to identify high-probability trade setups. The wisdom of crowds principle suggests that aggregated market perspectives from experienced professionals often outperform individual forecasts, reducing cognitive biases and highlighting consensus opportunities in Ethereum.
**Key Insights:**
Ethereum has shown signs of resilience and stability despite broader market volatility. Professional traders are favoring Ethereum as a potential long opportunity based on its consolidation at key support levels. Bullish divergence has been noticed in its relative strength index (RSI) and trading volume, indicating that sellers are starting to exhaust themselves while buyers gradually regain control. This sets the stage for a potential upward breakout in the coming days.
Moreover, Ethereum’s dominance in the digital asset space continues to benefit from the expanding use of decentralized applications (dApps) and smart contracts, which solidify the outlook for continued adoption and innovation. Long-term sentiment remains positive, with Ethereum receiving accumulating interest from institutional investors.
**Recent Performance:**
Ethereum recently held firm at $2580 despite testing lower support levels near $2500 in volatile trading sessions. Its ability to close above significant levels repeatedly demonstrates strong relative momentum compared to other cryptocurrencies. Over the last week, Ethereum has gained 4.5%, outperforming Bitcoin and other altcoins in the same period. This resilience has attracted renewed attention from both short-term swing traders and long-term holders.
**Expert Analysis:**
Technical analysts highlight Ethereum's symmetrical triangle formation over the past three weeks, which traditionally signals a breakout potential. Coupled with increasing accumulation volume, Ethereum seems poised to test resistance around $2645 in the next trading sessions. Should momentum sustain, secondary resistance near $2710 is realistic. However, traders should keep an eye on fundamental factors such as total market capitalization trends and external economic indicators, which may trigger unexpected volatility.
Moreover, Ethereum's scalability developments through upgrades such as "The Merge" to Ethereum 2.0 have bolstered its long-term outlook. Analysts remain optimistic about Ethereum's role as a cornerstone for decentralized finance (DeFi) and web3 technologies.
**News Impact:**
Recent reports of institutional accumulation—particularly from asset management firms—highlight growing confidence in Ethereum as a diversified investment vehicle. Moreover, Ethereum's sustained relevance in the transition to proof-of-stake (PoS) reinforces its strategic positioning. The cryptocurrency market has shown relative resilience amid equity market dips, and Ethereum's eco-friendly upgrades are being well-received in global markets. This news underpins Ethereum's current bullish setup.
**Trading Recommendation:**
Based on technical, fundamental, and sentiment analyses, Ethereum appears to be a strong candidate for a long position. Its consolidation above support levels, combined with bullish technical setups, signals potential upside in the near term. Traders should use disciplined stop losses, with S1 at $2530 and S2 at $2480, for risk management. Upside targets of $2645 (T1) and $2710 (T2) provide strong risk-reward opportunities. Ethereum's robust ecosystem and accumulating investor interest affirm its value as a long-term and speculative asset.
