ETHUSD pump from here ?? this is my ideaas per my analysis , eth took the weekly supply and wait fortook monklthy supply, on other side dxy in weak condition. so i expect eth going to reach next target 3334.69
ETHUSD trade ideas

ETHUSD is moving within the 2110.00 - 2500.00 range 👀Possible scenario:
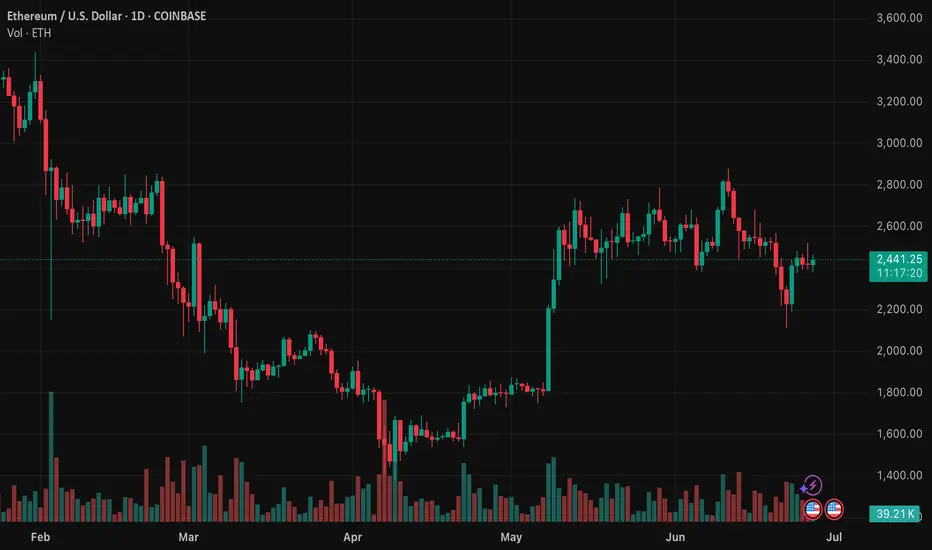
Ether briefly crossed $2,500 on June 29 but remained range-bound on June 30, fluctuating between $2,445 and $2,525. Traders are closely eyeing this resistance level amid rising volatility and renewed investor interest. With $269 million in net inflows in the past 24 hours, sentiment is improving. A clean breakout above $2,500 could drive further upside, but for now, THE remains in a tight consolidation, with traders on alert for the next move.
On the fundamentals side, Ethereum continues to strengthen. Over 35 million ETH—worth \$84 billion—are now staked, representing 28.3% of total supply. June saw a spike in staking after the SEC’s supportive guidance, though concerns linger as Lido, Binance, and Coinbase now control nearly 40% of validator power. Adding to momentum, the Ethereum community launched an onchain “time capsule” at EthCC, inviting users to lock messages and memories until the network’s 11th anniversary in 2026.
✅ Support and Resistance Levels
Support levels is now located at 2,400.00.
Now, the resistance levels are located at 2,500 and 2,550.00.
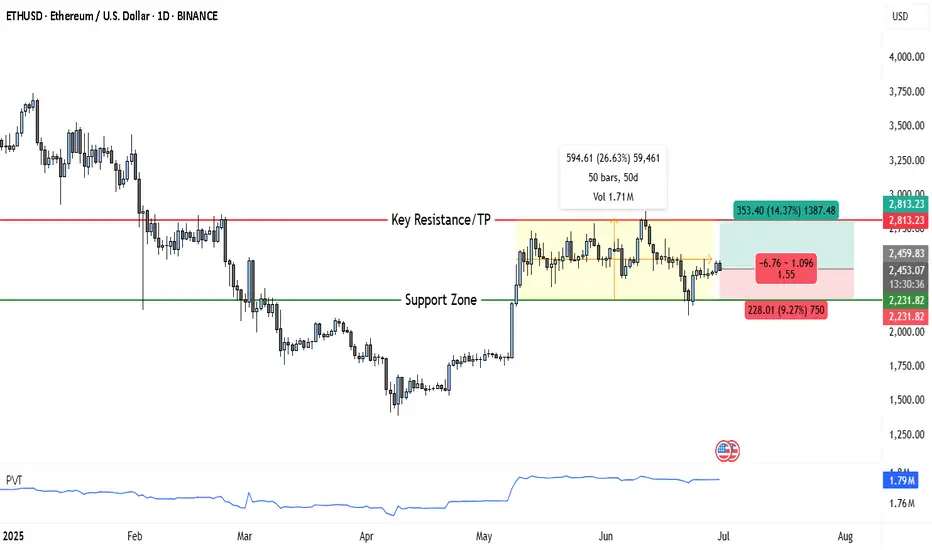
ETH Ready for Lift-Off: Traders Eye +14% Surge Toward $2,813Ethereum has been consolidating in a large sideways range after recovering from a steep decline earlier this year. The chart clearly shows a defined support zone and key resistance area, with price currently trading just above mid-range and attempting to reclaim bullish momentum.
Chart Structure Highlights
• Support Zone: Around $2,231 – $2,232, which has been tested multiple times and held firmly, confirming strong demand here.
• Key Resistance / Take Profit Area: Near $2,813, a major level where price was repeatedly rejected in the past.
• Consolidation Box: A ~50-day range between support and resistance, suggesting accumulation.
• Recent Price Action: ETH is attempting to break out of the upper side of this consolidation, with buyers gradually stepping in.
Trade Setup
✅ Entry Zone: $2,450–$2,460
ETH is currently near this area, which represents a conservative breakout attempt from the range. Traders may look for confirmation candles closing above $2,460 for added conviction.
✅ Stop Loss: $2,231
Placed just below the lower edge of the support zone to protect against a failed breakout and renewed selling.
✅ Take Profit Target: $2,813
This is the key resistance level marked on the chart, offering approximately +14% upside from the entry.
Reward-to-Risk Profile
• Potential Reward: ~$353 (+14.3%)
• Potential Risk: ~$228 (-9.2%)
• Reward:Risk Ratio: ~1.55:1
Summary of the Setup
Ethereum has spent nearly 50 days consolidating between $2,230 and $2,813, and is now threatening a breakout to the upside. This creates a favorable swing trade scenario with a clear invalidation level below the strong support zone. A sustained move above the consolidation could target the $2,813 resistance in the coming weeks.
ETHUSDT Weekly Technical OutlookETHUSDT Weekly Technical Outlook
Acting as a strong intermediate support, aligning with previous accumulation range Major psychological and technical support zone, possible final defence before a bullish continuation.
Ethereum (ETH) appears to be forming a base between $2200 and $2000, suggesting a potential accumulation phase. This consolidation indicates that ETH may be preparing for a strong bullish move A heavy pump
You may find more details in the chart Ps Support with like and Comments for Better analysis Thanks for supporting.
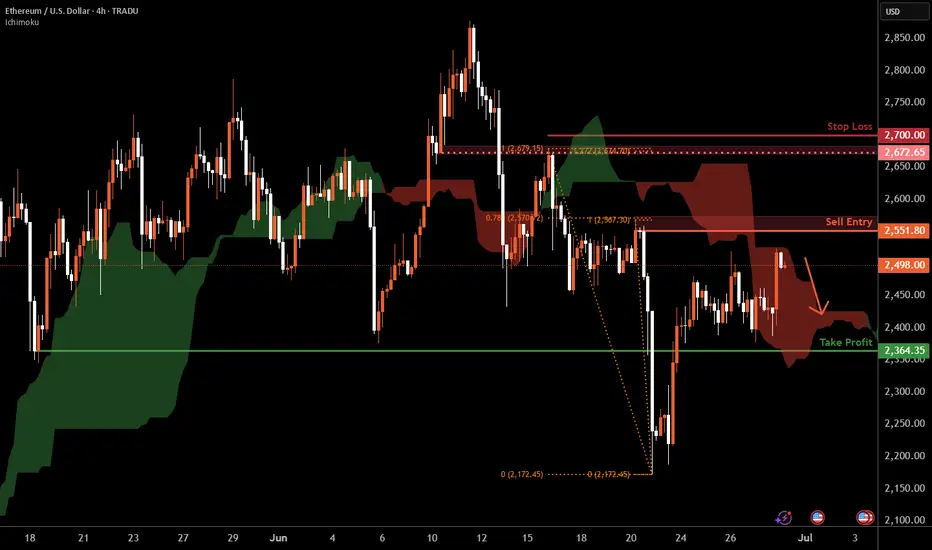
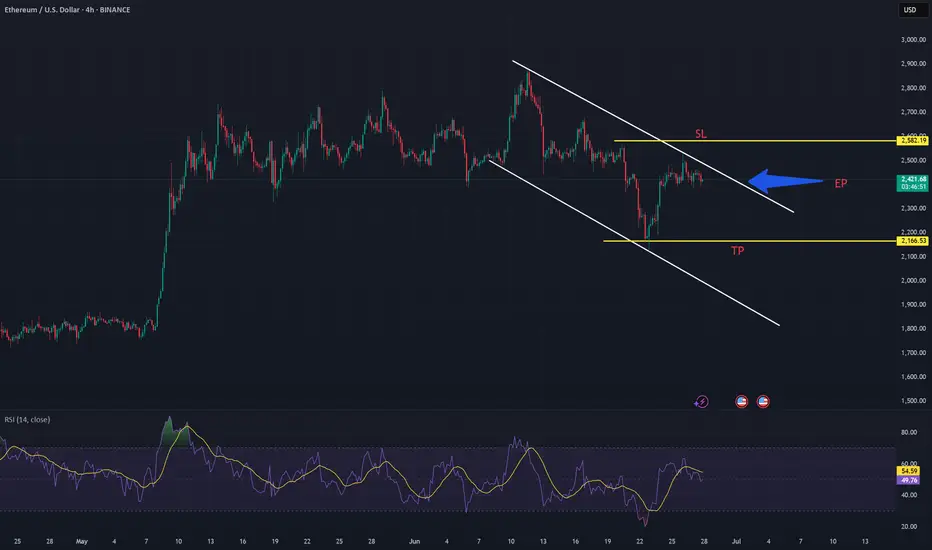
Ethereum H4 | Potential bearish reversalEthereum (ETH/USD) is rising towards a pullback resistance and could potentially reverse off this level to drop lower.
Sell entry is at 2,551.80 which is a pullback resistance that aligns closely with the 78.6% Fibonacci retracement.
Stop loss is at 2,700.00 which is a level that sits above the 127.2% Fibonacci extension and an overlap resistance.
Take profit is at 2,364.35 which is a pullback support.
High Risk Investment Warning
Trading Forex/CFDs on margin carries a high level of risk and may not be suitable for all investors. Leverage can work against you.
Stratos Markets Limited (tradu.com ):
CFDs are complex instruments and come with a high risk of losing money rapidly due to leverage. 63% of retail investor accounts lose money when trading CFDs with this provider. You should consider whether you understand how CFDs work and whether you can afford to take the high risk of losing your money.
Stratos Europe Ltd (tradu.com ):
CFDs are complex instruments and come with a high risk of losing money rapidly due to leverage. 63% of retail investor accounts lose money when trading CFDs with this provider. You should consider whether you understand how CFDs work and whether you can afford to take the high risk of losing your money.
Stratos Global LLC (tradu.com ):
Losses can exceed deposits.
Please be advised that the information presented on TradingView is provided to Tradu (‘Company’, ‘we’) by a third-party provider (‘TFA Global Pte Ltd’). Please be reminded that you are solely responsible for the trading decisions on your account. There is a very high degree of risk involved in trading. Any information and/or content is intended entirely for research, educational and informational purposes only and does not constitute investment or consultation advice or investment strategy. The information is not tailored to the investment needs of any specific person and therefore does not involve a consideration of any of the investment objectives, financial situation or needs of any viewer that may receive it. Kindly also note that past performance is not a reliable indicator of future results. Actual results may differ materially from those anticipated in forward-looking or past performance statements. We assume no liability as to the accuracy or completeness of any of the information and/or content provided herein and the Company cannot be held responsible for any omission, mistake nor for any loss or damage including without limitation to any loss of profit which may arise from reliance on any information supplied by TFA Global Pte Ltd.
The speaker(s) is neither an employee, agent nor representative of Tradu and is therefore acting independently. The opinions given are their own, constitute general market commentary, and do not constitute the opinion or advice of Tradu or any form of personal or investment advice. Tradu neither endorses nor guarantees offerings of third-party speakers, nor is Tradu responsible for the content, veracity or opinions of third-party speakers, presenters or participants.
ETHEREUM WILL GROW|LONG|
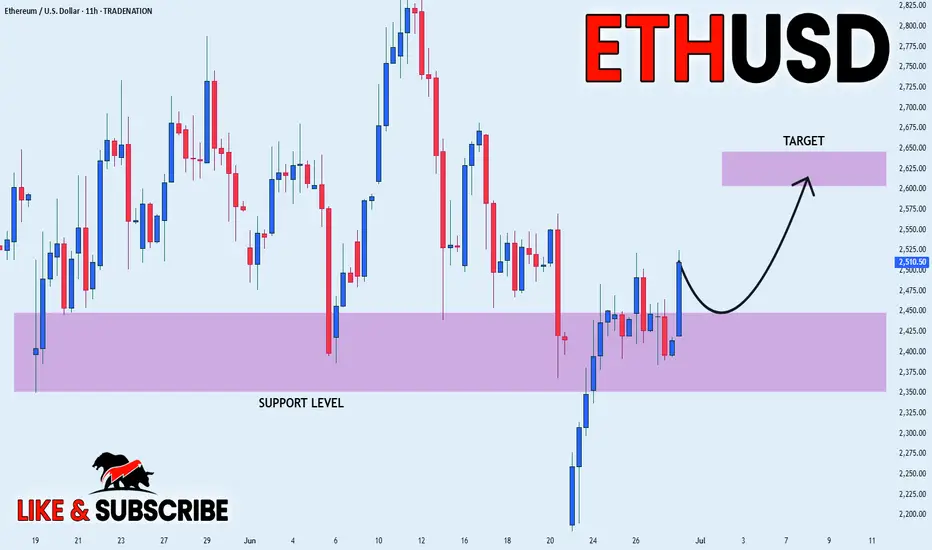
✅ETHEREUM consolidated
Above the horizontal support
Around 2400$ and now we are
Finally seeing a bullish rebound
So we are bullish biased and
We will be expecting a
Further move up
LONG🚀
✅Like and subscribe to never miss a new idea!✅
Disclosure: I am part of Trade Nation's Influencer program and receive a monthly fee for using their TradingView charts in my analysis.
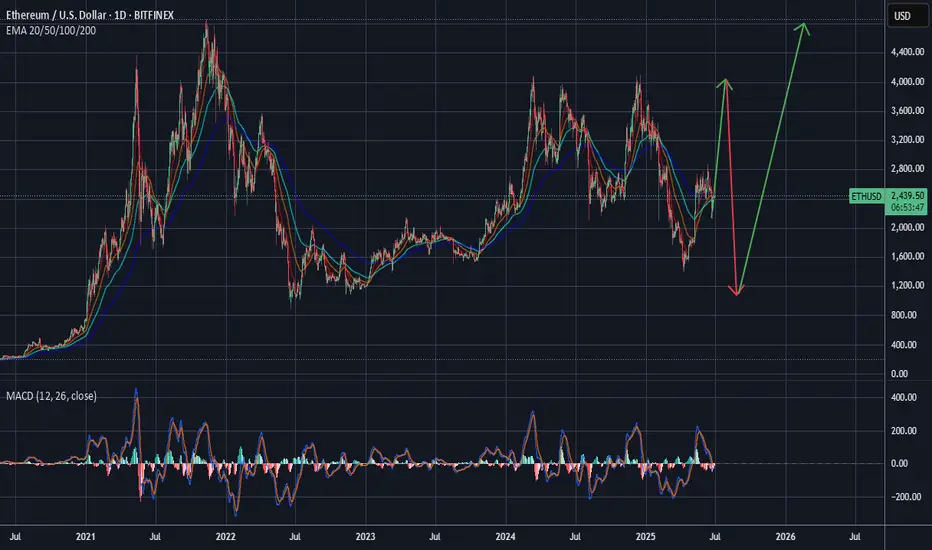
Can Ethereum start a daily uptrend?This daily uptrend might fail because btc dominance is strong but eth bulls are watching
ETH/USDExpecting something like this on most alts.
I've been waiting patiently for a real correction in everything, but my timing was drastically off. Looks like FOMO is still in charge. My guess, stock market to ATH after ATH for a while and a final wave of FOMO for crypto will enter the air.
I believe the majority are expecting a COVID-like rebound, followed by rally continuation, but the majority tends to be wrong.
What I can tell you is the true crypto bull run will not begin on optimism, as it has been...
It will begin on pessimism.
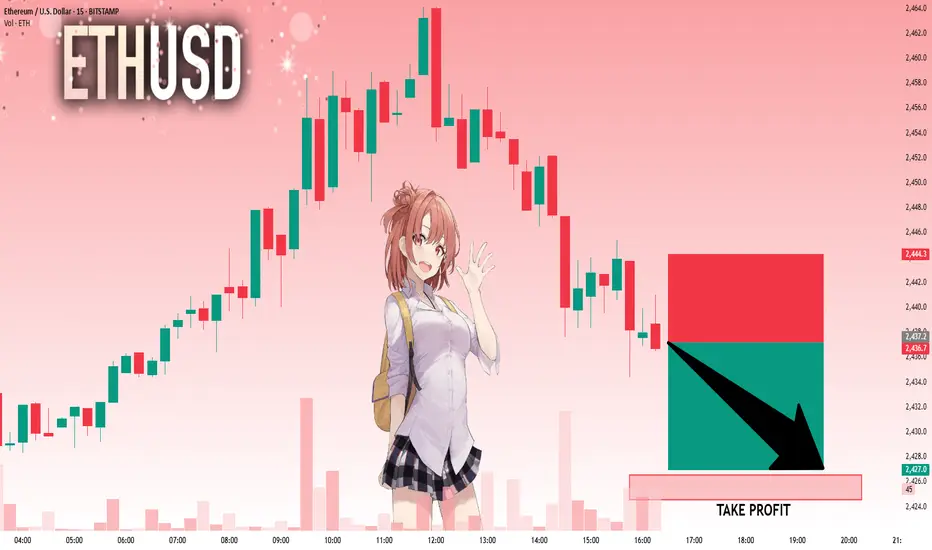
ETHUSD: Strong Bearish Sentiment! Short!
My dear friends,
Today we will analyse ETHUSD together☺️
The market is at an inflection zone and price has now reached an area around 2,437.2 where previous reversals or breakouts have occurred.And a price reaction that we are seeing on multiple timeframes here could signal the next move down so we can enter on confirmation, and target the next key level of 2,426.5..Stop-loss is recommended beyond the inflection zone.
❤️Sending you lots of Love and Hugs❤️
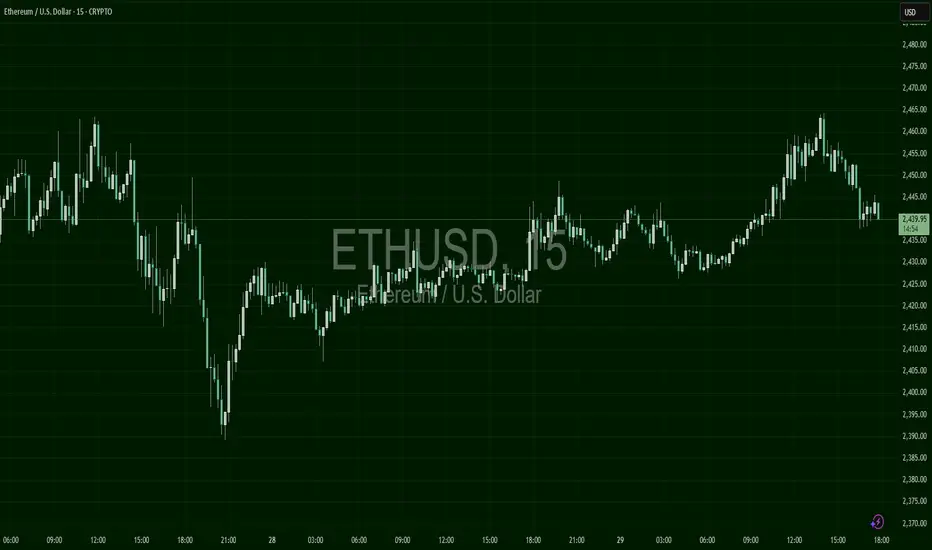
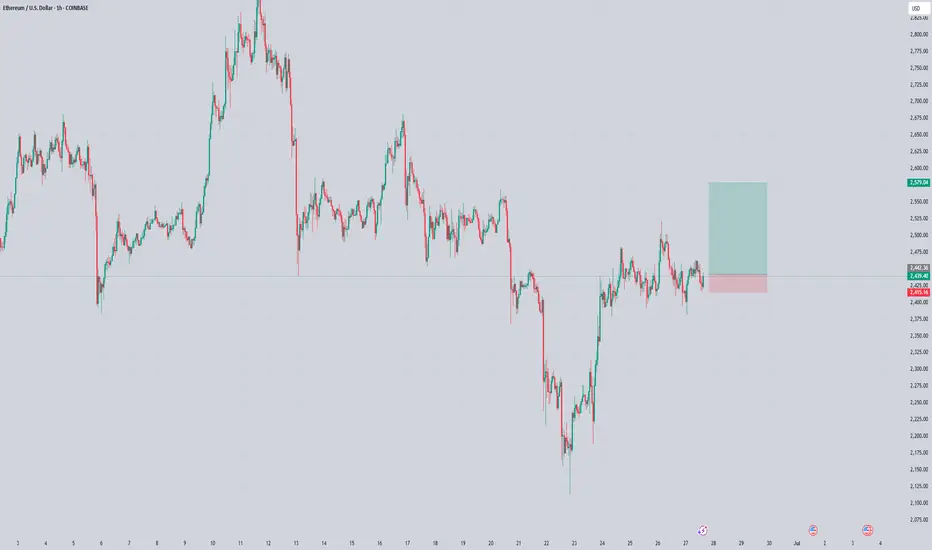
ETHUSD – V-Recover, Then WaitEthereum broke down heavily to $2,371 before mounting a V-shaped recovery. After reclaiming the $2,420–$2,430 area, price entered a broad chop zone. Multiple local higher lows signal strength building, though upside is capped near $2,460. Breakout traders should watch for a clean move above $2,465 for momentum continuation. Breakdown below $2,435 invalidates.
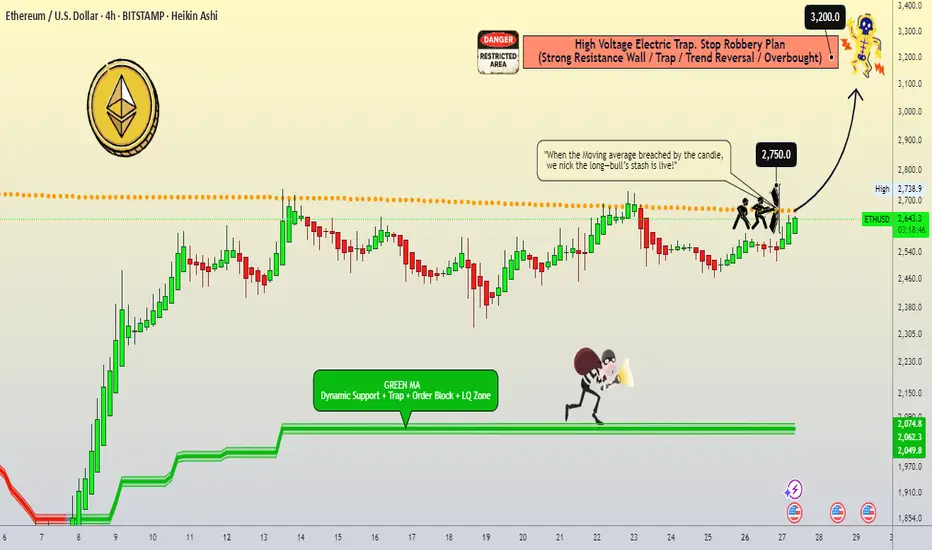
Ultimate Ethereum Heist Plan : Catch the ETH/USD Bull Run!🌍 Hello, Global Money Makers! 🌟 Salaam, Ciao, Hola! 🌟
Dear Traders and Market Raiders, 🤑💸
Get ready to execute the *Thief Trading Strategy*—a slick blend of technical and fundamental analysis designed to conquer the ETH/USD crypto market! 📈💥 Follow the plan outlined in the chart for a *long entry* and aim to cash out near the high-risk *Yellow ATR Zone*. This is where the market gets wild—overbought conditions, consolidation, or even a trend reversal could trap the bears! 🐻💪 Take your profits and treat yourself—you’ve earned it! 🎉
**Entry 📈:** The heist begins! Wait for the *Moving Average breakout* at 2750 to strike. Bullish gains are calling! 💰
- Set *buy stop orders* above the MA for a clean breakout.
- Alternatively, place *buy limit orders* on a pullback within a 15 or 30-minute timeframe, targeting the most recent swing low/high.
📢 *Pro Tip:* Set an alert on your chart to catch the breakout moment! 🚨
**Stop Loss 🛑:** Listen up, crew! 🗣️ For *buy stop orders*, hold off on setting your stop loss until *after* the breakout. Place it at the nearest swing low on the 4H timeframe (around 2360) for day/swing trades.
- Adjust your stop loss based on your risk tolerance, lot size, and number of orders.
⚠️ Take control of your risk—it’s your heist, not mine! 😎🔥
**Target 🎯:** Aim for 3200 or exit early if the market signals a reversal.
**Scalpers, Eyes Here 👀:** Stick to *long-side scalping*. Got deep pockets? Jump in now! Smaller accounts? Join the swing traders and follow the plan. Use a *trailing stop loss* to lock in your loot. 💰
**Market Outlook 🐂:** The ETH/USD market is charging with bullish momentum, fueled by key fundamentals. ☝️ Check the linkks for *COT Report*, macroeconomics, sentiment, and intermarket analysis for a full picture. 👉🏻🔗
**⚠️ Trading Alert: News & Risk Management 📰**
News releases can shake up prices and volatility. Protect your positions:
- Avoid new trades during major news events.
- Use *trailing stop-loss orders* to secure profits.
💥 *Boost This Plan!* 💥 Support our *Thief Trading Crew* by hitting the Boost button. Let’s make money effortlessly every day with this strategy! 🚀🤝 Stay tuned for the next heist plan, and let’s keep raiding the markets! 🤑🐱👤🎉
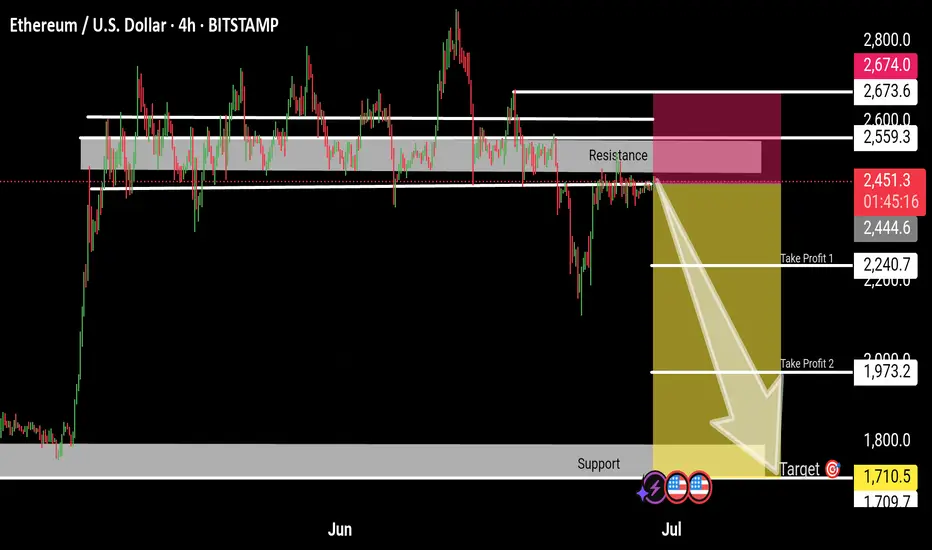
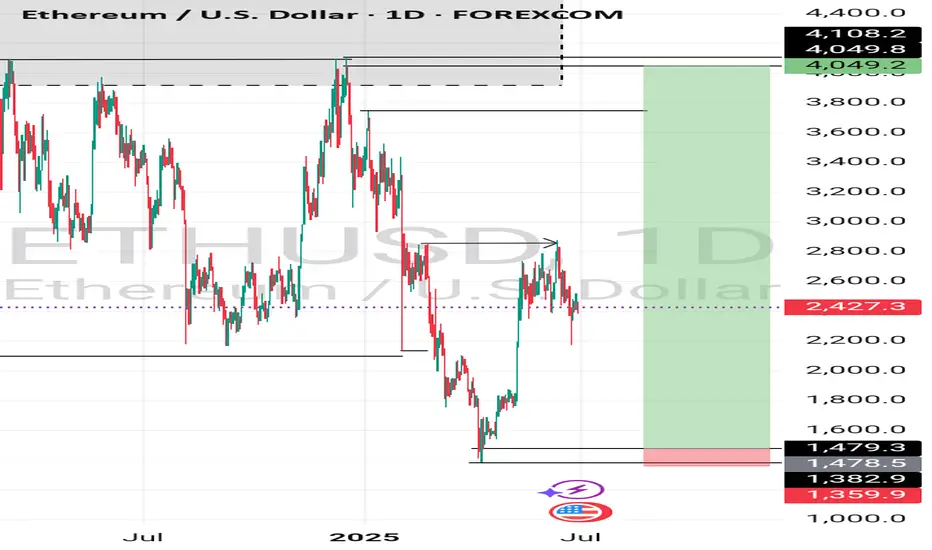
ETH/USD – Bearish Setup with Potential BreakdownCurrent Price: $2,451.3
Resistance Zone: $2,559 – $2,674
Support Zone: Around $1,710
Market Bias: Bearish
---
📌 Overview:
Ethereum is currently testing a major resistance zone between $2,559 and $2,674. This zone has historically acted as strong rejection, indicating potential seller dominance in this area. Multiple failed attempts to break above this level suggest a possible short opportunity.
---
📉 Trade Setup:
Short Entry: Near current price or on confirmation below $2,444
Stop Loss: Above $2,674 (above resistance zone)
Take Profit 1: $2,240.7 – Minor support level
Take Profit 2: $1,973.2 – Medium-term target
Final Target: $1,710.5 – Strong support zone and potential bottom
---
🧠 Technical Notes:
Price has formed a consolidation range just under resistance.
Strong bearish engulfing pattern seen on lower timeframes.
Breakdown from the highlighted zone could trigger a sharp move downward.
Risk-to-reward ratio favors short position if price fails to reclaim above resistance.
---
🚨 Risk Management:
Only enter with confirmation (e.g., 4H candle close below $2,440). Adjust position size based on your risk tolerance. Monitor for any invalidation signs such as strong bullish breakout above $2,674.
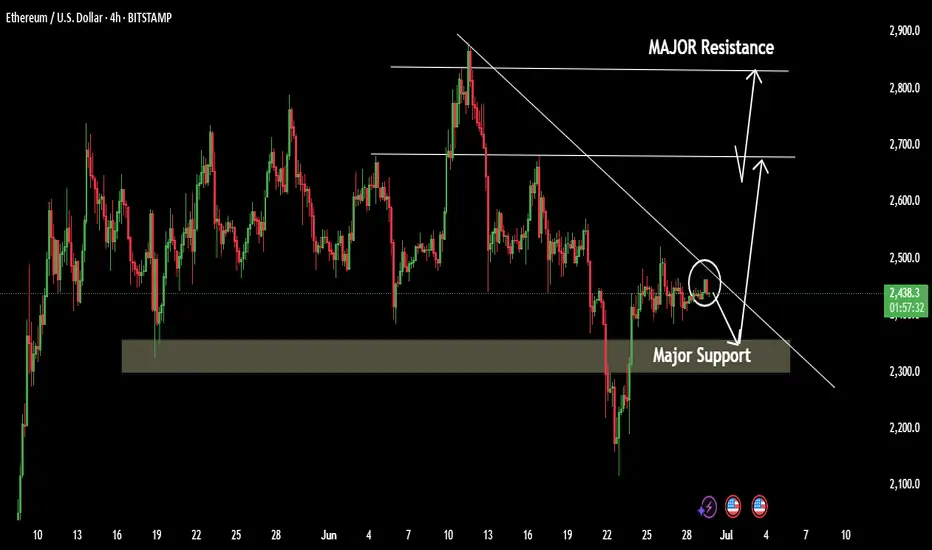
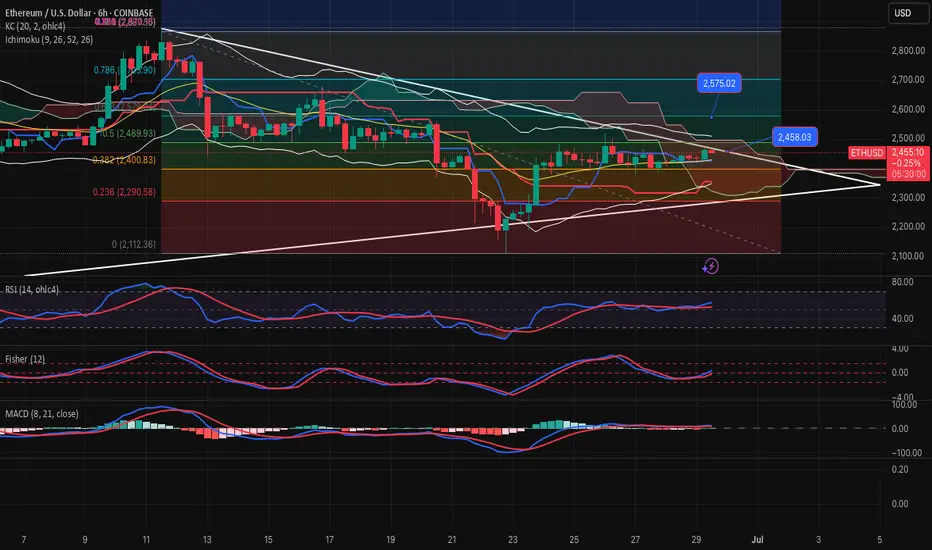
ETHUSD-BUY strategy 6 hourly chart ETH is on the verge of a break $ 2,458 and supported by some of the indicators.
The break when happen, will likely see a move towards $ 2,580-2,600 again and considering BTC being in the $ 107-108k range, the ETHUSD has a chance to see those levels.
Strategy BUY @ $ 2,450-2,475 and take profit near $ 2,600.
Eth/UsdA possible bullish move according to Daily time frame .
A possible drop according to 1h,15m time frame . So since well DXY might go up to a certain area to make price changes , for me that means all USD Pairs might drop for a period of time to mitigate areas that will push it back up.
I will see how it goes.
Happy Trading
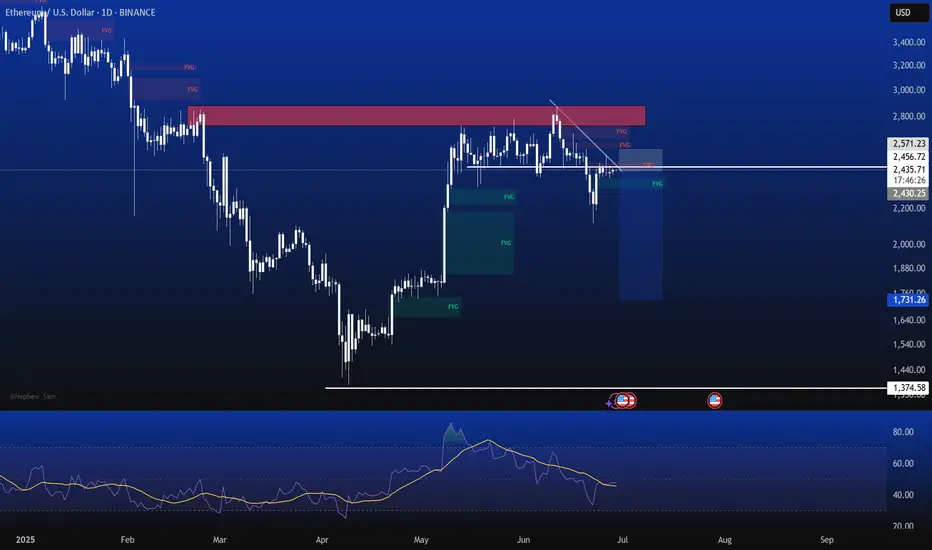
Bearish on ETH! Price has tested and retested the daily sellers order blocking creating a triple top bearish reversal pattern, which was then swept of liquidity. From there, Price broke below the neckline of the triple top and retested the now formed resistance at the 2,450 level. Also in this move we can see a daily bearish trendline that is being respected. This screams bearish sentiments to me, so I will be selling!
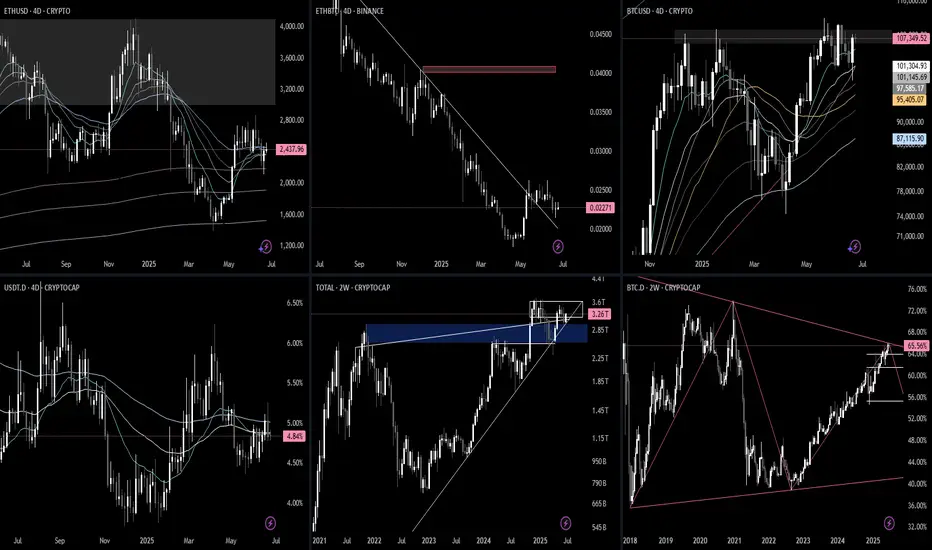
Has BTC.D Topped?All... based on the trend structure, it looks like bitcoin dominance may have topped. If so, we should see some fun price action start to happen over the next 2 weeks. ETH/BTC ratio should start to increase, USDT.D should start to drop, and TOTAL should start to increase as well.
Stand fast. Keep faith. Remain vigilant.
Ethereum monthly cup and handleSoooo, this is my first post, and I'm not really too sure if I'm seeing this correctly, can somebody please explain to me why I'm wrong or if I'm right. Cuzzzzz this seems extremely bullish to me.
This is on the monthly timeframe, so this projection is for closer to November - February, IMO...
AM I SEEING THIS CORRECTLY, or is this my bullish personality shining through.
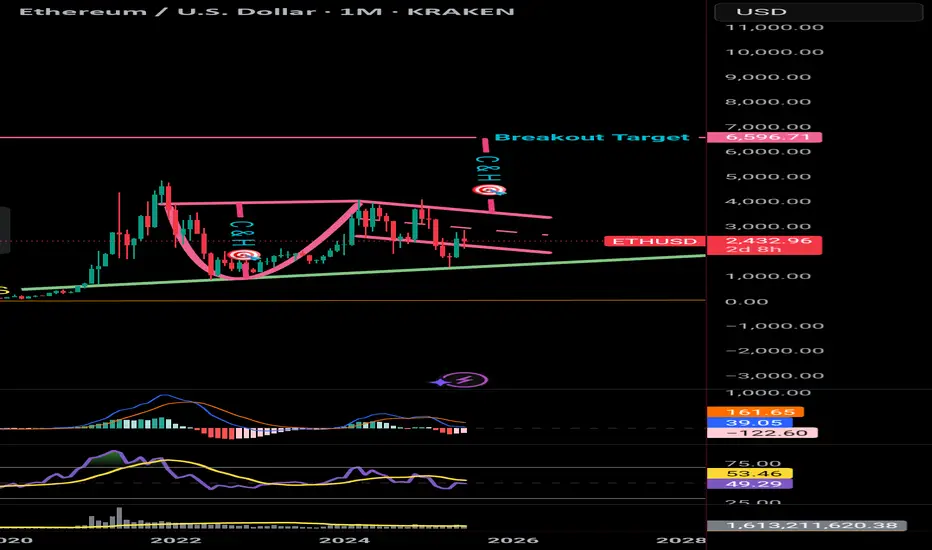
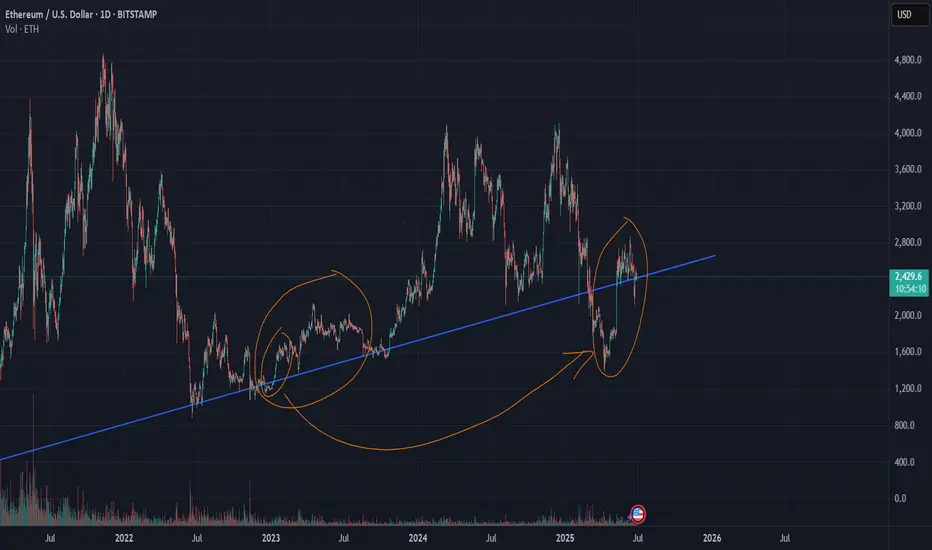
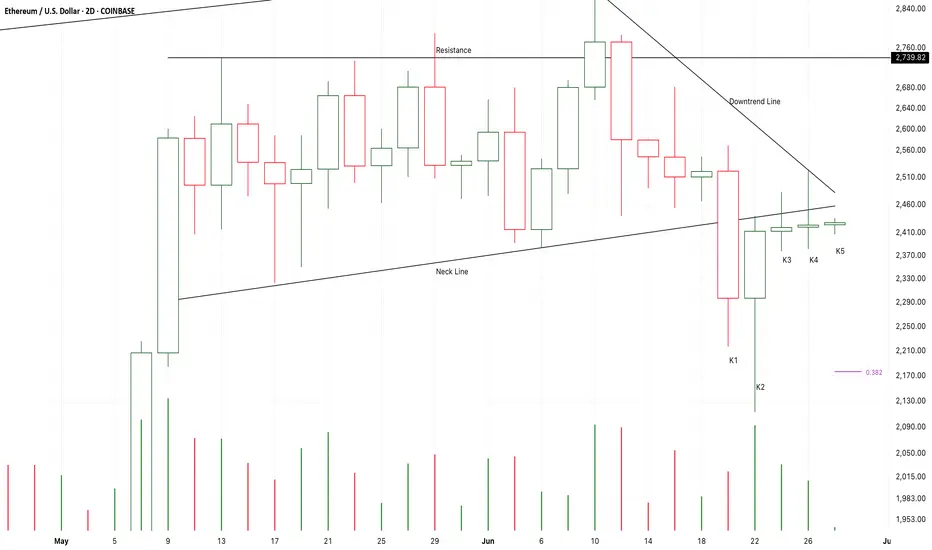
Chart Pattern Analysis Of ETH.
K2 verified a potential fake down of K1.
And,the supply pressure near the neck line keep decreasing.
It seems that K6 will choose to break up or fall down.
If the following candles close upon the neck line,
I will try to buy in.
If the following candles close below K3,
The risk will sharply increase.
Long-2388/Stop-2345/Target-2800
Long-2420/Stop-2345/Target-2800
Long-2488/Stop-2345/Target-2800
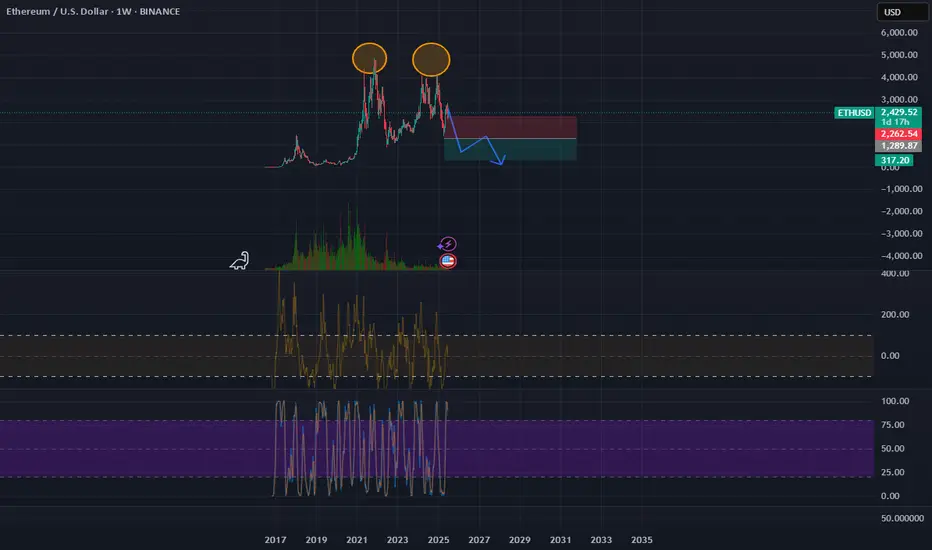
IS Ethereum AWAITING A MAJOR CRASH? CRASH TO USD 660 ? THE GREAT EARTHQUAKE OF THE CRYPTO WORLD IS COMING, WINTER IS COMING, JUNE 28, 2025... THE BIG SHORT !
Technical analysis of Ethereum, which is introduced as the silver of the crypto world, shows that a serious crash infrastructure has formed.
1. The most important technical data is the formation of a double top formation in monthly-weekly charts.
2. The low performance it has shown against the rise of Bitcoin is remarkable.
3. Again, it is the gartley pattern that is operated insidiously in long-term charts.
1. Target: 660 USD (I expect a reactive buying reaction that will then extend to 1200 dollars)
2. Target: 66 USD (It's embarrassing to say this, but the crypto world is a soap bubble. However, I personally do not see Ethereum as an investment vehicle in the long term.)
I AM AWARE THAT MAKING A 66 DOLLAR ETHEREUM ANALYSIS ON JUNE 28, 2025 IS A CRAZY THING, BUT I THINK THIS DOWN FORMATION HAS BEEN FORMED.
IT SEEMS THAT SIX IS A LUCKY NUMBER FOR MR. Vitalik . WHAT ABOUT YOU?
THIS IS NOT AN INVESTMENT ADVICE. IT IS ONLY A FINANCIAL PERSONAL STUDY FOR EDUCATIONAL PURPOSES. IT IS A PERSONAL ESTIMATE. THERE IS ABSOLUTELY NO GUARANTEED ACCURACY. ALL INVESTORS MUST MAKE THEIR OWN ANALYSIS.
ETHUSD is moving within the 2110.00 - 2550.00 range 👀 Possible scenario:
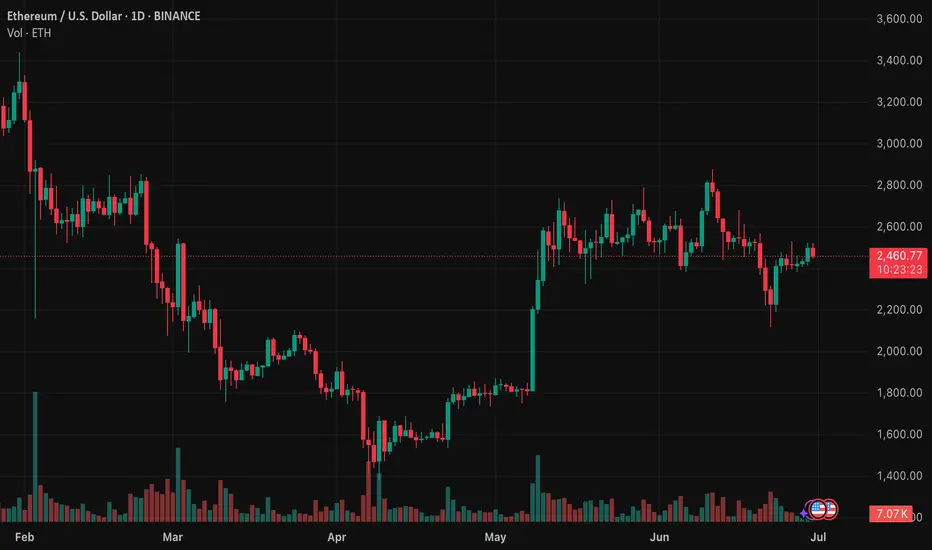
Ethereum is holding above the key $2,400 level, trading at $2,450, despite a 7.45% drop over the past 30 days and a 5% weekly loss. Staying above this support keeps ETH within the range it’s held since early May.
On-chain data shows strong accumulation: whales bought 1 million ETH on June 16 — the biggest daily purchase since 2018. Spot ETFs also saw $232.4M in inflows over three days, signaling rising retail interest. While Q3 is typically weak for ETH, current momentum suggests bullish potential. A firm move above $2,400 could set the stage for a test of the range highs.
✅ Support and Resistance Levels
Support levels are now located at 2,110.00 and 2,400.00.
Now, the resistance level is located at 2,550.00.