ETHUSD trade ideas

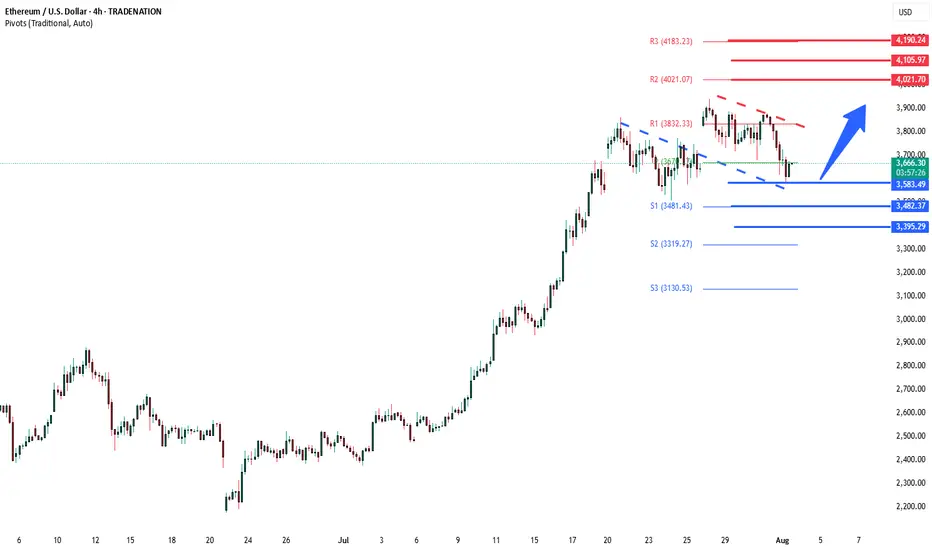
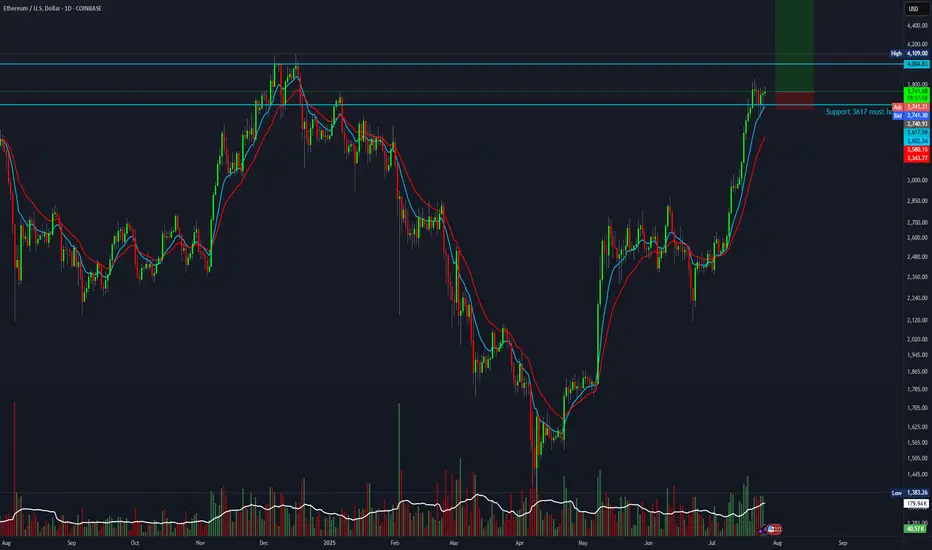
ETHUSD previous resistance new support The ETHSD remains in a bullish trend, with recent price action showing signs of a corrective pullback within the broader uptrend.
Support Zone: 3,667 – a key level from previous consolidation. Price is currently testing or approaching this level.
A bullish rebound from 3,667 would confirm ongoing upside momentum, with potential targets at:
4,020 – initial resistance
4,105 – psychological and structural level
4,190 – extended resistance on the longer-term chart
Bearish Scenario:
A confirmed break and daily close below 3,667 would weaken the bullish outlook and suggest deeper downside risk toward:
3,584 – minor support
3,482 – stronger support and potential demand zone
Outlook:
Bullish bias remains intact while the ETHUSD holds above 3,667. A sustained break below this level could shift momentum to the downside in the short term.
This communication is for informational purposes only and should not be viewed as any form of recommendation as to a particular course of action or as investment advice. It is not intended as an offer or solicitation for the purchase or sale of any financial instrument or as an official confirmation of any transaction. Opinions, estimates and assumptions expressed herein are made as of the date of this communication and are subject to change without notice. This communication has been prepared based upon information, including market prices, data and other information, believed to be reliable; however, Trade Nation does not warrant its completeness or accuracy. All market prices and market data contained in or attached to this communication are indicative and subject to change without notice.
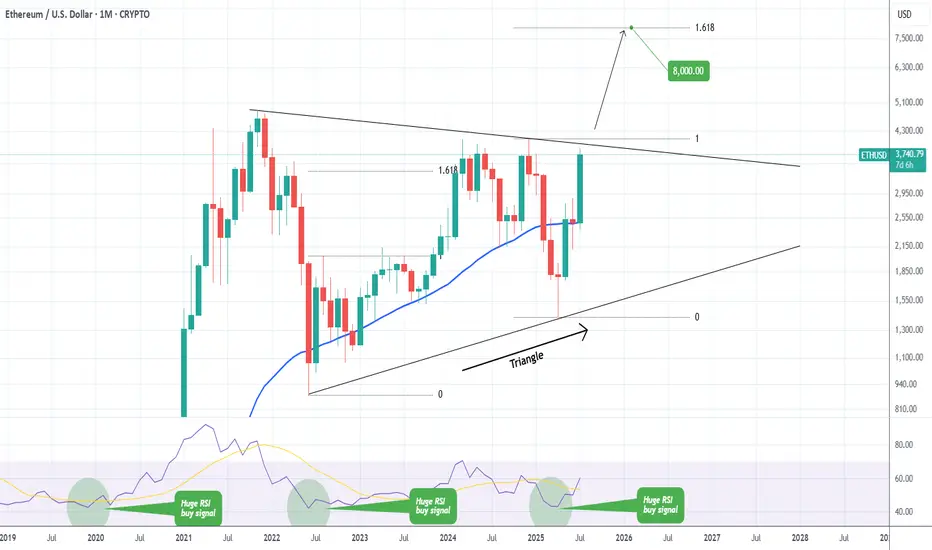
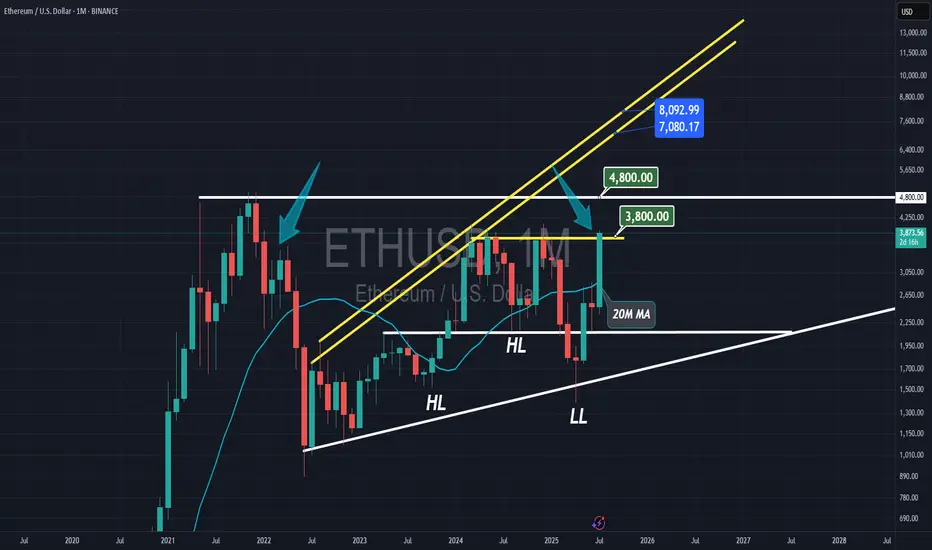
ETHEREUM Massive Triangle break-out ahead??Ethereum (ETHUSD) has been trading within a 4-year Triangle for the entirety of this Cycle. The recent post April rally has been the most aggressive since the parabolic rally that led to the Top of the previous Cycle.
The price is now almost on the top (Lower Highs trend-line) of the Triangle. A break above it, can initiate an aggressive Bullish Leg towards the 1.618 Fibonacci extension ($8000), which was the level that was marginally exceeded during ETH's first rally of this Cycle.
-------------------------------------------------------------------------------
** Please LIKE 👍, FOLLOW ✅, SHARE 🙌 and COMMENT ✍ if you enjoy this idea! Also share your ideas and charts in the comments section below! This is best way to keep it relevant, support us, keep the content here free and allow the idea to reach as many people as possible. **
-------------------------------------------------------------------------------
💸💸💸💸💸💸
👇 👇 👇 👇 👇 👇
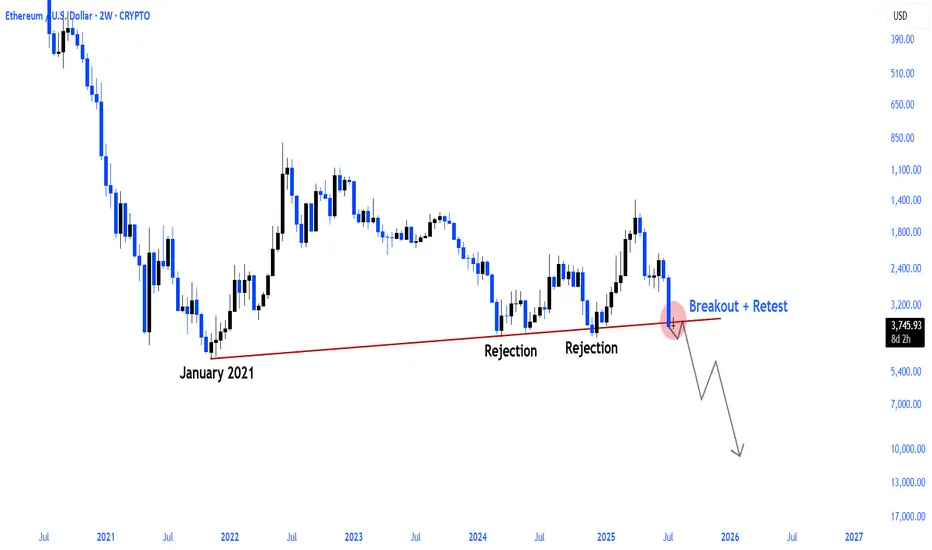
ETH eyes on $3431.83: Golden Genesis fib may END this SurgeETH finally got a surge after a long consolidation.
But has just hit a Golden Genesis fib at $3431.83
Like hitting a brick wall, it is now staggering back.
It is PROBABLE that we orbit this fib a few times.
It is POSSIBLE that we reject here to end the surge.
It is PLAUSIBLE that we Break-n-Retest to continue.
We were here at this EXACT spot 8 months ago:
=============================================
.

ETH/USDEuphoria has been reached. Rally over.
Global freefall anticipated.
SPX or BTC should begin it.

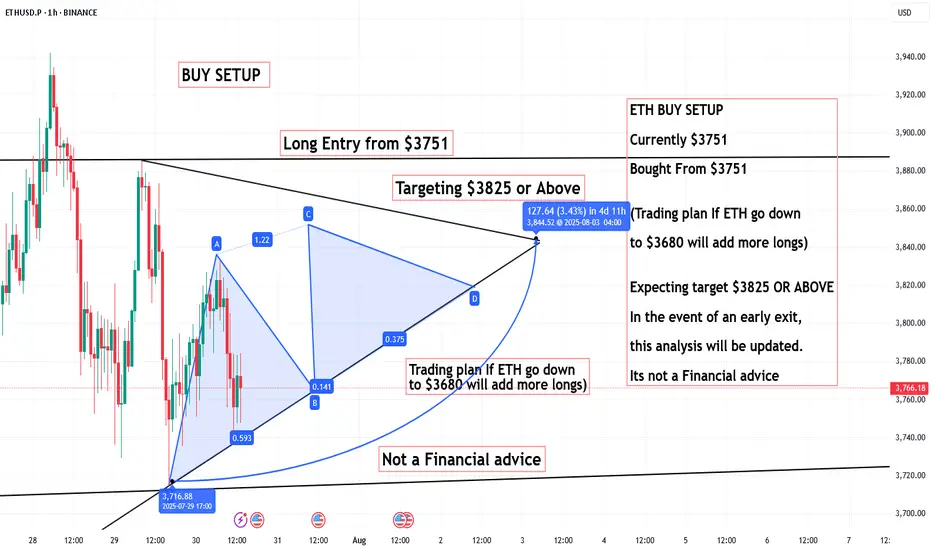
ETH BUY SETUP, Bought From $3751ETH BUY SETUP
Currently $3751
Bought From $3751
(Trading plan If ETH go down ,
to $3680 will add more longs)
Expecting target $3825 OR ABOVE
In the event of an early exit,
this analysis will be updated.
Its not a Financial advice
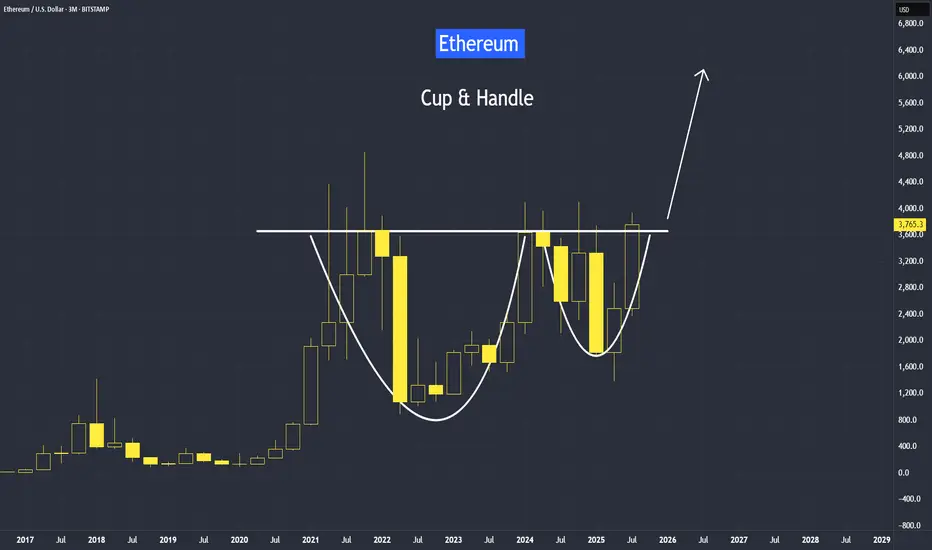
Cup and Handle Setup in Ethereum Since April trough, Ethereum has risen by 179%, delivering a higher rate of return than Bitcoin at 66%.
But most of our attention is on Bitcoin, breaking above the 120,000 level.
Why is Ethereum quietly gaining ground —and what does the future hold for Ethereum?
It's video version on its trading strategies:
Mirco Bitcoin Futures and Options
Ticker: MET
Minimum fluctuation:
$0.50 per ether = $0.05 per contract
Disclaimer:
• What presented here is not a recommendation, please consult your licensed broker.
• Our mission is to create lateral thinking skills for every investor and trader, knowing when to take a calculated risk with market uncertainty and a bolder risk when opportunity arises.
CME Real-time Market Data help identify trading set-ups in real-time and express my market views. If you have futures in your trading portfolio, you can check out on CME Group data plans available that suit your trading needs tradingview.sweetlogin.com
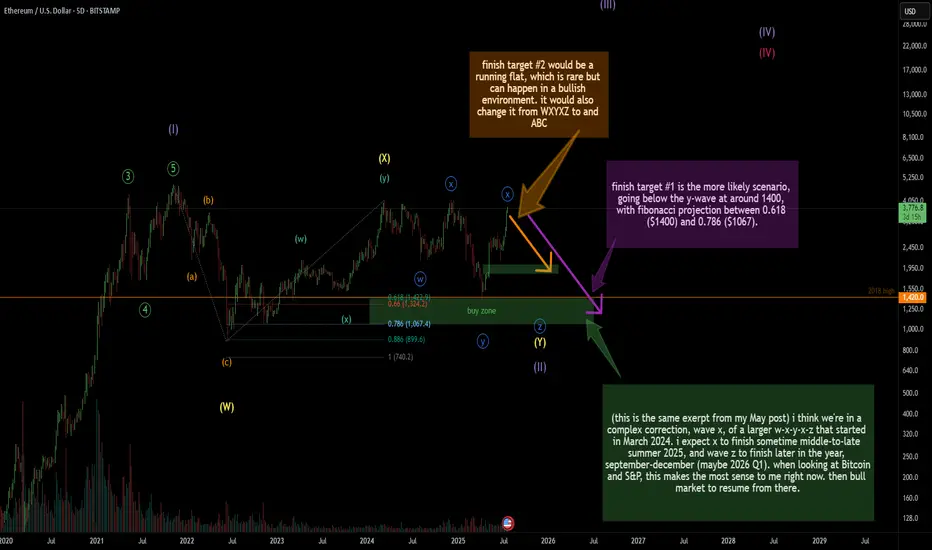
MTF bearish macro outlook on Ethereum, wave X finishedMini altcoin season over? I think we are about to see a record high amount of liquidation within the next few months.
This is not going to sit well with a lot of people I suspect.. Even if the count is technically correct, I suspect many will not see it as probable.
This is a bias based on not just Elliott waves, but internals of S&P and NQ looking week despite crawling higher this past few days. Ethereum and even Bitcoin having massive open interest (OI). Each time Ethereum has reached close to 4k area (2024 March, May, Dec, 2025 July), OI has increased significantly with high-ish positive funding rate. Almost all indicators for Bitcoin are red hot with bearish divergences. Momentum has stalled. Sentiment is ridiculously bullish.. after Bitcoin has had a 8x?
Having said that, from the last post, I was expecting somewhere around 3500-3600 region to finish the X wave. 1400 to 1800 run is impressive. But, so were the S&P, NQ, Bitcoin, and gold. I still see the recent April to July run as a 3-wave in Ethereum.
Invalidation is simple: it needs to break 4k. That would mean there are multiple 1-2's stacked in the April-to-July run..
I see 1900 as a very strong level. I suspect that's not the final destination but I expect to see a good reaction/bounce from that area. My primary target is just below 1400, the April 2025 low. Anywhere between around 1050 and 1400 should suffice, forming a massive running flat as a corrective wave 2 since 2022.
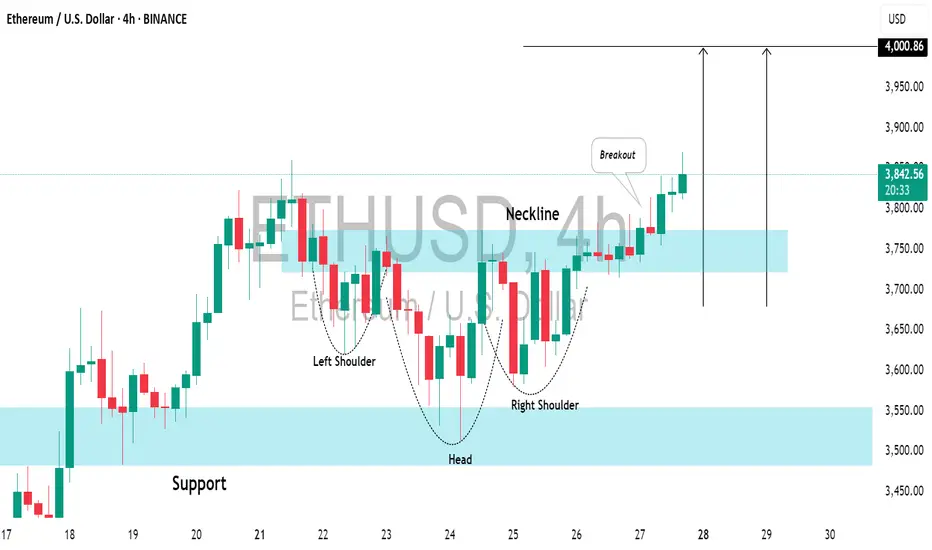
ETHEREUM (ETHUSD): Bullish Move After BreakoutIt looks like Ethereum has completed its bearish correctional movement.
Analyzing the price movement on a 4H timeframe, the market formed an inverted head and shoulders pattern on a retest of a horizontal support.
The neckline of this pattern is broken, which suggests a strong likelihood of a bullish trend resuming, with the price expected to reach the psychological level of 4000 soon.
20:1 R:R setup for Ethereum.The train is about to leave the station if BTC breaks above 120K. This setup offers a favorable risk for a 20:1 R:R.
Entry: 3,750
Stop-loss: 3,580
Target: 7,000
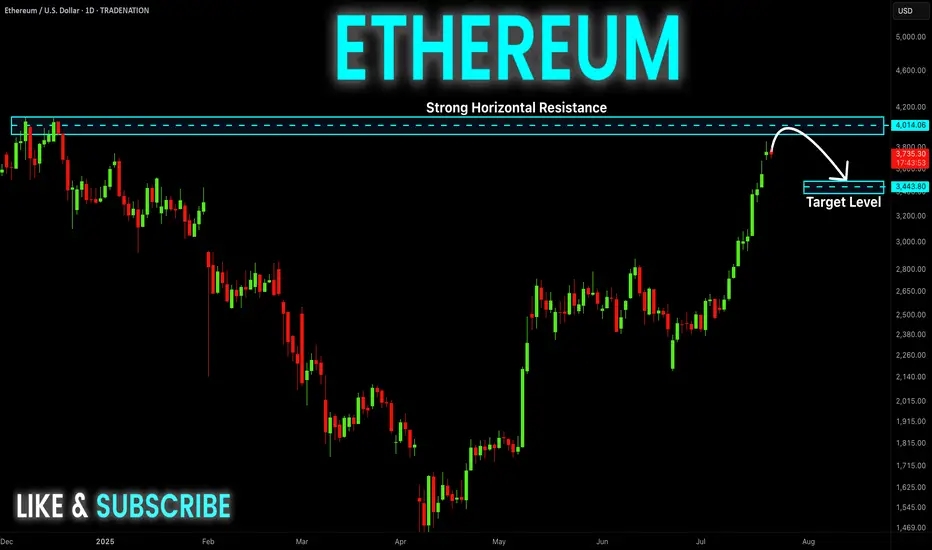
ETHEREUM Resistance Ahead! Sell!
Hello,Traders!
ETHEREUM is trading in a strong
Uptrend and the coin has grown
By more than 70% since the last low
So the coin is locally overbought
And after it retest the horizontal
Resistance of 4100$ we will be
Expecting a local bearish correction
Sell!
Comment and subscribe to help us grow!
Check out other forecasts below too!
Disclosure: I am part of Trade Nation's Influencer program and receive a monthly fee for using their TradingView charts in my analysis.
ETHUSD Long Setup: Targeting $4,000 After Bullish Reversal from ETH just swept the previous lows near $3,650–$3,700, clearing liquidity and flipping that zone into fresh support. This classic price action move often precedes expansion, and ETH looks primed for a continuation toward $4,000 in the coming sessions.
🧠 Technical Analysis
Previous Highs Swept: ETH took out the prior highs around $3,650–$3,700, trapping late shorts and grabbing liquidity.
Break of Structure: We've seen a clear bullish market structure form on the 4H and daily TFs, with higher highs and higher lows intact.
Support Zones:
$3,650–$3,700 (former resistance, now flipped support)
$3,550 (consolidation base before breakout)
Resistance Zones:
$3,950–$4,000 (psychological level + previous 2024 highs)
$4,100+ (weekly imbalance and potential extension zone)
Now that ETH has cleared short-term liquidity and confirmed demand on the retest, the path of least resistance appears to be up.
🔍 Fundamental Outlook
ETH ETF Narrative: Market anticipation for spot ETH ETF approval is heating up, boosting demand and institutional interest.
Reduced Sell Pressure: With the Shanghai upgrade long behind us, staking continues to increase, reducing circulating supply.
Macro Tailwinds: Risk-on sentiment in the broader market is aiding crypto momentum, especially for large-cap assets like ETH.
🎯 Target: $4,000
📉 Invalidated Below: $3,550 (if reclaimed by bears, invalidates bullish thesis)

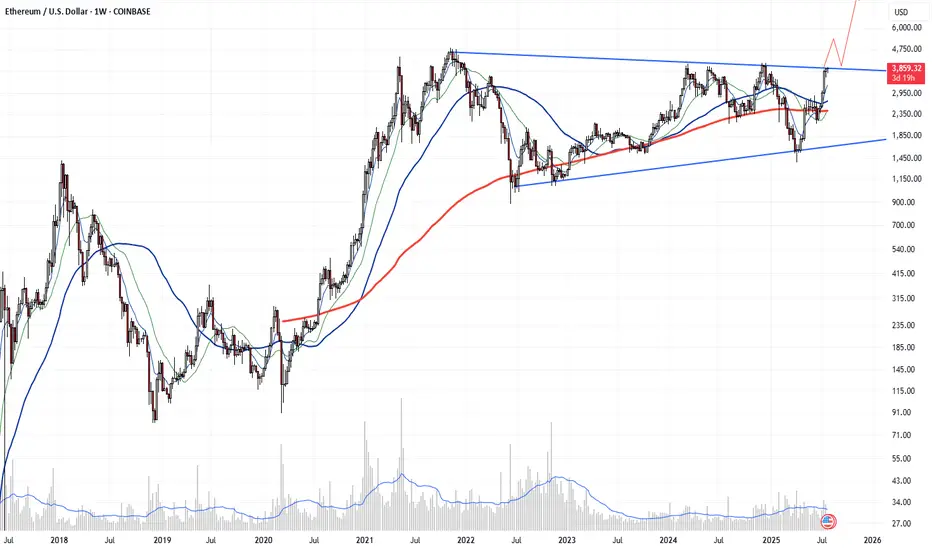
ALT season is here - this is huge, hugeETH is in an enormous symmetrical triangle on the weekly chart and its crossing upper line.
If the week finishes above 4000, nobody can stop this. Running to 6000 without stopping is almost certain.
After it needs to relax and the alt season will explode. This seems to be just a new life opportunity.
Ethereum Eyes $8K After Bullish BreakoutEthereum (ETH) is setting up for a powerful move. After hitting a multi-month high last week, ETH pulled back into a higher-low formation—strengthening the newly established bullish trend.
Money flow is shifting: with recent crypto legislation, Ethereum is now benefiting even more than Bitcoin, marking a notable change in market dynamics.
📈 Technical Highlights:
✅ Short-term target: $4,800–$5,000 (new all-time highs)
✅ Long-term potential: $7,000–$8,000
🛡️ Key support: $2,800–$3,000 (bullish as long as this holds)
📣 Takeaway:
Ethereum’s trend is firmly bullish. As long as support holds, pullbacks could offer strong entry opportunities for both swing traders and long-term investors.
#Ethereum #ETHUSD #Crypto #Trading #TechnicalAnalysis #CryptoTrading #EthereumPrice #Altcoins #Bullish #Breakout

Ethereum Long: Using Log Chart to Analyze, Target $6600In this video, I go through the analysis using the log chart for Ethereum and shows the potential of this cryptocurrency where I expect the price to reach new high in the coming days with a longer-term target of $6600.
For shorter-term trading, I recommend placing the stop a distance below recent support on the daily chart, around $3372.
Good luck!


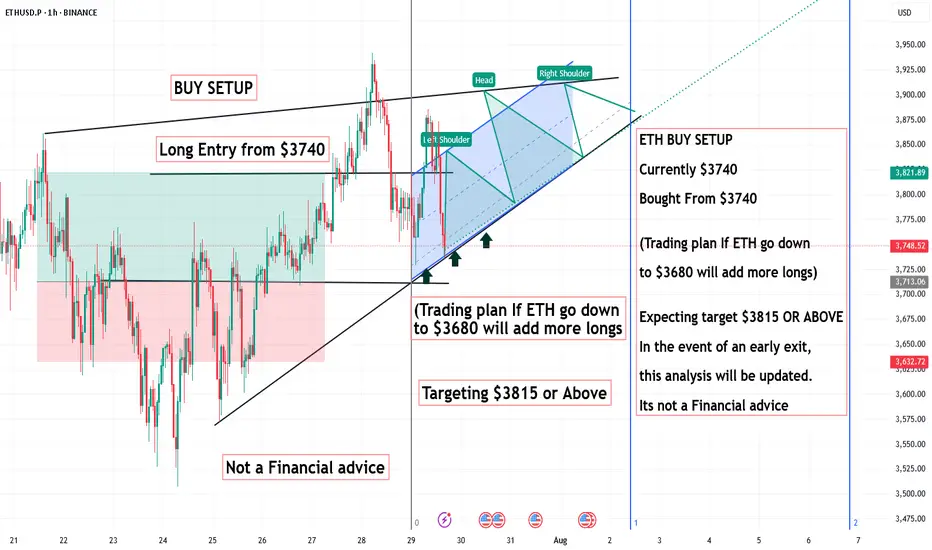
ETH BUY SETUP ,Bought From $3740ETH BUY SETUP
Currently $3740
Bought From $3740
(Trading plan If ETH go down
to $3680 will add more longs)
Expecting target $3815 OR ABOVE
In the event of an early exit,
this analysis will be updated.
Its not a Financial advice
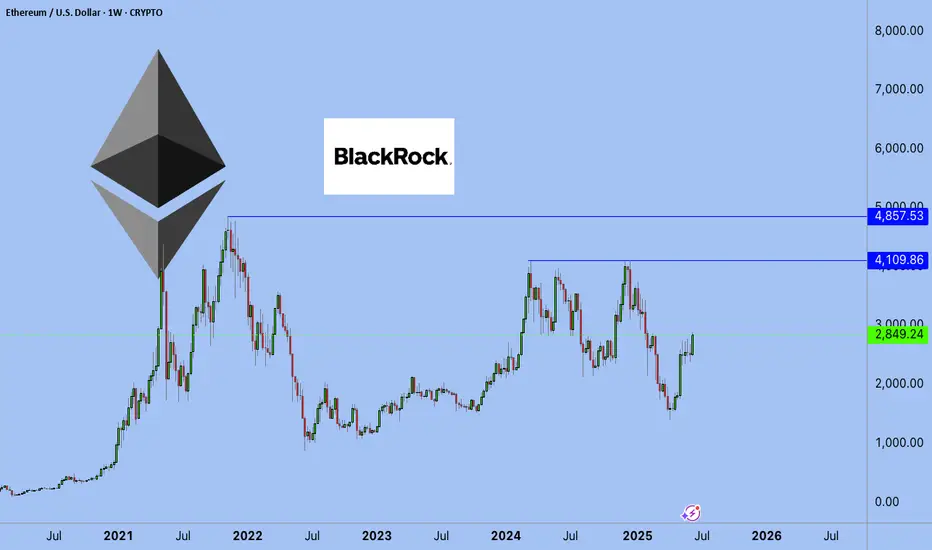
ETHEREUM: THE NEW BOND OF THE DIGITAL WORLDPrice isn’t the goal. Price is the side effect.
Meanwhile, BlackRock - a black hole with a trust-backed logo - just absorbed 42,000 ETH more.
Yesterday, you may have read this "regular" headline:
BlackRock increases its Ethereum exposure to $4 billion, adding $109.5 million via ETFs.
But here’s what you missed: there are no random numbers on the market.
When a player like this moves - it’s not hype. It’s a blueprint for the future.
Ethereum is no longer an altcoin.
It’s no longer speculation. It’s a financial infrastructure, already recognized by law, exchanges, and institutions.
What does this mean?
💡 Ethereum is now a digital bond - with yield flowing from blocks.
Profit is no longer built on promises, but on the structure of the chain itself.
Trust lies not in faces, but in code.
Growth is not artificial — it’s architectural.
And here’s why this is terrifyingly beautiful:
While you sleep, they are building an era.
Each ETF purchase removes ETH from circulation - permanently. Because:
✅ This ETH is gone from the open market
✅ It won’t be panic-sold
✅ It becomes income-bearing collateral, not a speculative asset
Still waiting for an entry signal?
The big players are already in.
This is no longer crypto - this is cash flow infrastructure, embedded into the digital economy.
And when pension funds, insurers, and sovereign investors move into Ethereum - they will come via ETFs.
Not because it’s trendy, but because it’s regulated, stable, and profitable.
📉 When institutional demand meets vanishing supply - the price won’t simply rise. It will explode, not as growth, but as a structural liquidity shift.
Ethereum is:
💸 Staking = passive yield
🔗 Backbone of DeFi
🖼 Fuel for NFTs
⚙️ Millions of transactions per second
⚖️ A regulated ETF asset
This is the new digital bond system, where the bet isn’t on the dollar - it’s on ETH as an income-producing asset.
💥 While you're reading this, the game is already on.
ETFs are rewriting the rules of time-ownership.
No hype. Just filings. Just intention.
Best regards EXCAVO
Ethereum the HIGHEST MONTHLY CANDLEEthereum is closing its highest monthly candle since 2021, signaling very bullish months ahead, with $8,000 as the resistance.
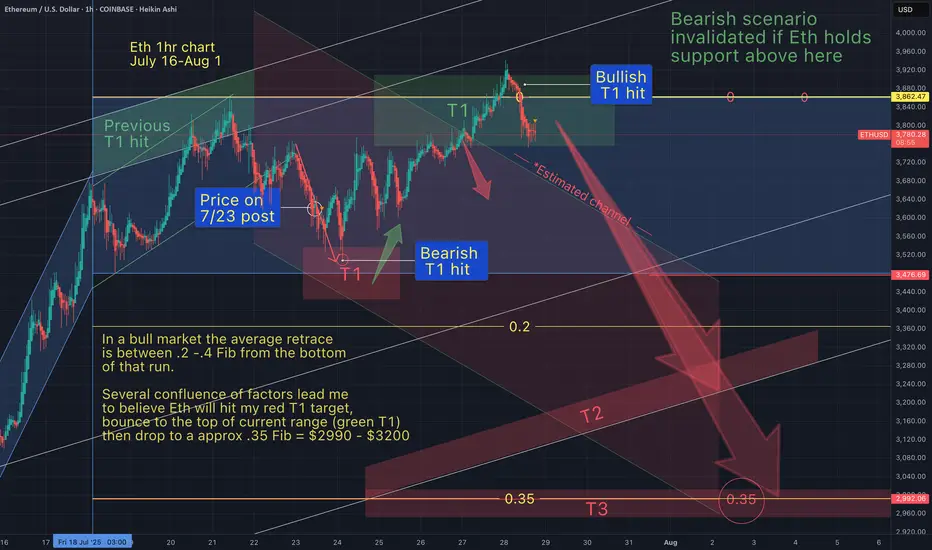
Eth next bottom (T2)As anticipated, my bearish T1 target (red) was hit soon after I first posted this chart on July 23rd 2025.
As the arrow indicated, Eth would bounce from my bearish T1 (red) to my bullish T1 (green). This has been confirmed in both price and in the timeframe indicated by my boxes.
There was also a downward arrow from my green T1 pointing towards my bearish T2 (red). Eth is already retracing from my top target, and I belive it will now continue down the red channel towards T2 and possibly T3 (between $2990 - $3200)
YOU ARE NOT BULLISH ENOUGH ON ETHEREUM! ethereum linear chart 3m timeframe major resistance level breakout occurred. if it continues to maintain the current area in the coming period, the major will continue to rise

$ETH MAJOR FALLING TREND BREAKOUT!CRYPTOCAP:ETH MAJOR FALLING TREND BREAK AND RETEST COMPLETE.
Eth season seems to be just around the corner
MORE TO COME