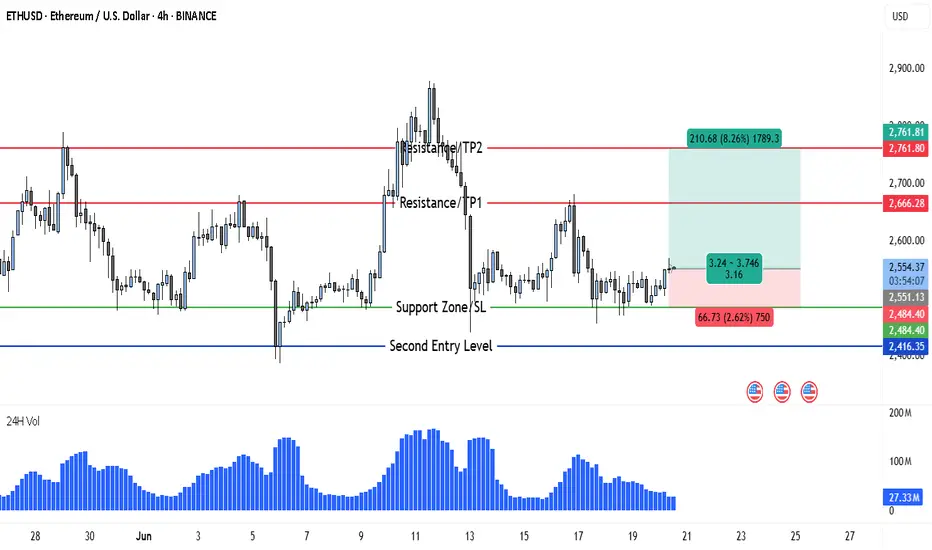
ETH Gears Up for 8% Rally After Holding Key Support at $2,484Ethereum (ETH) is currently positioning itself for a potential bullish breakout on the 4-hour chart. After facing a period of mid-June consolidation and volatility, ETH has stabilized above the key support zone at $2,484–$2,551, which previously served as a strong reaction level. This range has now been retested successfully, and price action suggests growing bullish pressure.
At present, ETH is trading around $2,552, holding just above the defined support, which has acted as both a psychological and technical base. The past few candles show reduced selling momentum and a pattern of accumulation that often precedes a breakout. Buyers are stepping in at higher lows, and this shift in structure could signal the beginning of a new leg upward.
The overall setup suggests that Ethereum is now in a classic breakout-retest formation. Volume, while still moderate, has started to pick up slightly, which strengthens the case for a continuation toward the upper resistance zones. The resistance lines at $2,666 and $2,761 represent short- and mid-term upside targets, both previously tested levels where price struggled to close above. If ETH manages to break past $2,666 cleanly, a move to $2,761 becomes increasingly likely.
🔹 Trade Idea (Buy Setup)
• Entry Point: Around $2,552
• Stop Loss: $2,484 (placed just below the major support zone and recent reaction low)
• Target 1 (TP1): $2,666
• Target 2 (TP2): $2,761
• Risk-to-Reward Ratio: ~1:3.16
• Upside Potential: 8.26%
• Downside Risk: 2.62%
This trade setup provides a high-probability long opportunity, with a clearly defined support zone backing the entry. The stop loss at $2,484 gives the trade sufficient breathing room while minimizing downside risk in case of short-term volatility.
There is also a second entry opportunity defined at $2,416, should the market dip unexpectedly before continuing upward. However, this entry is more aggressive and should be approached with flexible risk management — the stop loss for this reentry point is not fixed and should be adjusted as per the trader’s individual risk appetite.
What further strengthens the bullish case is that this reentry zone aligns closely with a historical swing low that previously triggered a strong bullish reversal. If price tests this level again, it may offer a last-chance opportunity for buyers before a larger move unfolds.
The double target strategy — TP1 at $2,666 and TP2 at $2,761 — reflects realistic profit zones based on past price structure and market behavior. Both targets lie within resistance levels that saw significant reaction in recent trading sessions, making them ideal zones for partial or full profit-taking depending on price momentum.
In the broader context, despite ETH’s recent 10% drop, the asset’s ability to hold above the $2,480–$2,500 region demonstrates resilience. This range now acts as a solid foundation from which bulls could initiate a breakout, especially if macro conditions (like BTC strength or positive ETH-related news) align in coming days.
In summary, Ethereum presents a clean long setup from $2,552 with targets up to $2,761, backed by technical support, improving volume, and a bullish price structure. A secondary entry is available at $2,416 for those with higher risk tolerance. If momentum builds above $2,600, ETH could rapidly revisit prior swing highs — and this chart structure makes a compelling case for being prepared ahead of that move.
ETHUSD trade ideas
The Crypto PlayHello traders,
Beautiful PA shaping up on BTC, ETH and XRP.
Looking for short term sells into the buys.
Explained my thesis in the video.
Stay sharp chads and stay safe!
Onwards
CRYPTO:ETHUSD
CRYPTO:BTCUSD
CRYPTO:XRPUSD

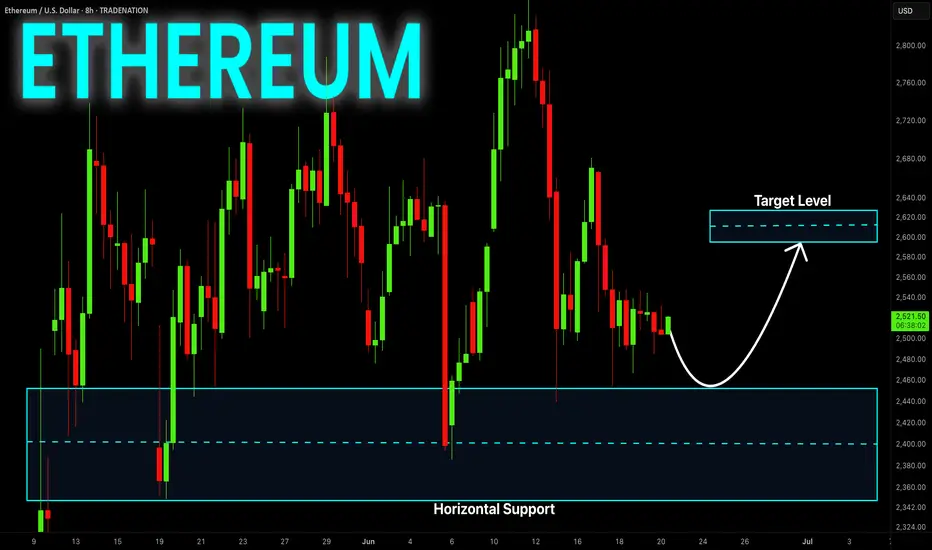
ETHEREUM Risky Long! Buy!
Hello,Traders!
ETHEREUM is consolidating
Above the horizontal support
Area around 2360$ and we
Are already seeing a local
Rebound from the level
So as we are bullish biased
A further price growth
Is to be expected
Buy!
Comment and subscribe to help us grow!
Check out other forecasts below too!
Disclosure: I am part of Trade Nation's Influencer program and receive a monthly fee for using their TradingView charts in my analysis.
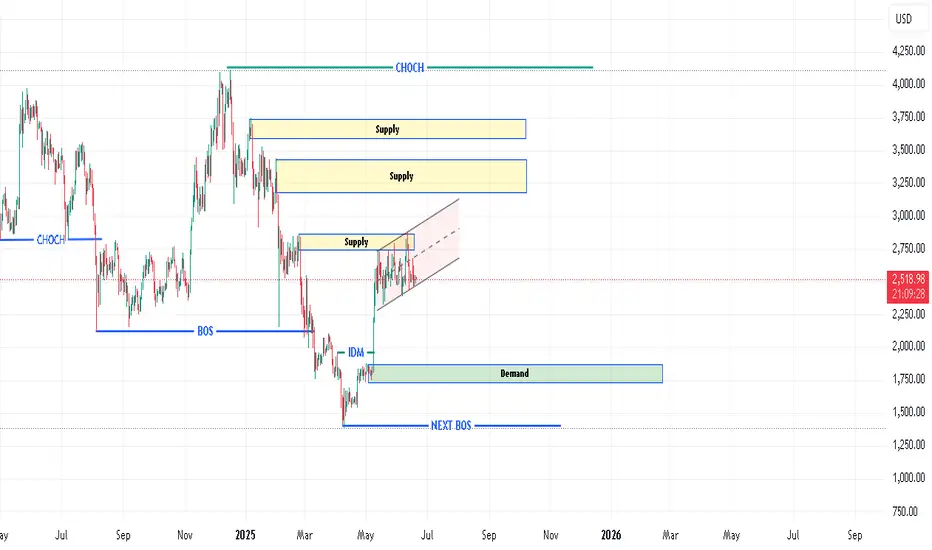
ETH SMC perspectiveDaily SMC is Sell (IDM Taken) , but there is fresh supply above( You are a buyer or seller ? ) hehe
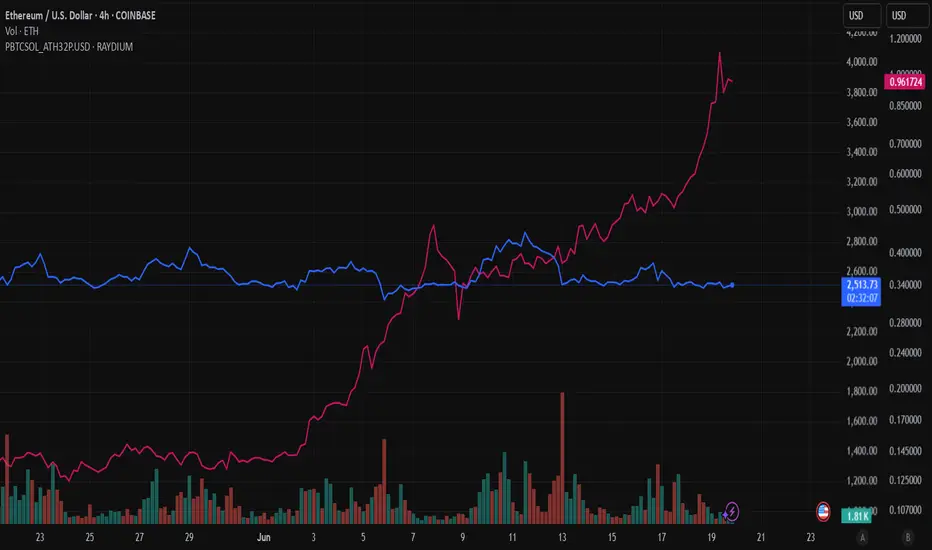
PBTC vs ETHA visual comparison of Purple Bitcoin (PBTC) and Ethereum (ETH) trends, powered by the Purple Bitcoin Compare Bot.
Detailed technical analysis of the ETH/USD chart🧭 General Context (1D, Long-Term):
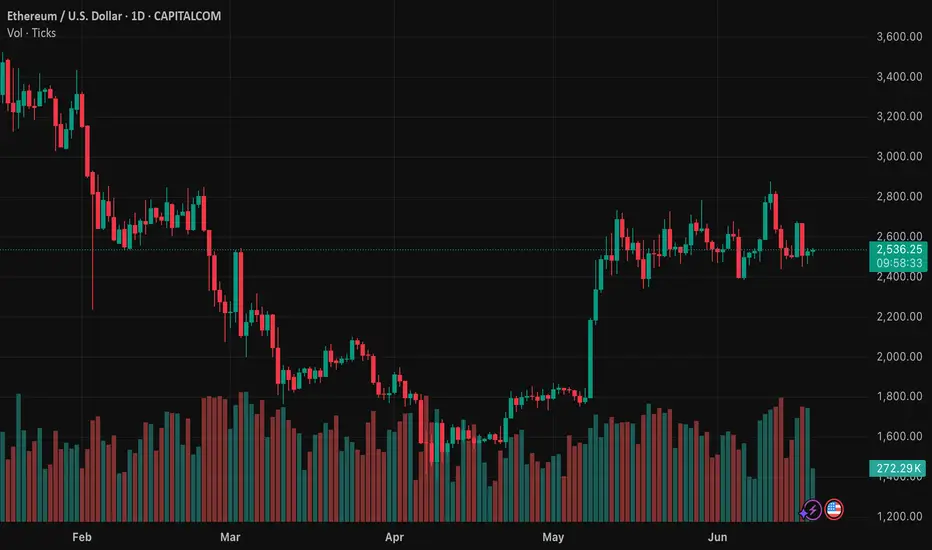
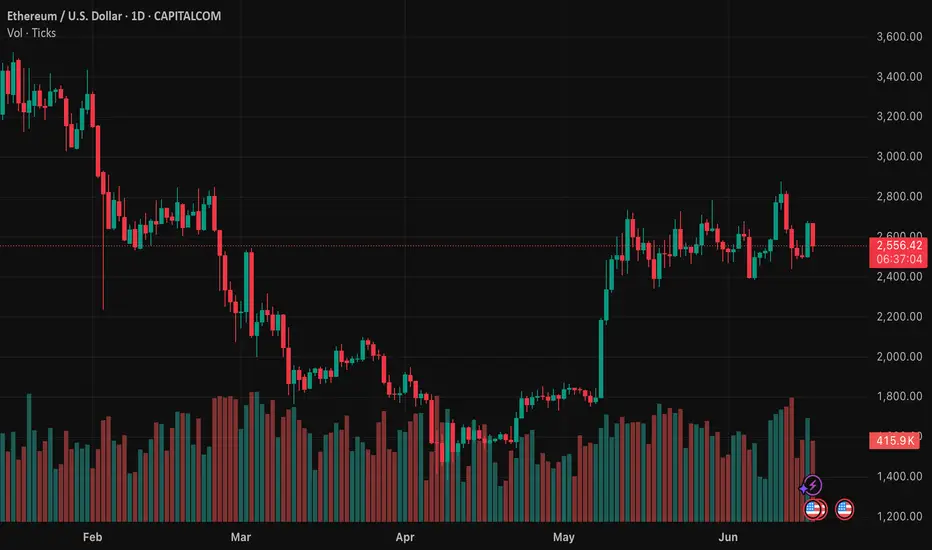
The chart covers the period from approximately September 2023 to June 2025.
ETH/USD has gone through a complete cycle: growth → decline → correction → potential consolidation/accumulation.
🔹 Market Structure (Price Action)
🔸 Trends:
November 2023 – March 2024: strong uptrend, ETH reaches highs around $4,000+
March 2024 – February 2025: clear downtrend ending with a local low around $1,600
February 2025 – May 2025: dynamic rebound – probable trend change (new higher low + higher high)
May – June 2025: currently consolidating between ~$2,400–2,800
📉 Key Support and Resistance Levels
Type Level Notes
🔴 Resistance ~2,800 – 2,900 Local high, many candles with shadows rejected from above
🟡 Resistance ~3,200 – 3,400 Beginning of strong declines from 2024
🟢 Support ~2,300 – 2,400 Local lows in June 2025
🟢 Strong support ~1,600 – 1,800 Final market low of March 2025 (possible accumulation phase)
📊 Technical indicators
✅ Stochastic RSI (at the bottom of the chart):
Currently in the oversold zone (~0–20) → may signal a potential bottom / buying opportunity
Red-blue lines are starting to wrap upwards → possible rebound
Recent crossovers of the indicator corresponded to local price movements
🔍 Technical formations
⚠️ Possible formations:
Double Bottom: February–March 2025 → classic trend reversal formation
Rising Channel: from March 2025 to present – prices are moving in a slightly rising channel
Current consolidation may be a bull flag (continuation after the increase)
📌 Summary – scenarios
🟢 Bullish scenario:
Breakout of resistance ~2,800 → possible test of levels 3,200 – 3,400 USD
Confirmation of a higher low → continuation of the uptrend
Stochastic RSI in the oversold zone → potential for an uptrend
🔴 Bearish scenario:
Drop below 2,300 USD → possible return to the area of 1,800–1,600 USD
Breakout of the structure of higher lows
Confirmation that the increase was only a correction
🧠 Final conclusions
Currently, ETH/USD is in a key decision zone: after a strong rebound, the market is resting.
Stochastic RSI suggests a potential upside impulse, but requires confirmation by a breakout of resistance.
For traders: 2,800 (resistance) and 2,300 (support) are worth watching.
For investors: 1,600–1,800 could be considered a long-term accumulation zone.

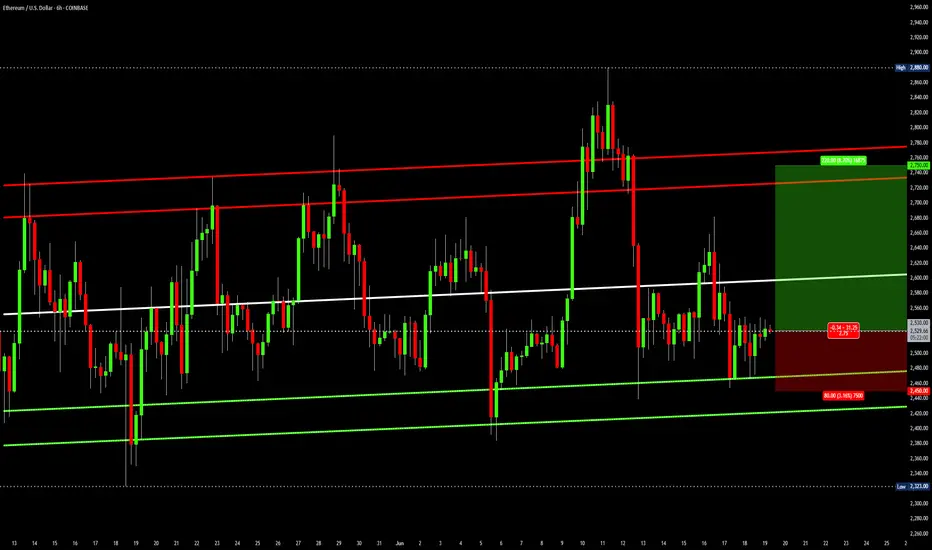
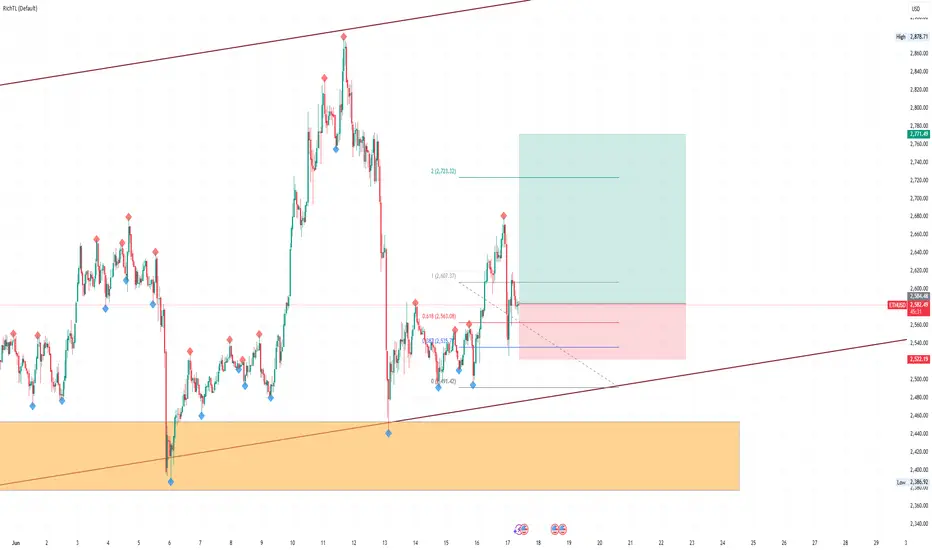
Ethereum channelThis is a straightforward analysis. Ethereum has been trading in an ascending parallel channel for 6 weeks now. As long as this pattern stays valid, ETH is a long at the bottom and short at the top of the channel, repeat. Round numbers support is 2450 and resistance is 2750.
Trade idea:
Long: 2530
Profit: 2750
Stop: 2450
ETHUSD is moving within the 2390.00 - 2880.00 range 👀 Possible scenario:
Ethereum dropped to $2,530, down 9.4% on the week, as market uncertainty weighs on momentum. Despite the pullback, over 35 million ETH (worth $89B) is now staked—an all-time high. While accumulation is surging too, with large wallets scooping up 800K+ ETH daily. On June 12 alone, whales bought 871K ETH—the biggest single-day haul this year. Ethereum’s liquid supply is shrinking as staking grows, aided by SEC guidance easing regulatory concerns. Lido, Coinbase, and Binance remain top staking providers.
The Pectra upgrade and Arbitrum’s ArbOS 40 rollout bring key enhancements like account abstraction and better L2 scaling. A golden cross is forming on ETH’s chart, but price remains under pressure amid geopolitical tensions.
✅Support and Resistance Levels
Support level is now located at 2,390.00.
Now, the resistance level is located at 2880.00.
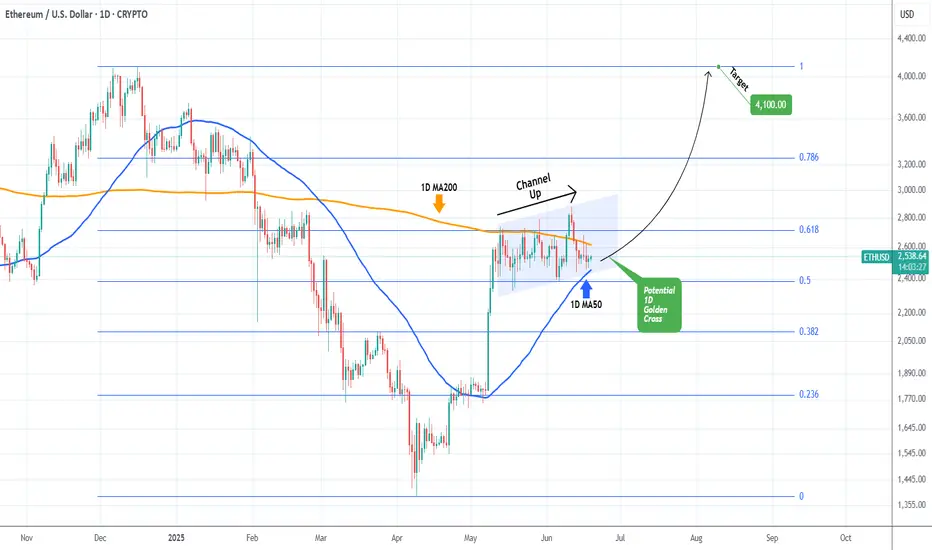
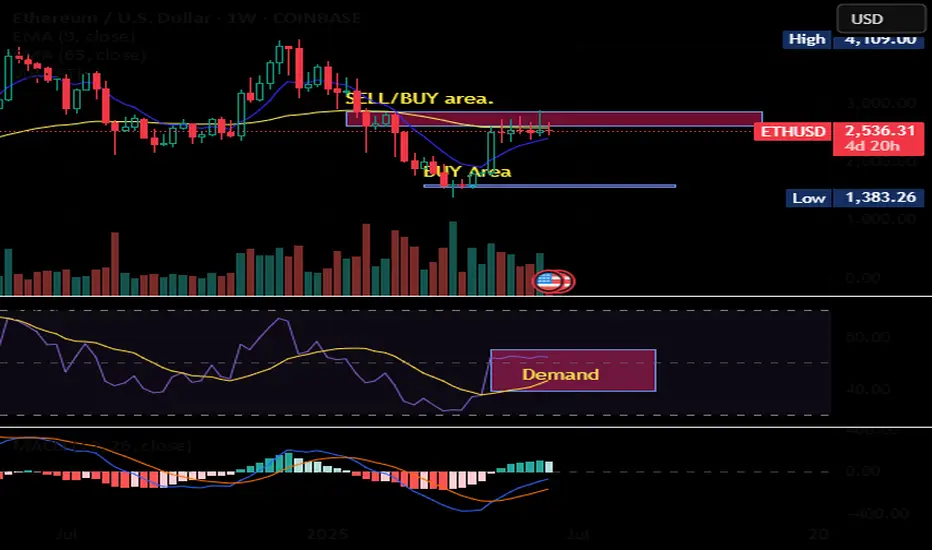
ETHEREUM Battling to hold its 1D MA50.Ethereum (ETHUSD) has been trading within a 5-week Channel Up pattern and in the past 2 days almost tested its 1D MA50 (blue trend-line). So far this is holding, showcasing the strong presence of buyers in that price region, which also happens to be the bottom of that Channel Up.
Ahead of a 1D Golden Cross that may potentially be formed in a week or so, this is the strongest buy signal we get since the April 09 bottom. Given also that the price is trading close to the 0.5 Fibonacci retracement level from the December 16 2024 High, the upside potential is significant. The obvious medium-term Target is that High at 4100.
-------------------------------------------------------------------------------
** Please LIKE 👍, FOLLOW ✅, SHARE 🙌 and COMMENT ✍ if you enjoy this idea! Also share your ideas and charts in the comments section below! This is best way to keep it relevant, support us, keep the content here free and allow the idea to reach as many people as possible. **
-------------------------------------------------------------------------------
💸💸💸💸💸💸
👇 👇 👇 👇 👇 👇
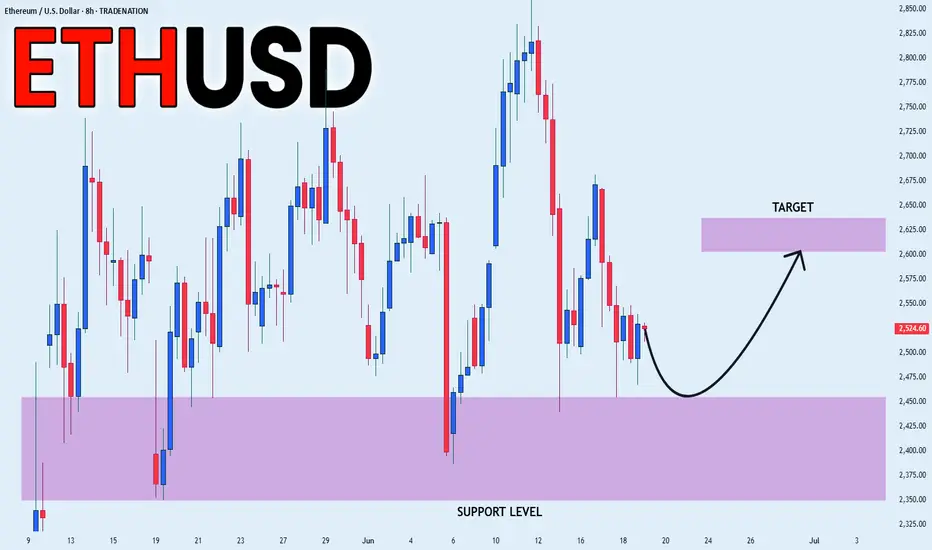
ETHEREUM LOCAL LONG|
✅ETHEREUM is going down now
But a strong support level is ahead at 2,375$
Thus I am expecting a rebound
And a move up towards the target of 2,600$
LONG🚀
✅Like and subscribe to never miss a new idea!✅
Disclosure: I am part of Trade Nation's Influencer program and receive a monthly fee for using their TradingView charts in my analysis.
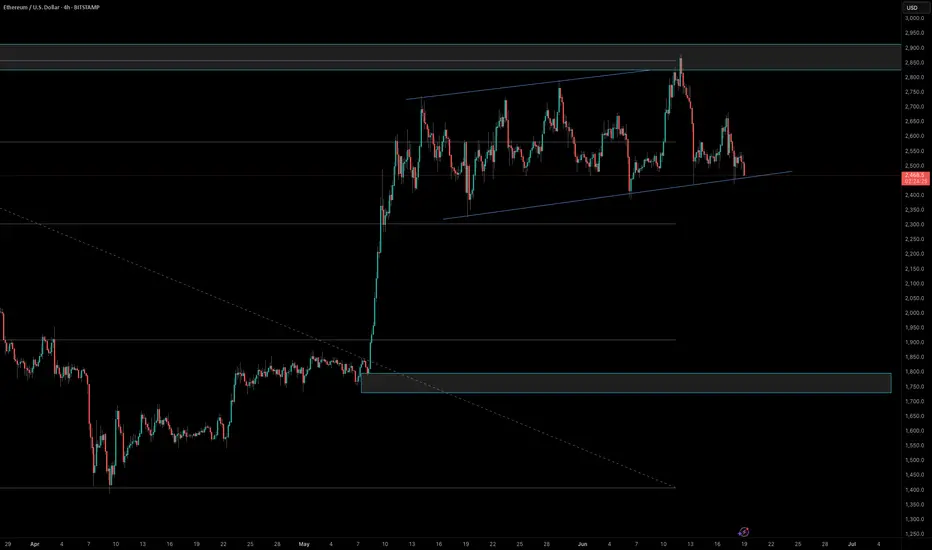
ETH is standing at the edge of the cliffCOINBASE:ETHUSD seems to have stalled between $2,400 and $2,800 without any clear fundamental reason, but from a technical perspective , the explanation is quite straightforward. After breaking down from a massive triangle pattern, ETH bounced back as if nothing had happened. However, the rally has hit a wall right at the former trendline, what used to be solid support is now acting as resistance.
This could be a sign that ETH’s upside momentum is running out. If the price breaks below $2,300 , it would likely confirm that the downtrend is just getting started and could leave ETH in a much weaker position.
Although the double top already played out and hit the 61.8% target (which might have led some to think the worst was over) there’s still a possible move toward the full 100% target, which sits just above $1,000, near the bottom edge of the triangle.
Putting fundamentals aside, this setup makes me lean heavily bearish on ETH if it drops below $2,300 . We are in front of a potential 50% decline in ETH, which is amazing specially if the risk that you are assuming is less than 5%.
On the other hand, if the price breaks above the previous trendline, it would open the door to a new, more bullish scenario with the price heading to 3.500$. Another way to play this, is by buying at 2.400$ area, and setting up a stop loss under 2.150$, the risk benefit is amazing again, so don't worry about the direction of ETH, be aware of the trading opportunities that is giving us in any direction!

ETHUSD Sell off is possible.Price tested valid resistance multiple times and formed an ascending channel.
Daily brake and close below this channel, consider its still under construction. Buy the dip!
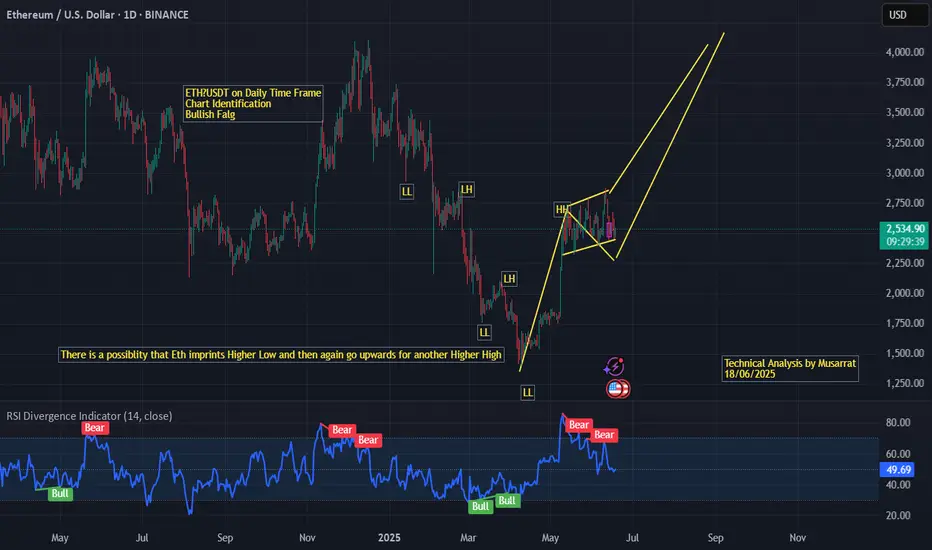
ETH/USDT Daily Timeframe – Bullish Flag Pattern IdentifiedThe chart shows Ethereum forming a bullish flag pattern after a strong upward rally, indicating potential continuation of the bullish trend. The recent price structure reflects a consolidation phase in a downward-sloping flag, following a significant impulsive move.
Key highlights:
The sequence of Higher Highs (HH) and Higher Lows (HL) suggests a shift in trend structure.
The current flag pattern aligns with the textbook characteristics of a bullish continuation setup.
RSI shows previous bullish divergence, supporting the case for upward momentum resumption.
🔸 Outlook: If ETH prints another higher low and breaks above the flag resistance, it may surge toward a new higher high in the $3,000–$3,500 zone.
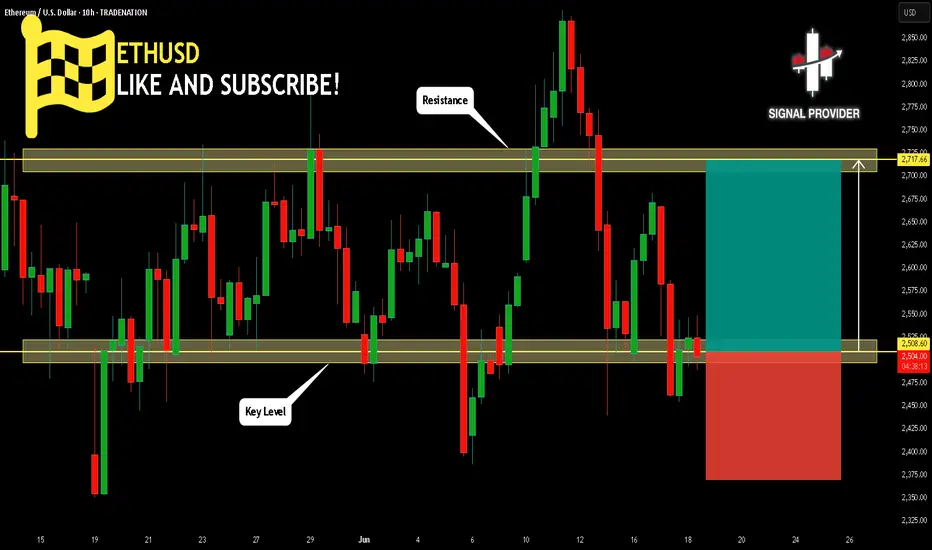
ETHUSD Is Very Bullish! Buy!
Take a look at our analysis for ETHUSD.
Time Frame: 10h
Current Trend: Bullish
Sentiment: Oversold (based on 7-period RSI)
Forecast: Bullish
The market is on a crucial zone of demand 2,508.60.
The oversold market condition in a combination with key structure gives us a relatively strong bullish signal with goal 2,717.66 level.
P.S
Please, note that an oversold/overbought condition can last for a long time, and therefore being oversold/overbought doesn't mean a price rally will come soon, or at all.
Disclosure: I am part of Trade Nation's Influencer program and receive a monthly fee for using their TradingView charts in my analysis.
Like and subscribe and comment my ideas if you enjoy them!
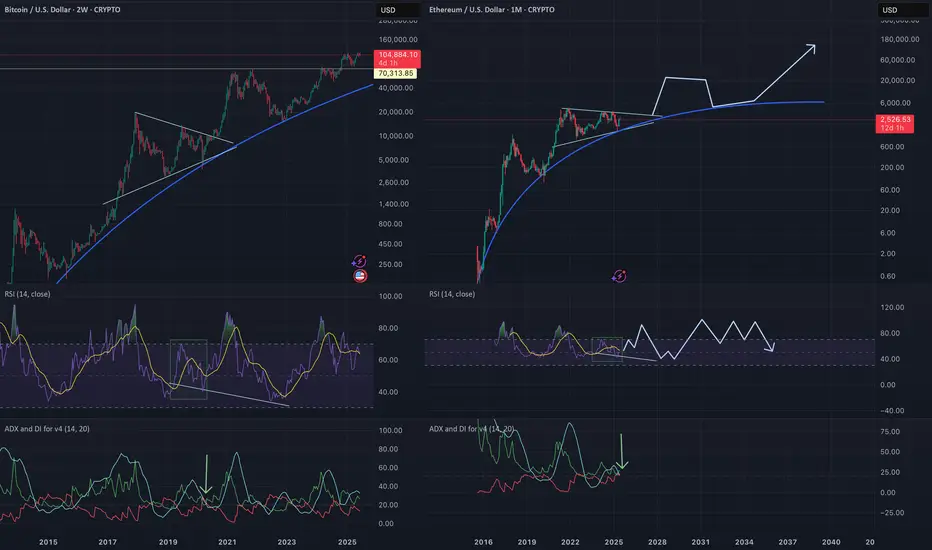
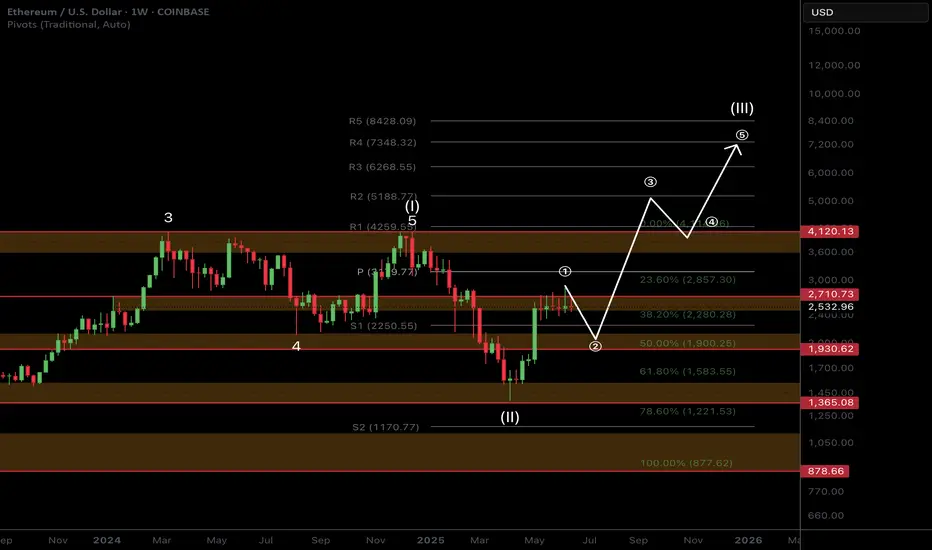
ETH Macro Analysis☕ 𝙂𝙈. CRYPTOCAP:ETH Macro analysis update...
📈 𝙇𝙤𝙣𝙜 𝙩𝙚𝙧𝙢 outlook remains unchanged and recent price action printing a doji. Target is still $7k for this cycle.
📉 𝙎𝙝𝙤𝙧𝙩 𝙩𝙚𝙧𝙢 outlook has investors looking lower towards the $1900 target but this isn't guaranteed to be reached and price action may front tat $2200.
War escalation's and retail selling are keeping price suppressed. ETF inflows and staking continue to grow!
The time for patience continues. Money is made in the sitting, weathering volatility, not flipping in and out of trades on every bit of news and price movement
𝙏𝙚𝙘𝙝𝙣𝙞𝙘𝙖𝙡 𝘼𝙣𝙖𝙡𝙮𝙨𝙞𝙨
Price is consolidating at its recent highs. Consolidation under resistance has high probability of breaking out, the longer it remains the higher the probability.
Elliot Wave (EW) analysis suggests a motif wave ended at the $2700 resistance, with a wave 2 retracement underway, likely a shallow one.
Safe trading
#ETH/USDT#ETH
The price is moving within a descending channel on the 1-hour frame, adhering well to it, and is heading toward a strong breakout and retest.
We are experiencing a rebound from the lower boundary of the descending channel, which is support at 2460.
We are experiencing a downtrend on the RSI indicator, which is about to break and retest, supporting the upward trend.
We are heading toward stability above the 100 moving average.
Entry price: 2540
First target: 2582
Second target: 2646
Third target: 2717

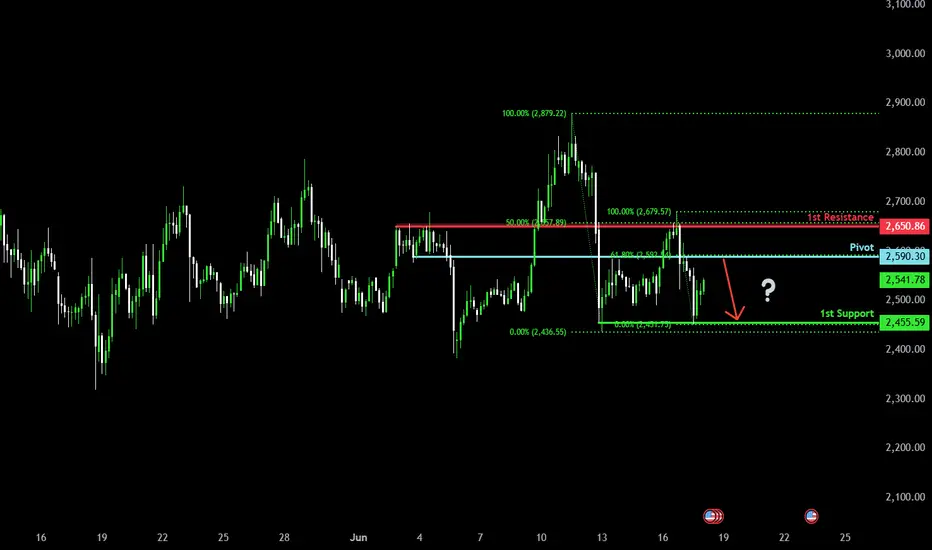
Potential bearish drop?Ethereum (ETH/USD) is rising towards the pivot and could reverse to the pullback support.
Pivot: 2,590.30
1st Support: 2,455.59
1st Resistance: 2,650.86
Risk Warning:
Trading Forex and CFDs carries a high level of risk to your capital and you should only trade with money you can afford to lose. Trading Forex and CFDs may not be suitable for all investors, so please ensure that you fully understand the risks involved and seek independent advice if necessary.
Disclaimer:
The above opinions given constitute general market commentary, and do not constitute the opinion or advice of IC Markets or any form of personal or investment advice.
Any opinions, news, research, analyses, prices, other information, or links to third-party sites contained on this website are provided on an "as-is" basis, are intended only to be informative, is not an advice nor a recommendation, nor research, or a record of our trading prices, or an offer of, or solicitation for a transaction in any financial instrument and thus should not be treated as such. The information provided does not involve any specific investment objectives, financial situation and needs of any specific person who may receive it. Please be aware, that past performance is not a reliable indicator of future performance and/or results. Past Performance or Forward-looking scenarios based upon the reasonable beliefs of the third-party provider are not a guarantee of future performance. Actual results may differ materially from those anticipated in forward-looking or past performance statements. IC Markets makes no representation or warranty and assumes no liability as to the accuracy or completeness of the information provided, nor any loss arising from any investment based on a recommendation, forecast or any information supplied by any third-party.
$ETHAs stablecoins gain real-world adoption, CRYPTOCAP:ETH demand might explode.
Why? Most stablecoins are backed or run on Ethereum.
People can spend stablecoins while keeping ETH locked not sold.
This creates real utility for ETH… and tightens its supply.
#Ethereum #ETH #Stablecoins #DeFi #Crypto
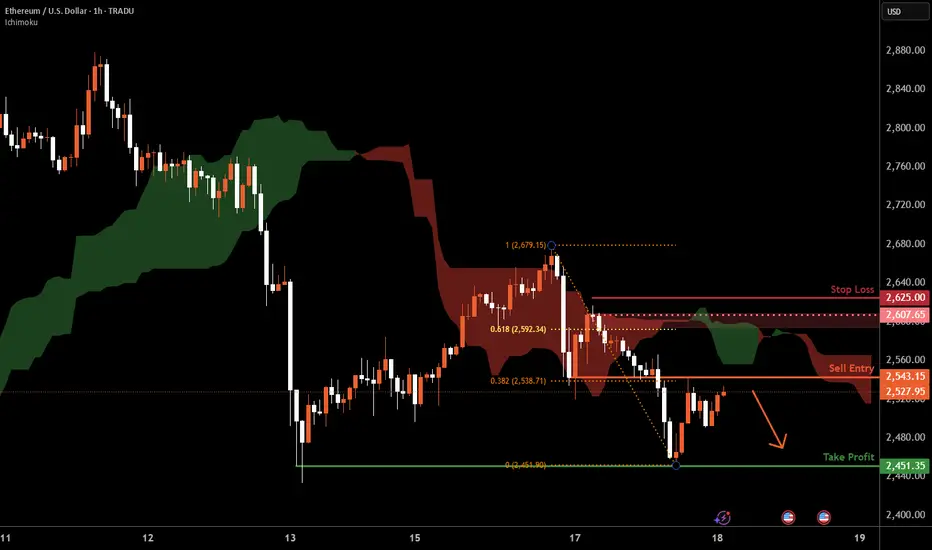
Ethereum H1 | Potential bearish reversalEthereum (ETH/USD) is rising towards a pullback resistance and could potentially reverse off this level to drop lower.
Sell entry is at 2,543.15 which is a pullback resistance that aligns with the 38.2% Fibonacci retracement.
Stop loss is at 2,625.00 which is a level that sits above the 61.8% Fibonacci retracement and a swing-high resistance.
Take profit is at 2,451.35 which is a multi-swing-low support.
High Risk Investment Warning
Trading Forex/CFDs on margin carries a high level of risk and may not be suitable for all investors. Leverage can work against you.
Stratos Markets Limited (tradu.com ):
CFDs are complex instruments and come with a high risk of losing money rapidly due to leverage. 63% of retail investor accounts lose money when trading CFDs with this provider. You should consider whether you understand how CFDs work and whether you can afford to take the high risk of losing your money.
Stratos Europe Ltd (tradu.com ):
CFDs are complex instruments and come with a high risk of losing money rapidly due to leverage. 63% of retail investor accounts lose money when trading CFDs with this provider. You should consider whether you understand how CFDs work and whether you can afford to take the high risk of losing your money.
Stratos Global LLC (tradu.com ):
Losses can exceed deposits.
Please be advised that the information presented on TradingView is provided to Tradu (‘Company’, ‘we’) by a third-party provider (‘TFA Global Pte Ltd’). Please be reminded that you are solely responsible for the trading decisions on your account. There is a very high degree of risk involved in trading. Any information and/or content is intended entirely for research, educational and informational purposes only and does not constitute investment or consultation advice or investment strategy. The information is not tailored to the investment needs of any specific person and therefore does not involve a consideration of any of the investment objectives, financial situation or needs of any viewer that may receive it. Kindly also note that past performance is not a reliable indicator of future results. Actual results may differ materially from those anticipated in forward-looking or past performance statements. We assume no liability as to the accuracy or completeness of any of the information and/or content provided herein and the Company cannot be held responsible for any omission, mistake nor for any loss or damage including without limitation to any loss of profit which may arise from reliance on any information supplied by TFA Global Pte Ltd.
The speaker(s) is neither an employee, agent nor representative of Tradu and is therefore acting independently. The opinions given are their own, constitute general market commentary, and do not constitute the opinion or advice of Tradu or any form of personal or investment advice. Tradu neither endorses nor guarantees offerings of third-party speakers, nor is Tradu responsible for the content, veracity or opinions of third-party speakers, presenters or participants.
ETHUSD is moving within the 2390.00 - 2880.00 range 👀 Possible scenario:
The crypto market fell on June 17, with only 10 of the top 100 coins in the green. Total market cap dropped 2.1% to $3.45T, while trading volume surged to $118B. Ethereum (ETH) slipped 1.7% to around $2,550, retreating from an intraday high of $2,672. ETH is now attempting to reclaim the $2,610 level.
Fundamentals remain strong: U.S. spot Ether ETFs continue to accumulate ETH, with BlackRock’s ETHA holding nearly $650M. Staking yields, tokenized real-world assets, and DeFi infrastructure are also driving momentum.
However, June has historically been bearish for ETH. Data from CryptoRank shows it’s Ethereum’s second-worst month on average, with only three green Junes in 10 years. Analysts warn a drop below $2,500 could send ETH to $2,000 — but many still expect a rally to $3,500–$6,000 in the long term.
✅Support and Resistance Levels
Support level is now located at 2,390.00.
Now, the resistance level is located at 2880.00.
ETH USD LONG!The price has been a trading in a channel on the 4hrs timeframe, and recently it traded on the lower bound of the channel and a reversal pattern is observed on the 1Hr timeframe.
Hence, the price is now expected to rise.
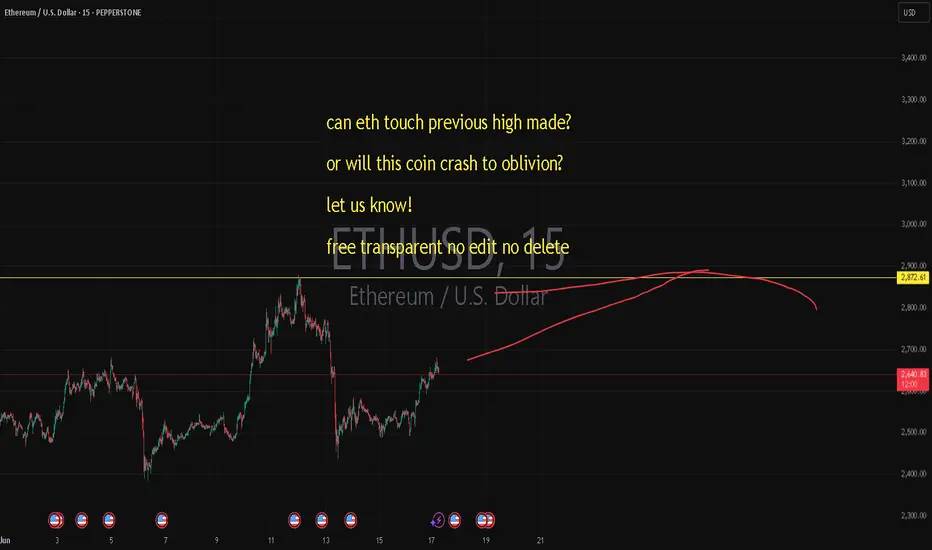
can eth touch previous high made? or will this coin crash?can eth touch previous high made?
or will this coin crash to oblivion?
let us know!
free transparent no edit no delete
🐉We value full transparency. All wins and fails fully publicized, zero edit, zero delete, zero fakes.🐉
🐉Check out our socials for some nice insights.🐉
information created and published doesn't constitute investment advice!
NOT financial advice