ETHUSD: Bearish Divergence + Double TopHi everyone!
Ethereum – Double Top with Bearish Divergence
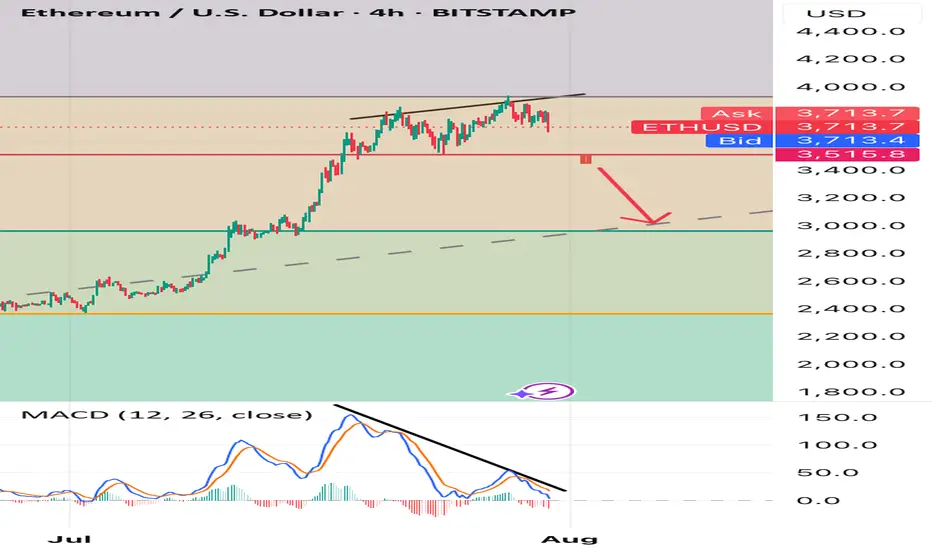
On the 4H chart, ETH is forming a clear double top while MACD prints a strong bearish divergence, signaling momentum loss.
📉 Neckline: $3,500 – this level acts as the key trigger.
🔻 Target: $3,000 – aligns with the 0.618 Fibonacci retracement and previous demand zone.
A confirmed break below $3,500 would validate the pattern and open the way to a deeper correction into the $3,000 area. As long as price stays under the second top, the bearish setup remains active.
ETHUSD trade ideas
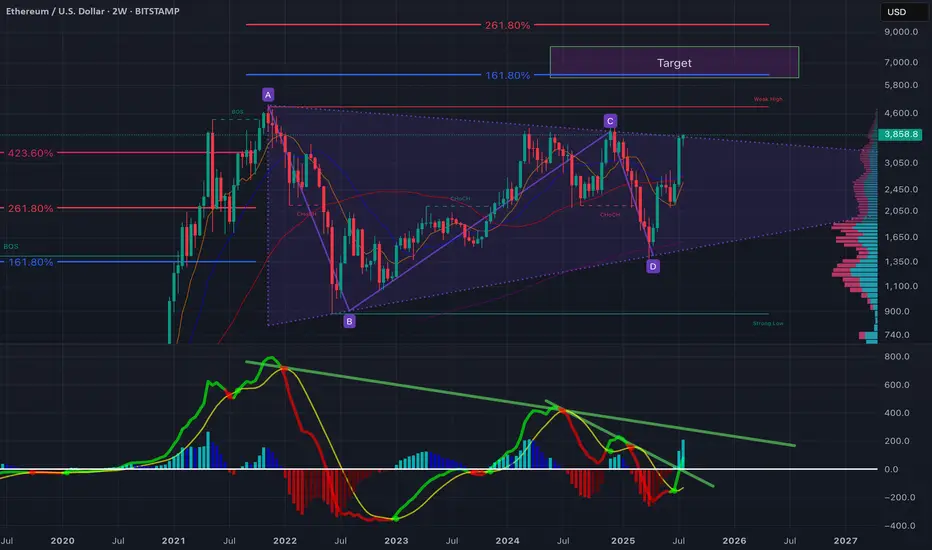
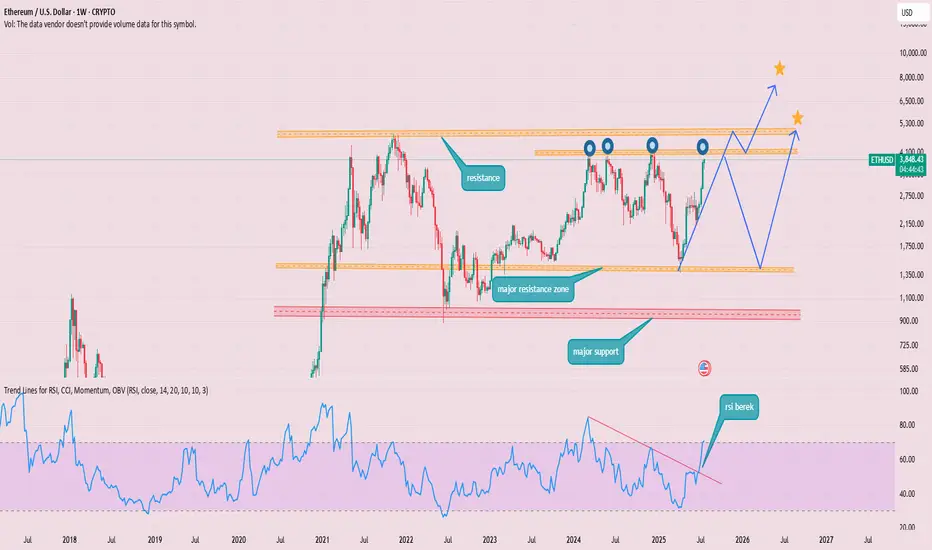
$ETH - Nothing has changedEthereum is showing a significant breakout setup after years of consolidation within a large symmetrical wedge structure (A–B–C–D pattern). The price has just tested the upper boundary of the wedge, and momentum indicators suggest a potential mid-term bullish continuation.
Key Observations:
ABCD Harmonic Structure: Price has respected the harmonic range with D forming a strong higher low near $1,500–$1,600, showing buyer absorption at key demand levels.
Fibonacci Confluence:
The 161.8% extension aligns with ~$5,800, forming the first major target.
A 261.8% extension pushes towards ~$7,000, aligning with the marked "Target" zone.
Volume Profile: Heavy accumulation between $1,500–$2,500 with low resistance above $4,000 suggests a breakout could accelerate quickly.
MACD/RSI Divergence: The momentum oscillator shows a triple bullish divergence (higher lows on momentum vs. lower lows on price), and the downtrend line on the MACD histogram has been broken—often a precursor to sustained upside.
Moving Averages: The 50/100 EMA crossover on the 2-week chart is imminent, historically a strong macro signal.
Bullish Scenario:
A clear close above $4,000 confirms wedge breakout.
Short-term targets: $4,600 (weak high) and $5,800 (Fib 161.8%).
Macro target: $7,000+ if bullish momentum holds through Q4.
Bearish Risk:
Failure to hold $3,500 could lead to retests of $2,500 or even $2,000 (mid-wedge support).
Watch for macroeconomic shocks (rate cuts, liquidity shifts) which have previously caused retracements in crypto markets.
What’s next?
ETH is approaching a make-or-break moment. If the breakout holds, this could be the start of the next major leg up. A strong weekly close above $4,000–$4,200 is critical for validation.
Strategic Long Position on Ethereum (ETH)
Ethereum's funding rates have spiked, reflecting an overcrowded long side. Such conditions often precede a long squeeze, as the market seeks to shake out overleveraged traders.
Despite this risk, the current bullish momentum justifies a tiered entry approach:
First Entry (Market Order): 3,790
Second Entry (Limit Order): 3,550
🛑 Stop Loss (for both entries): 3,400
🎯 Take Profit Target: 4,200
This setup allows participation in the upward trend while leaving room
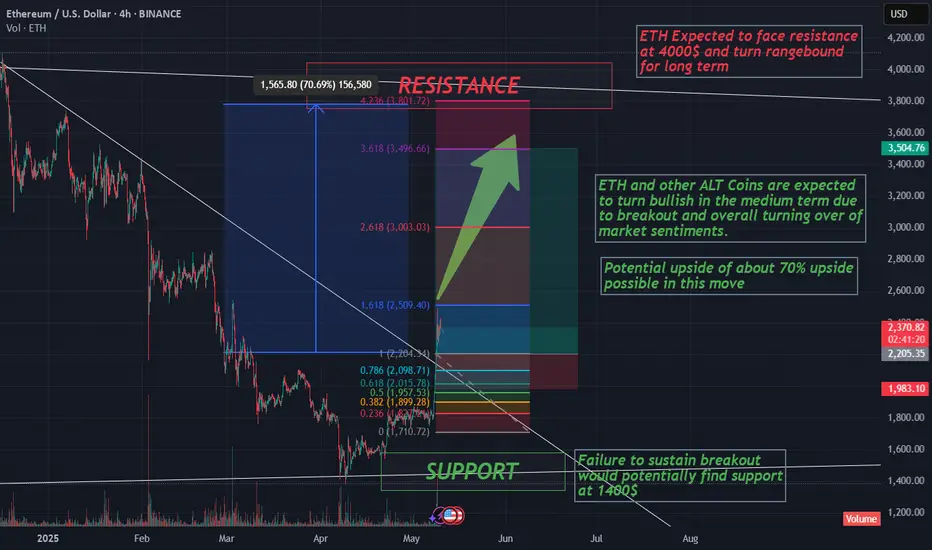
ETH Breakout and potential bullishness expected for a monthETH has broken out from downtrend and market sentiment has turned bullish overall. So it is expected to go up until it reaches 4000$ (70%) where a long term resistance is found.
Any further bullishness post 4000$ depends on future market conditions and price action at that point of time, as it is a long term resistance which would be more difficult to break.
Fibonacci retracement is used to find potential temporary selloffs in this up move. This move could potentially end the medium term bearish sentiments in ALT Coins.
Note: For educational purposes only. DYOR before investing or trading.
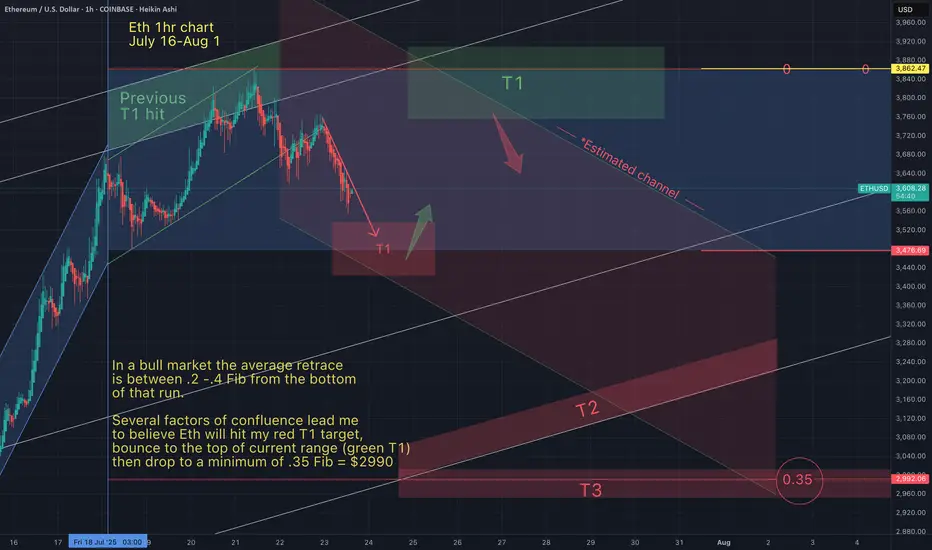
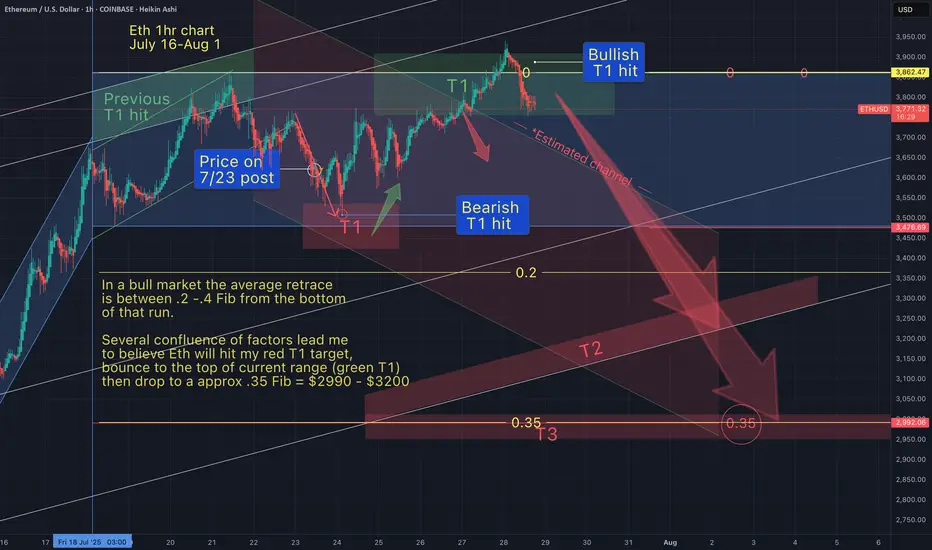
Eth next target (T2)As anticipated, my bearish T1 target (red) was hit soon after I first posted this chart on July 23rd 2025.
As the arrow indicated, Eth would bounce from my bearish T1 (red) to my bullish T1 (green). This has been confirmed in both price and in the timeframe indicated by my boxes.
There was also a downward arrow from my green T1 pointing towards my bearish T2 (red). Eth is already retracing from my top target, and I belive it will now continue down the red channel towards T2 and possibly T3 (between $2990 - $3200)
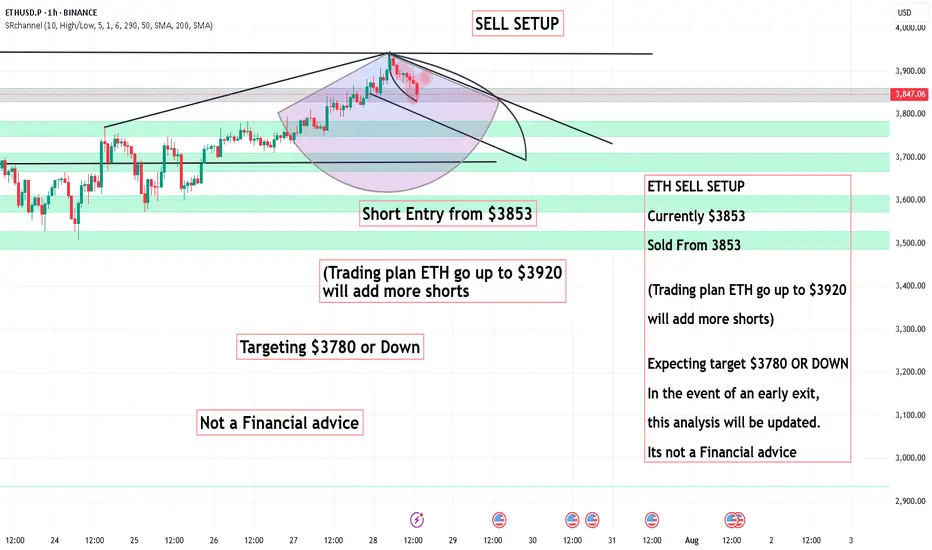
ETH SELL SETUP ,Sold From 3853ETH SELL SETUP
Currently $3853
Sold From 3853
(Trading plan ETH go up to $3920
will add more shorts)
Expecting target $3780 OR DOWN
In the event of an early exit,
this analysis will be updated.
Its not a Financial advice
DaxPrime: BlackRock Exec Move Signals SharpLink’s $1.3B ETH ShifIn a development that is drawing attention across both institutional finance and the crypto ecosystem, a senior executive from BlackRock’s digital assets division has transitioned to SharpLink Gaming — a rising Ethereum whale and sports betting infrastructure player now managing over $1.3 billion in ETH-based assets. At DaxPrime, we see this move not as an isolated career shift but as a strategic signal of deepening convergence between traditional asset management and Web3-native businesses.
The Move: From Wall Street to Web3 Execution
According to sources familiar with the matter, BlackRock’s former Head of Digital Asset Strategy, Daniel Wexler, is joining SharpLink Gaming as its Chief Digital Officer. Wexler played a critical role in shaping BlackRock's crypto ETF initiatives and oversaw early-stage partnerships with Ethereum ecosystem projects.
His transition comes at a time when SharpLink — originally focused on B2B sports betting technologies — has evolved into a key player in decentralized infrastructure, integrating smart contracts, Layer-2 analytics, and tokenized in-game markets. The company currently holds over $1.3 billion in Ethereum, making it one of the largest corporate ETH holders in the entertainment-tech sector.
DaxPrime’s View: Strategic Talent Realignment
At DaxPrime, we interpret this as more than just a personnel update. It reflects a broader realignment where institutional talent is gravitating toward firms that offer speed, flexibility, and a native role in the decentralized economy.
“The move illustrates a trend we’ve tracked since early 2024: legacy finance professionals are increasingly pivoting toward operational roles in Web3-native companies, particularly those with real assets and strong ETH exposure,” says Michaela Strobel, Senior Analyst at DaxPrime.
SharpLink’s use of Ethereum spans beyond treasury holdings. The firm is building proprietary smart contract infrastructure for real-time sports data feeds, NFT-linked fantasy games, and decentralized betting protocols — signaling a broader use-case than speculative ETH storage.
Ethereum as a Strategic Asset
Wexler’s decision also underscores Ethereum’s growing importance as a corporate strategic asset, not merely an investment vehicle. Ethereum’s programmable layer and widespread developer adoption make it the backbone of emerging digital business models — including SharpLink’s.
DaxPrime’s July 2025 ETH Treasury Index reveals that more than 18 publicly listed firms now hold over $500 million in Ethereum each, compared to just five a year ago. This uptick is particularly concentrated in sectors like digital media, AI-gaming convergence, and decentralized finance tooling.
“Ethereum’s shift from an investment to infrastructure asset is well underway,” Strobel notes. “Wexler’s move brings boardroom-grade credibility to a company operating deep within that transformation.”
What It Means for Investors
For investors, this move signals two critical developments:
Institutional Validation of Web3 Business Models: Wexler’s transition lends credence to firms building around Ethereum-based infrastructure, rather than just speculating on token prices.
New Pathways for ETH Utility: SharpLink’s planned integration of ETH staking, yield strategies, and decentralized oracles into its sports gaming vertical could set new standards for how consumer-facing platforms leverage blockchain.
DaxPrime’s Conclusion
The decision by a senior BlackRock executive to join an Ethereum-native company like SharpLink Gaming is not a one-off anomaly. It reflects a rapidly maturing industry where the center of gravity is shifting from financial speculation to operational integration.
At DaxPrime, we continue to monitor executive movements as a leading indicator of sector confidence and capital rotation. As Ethereum evolves from “store of value” to “platform for value,” such strategic appointments signal where the smart money is going — and what the next phase of crypto utility will look like.

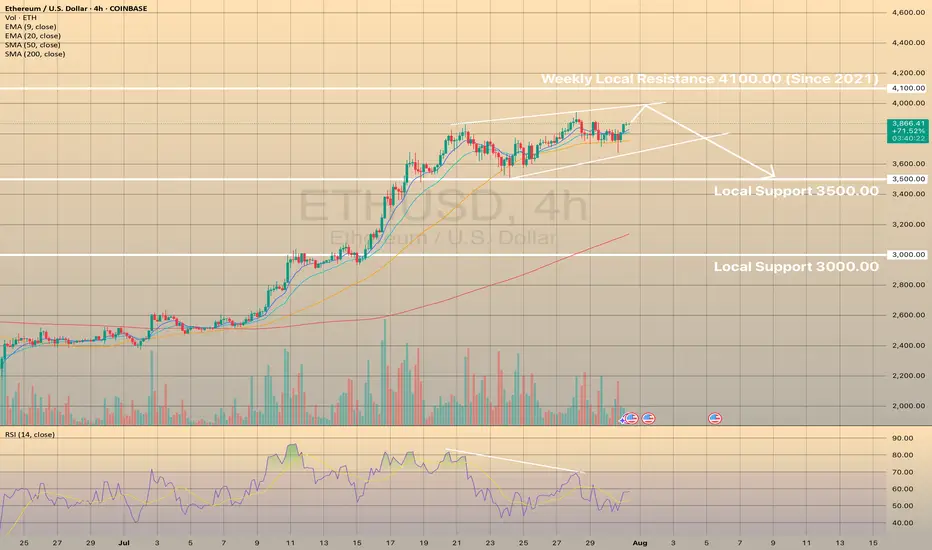
ETHUSD MAY FORM THE BEARISH WEDGE. THE PRICE IS GETTING READY TOETHUSD MAY FORM THE BEARISH WEDGE. THE PRICE IS GETTING READY TO DROP.
ETHUSD has been moving bullish since July 8. However since July 21 the price started to form the bearish wedge with bearish divergence on RSI on 4-h timeframe.
A bearish wedge is a bearish reversal pattern in an uptrend, where the price forms higher highs and higher lows within converging upward trendlines, signaling weakening bullish momentum and a potential downward reversal. To trade, identify the wedge with declining volume and confirm with RSI or divergence. Sell or short on a breakdown below the lower trendline with a volume spike. Set a stop-loss above the recent high or upper trendline. Target the wedge’s height projected downward from the breakdown or the next support level with a 1:2 risk-reward ratio.
We expect that the price will establish another bullish momentum and the price will go towards upper border of the wedge, slightly below the 4,100.00 resistance level and will decline towards 3,500.00 support level afterwards.
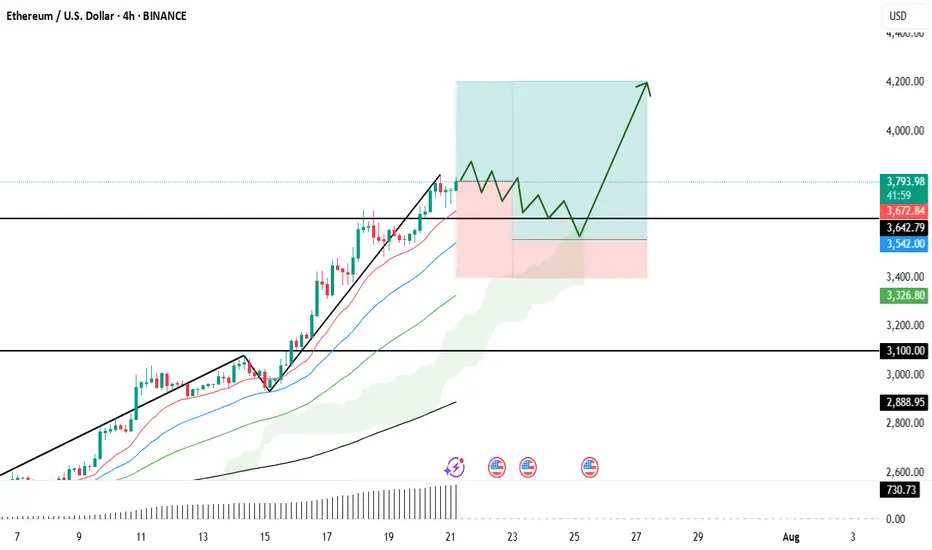
Continuous Bullish MovementETH has been rallying upward since 8th may 2025 and is expected to continue moving upwards past 3890.09 all the way to 4101.04 before a re accessing the potential move.
The main reason for this is because the price level of 4101.09 was first hit on march 11th 2024,the second touch(even being that there was one on 6th march and another on 16th forming an M formation) i chose to count it as one.
the third touch will be when price hits our interest level of 4101.09, thus either giving a sell signal or price will break through that level to the upside.

ETH ANALYSIS💲💲 #ETH is trading between support and resistance area. There is a potential rejection again from its resistance zone and pullback from support zone. If #ETH breaks the major resistance zone then we would see a bullish move
Ethereum Breakdown Imminent: Bearish Triple Tops confirmedEthereum has fired off multiple bearish signals that traders and investors cannot ignore. A confirmed triple top on the daily chart suggests exhaustion at resistance, while the appearance of a hanging man candlestick pattern adds weight to the reversal thesis.
The daily RSI has confirmed a bearish divergence, and the MACD has officially crossed below the zero line—marking a shift in momentum and confirming bearish control.
In this video, I’ll break down:
• The triple top formation and its implications
• Why the 200 EMA is the next major support target
• The significance of RSI and MACD confirmations
• What traders should watch for in the coming sessions
This isn’t just noise—Ethereum’s technicals are flashing red. Make sure you’re prepared.

Ethereum gains momentum: SEC green light and Banks ShiftEthereum gains momentum: SEC green light and JPMorgan’s historic shift
By Ion Jauregui – Analyst at ActivTrades
Ethereum once again takes center stage in financial markets after a week full of positive signals: on one hand, the long-awaited clarification of its regulatory status by the SEC; on the other, the unexpected opening of JPMorgan to cryptocurrencies. All this in a context of growing institutional interest and corporate adoption.
Washington clears the path: ETH is a commodity
The chairman of the SEC, Paul Atkins, has resolved one of the biggest uncertainties in the crypto ecosystem: Ethereum will not be treated as a security, but as a commodity. In other words, it falls outside the scope of the SEC’s strictest regulations and is placed on the same level as bitcoin from a regulatory standpoint. This shift, which ends years of ambiguity, comes just as Ethereum spot ETFs begin to gain traction. On July 16 alone, these products recorded a net inflow of $726 million, reflecting strong demand from large investors. By way of explanation:
Security: A financial instrument representing a share in a company or a credit, such as a stock or bond. It is subject to financial market regulation (such as the SEC in the U.S.), especially regarding transparency, registration, and investor protection.
Commodity: A standardized tradable good, often raw, such as oil, gold... or bitcoin, according to regulators. It does not imply any ownership rights in a company and is not subject to the strict regulation applied to securities, but is instead overseen by other agencies like the CFTC.
JPMorgan breaks with the past and moves closer to cryptocurrencies
Jamie Dimon, CEO of JPMorgan and until recently a staunch critic of bitcoin, has made an unexpected move: the bank is studying the possibility of offering loans backed by cryptocurrencies like BTC and ETH. The system would allow clients to obtain liquidity in dollars without selling their crypto assets, by depositing them as collateral.
The bank would not directly custody these assets but would delegate that function to specialized providers such as Coinbase Custody. Although still in an exploratory phase, this represents a radical change in the relationship between big banking and the crypto world.
Trump Media, Western Union and Polymarket stoke the crypto narrative
It’s not just banks that are positioning themselves. Trump Media & Technology Group (TMTG) confirmed a $2 billion investment in bitcoin, making it the fifth publicly traded company with the largest BTC holdings in the world. The company is also preparing the launch of its own token on Truth Social, its social network.
Meanwhile, Western Union is exploring the use of stablecoins to improve the efficiency of international transfers, while Polymarket is studying the launch of its own stablecoin or a partnership with Circle (USDC). All this is happening after the recent approval of the GENIUS Act, which for the first time regulates these types of assets in the U.S.
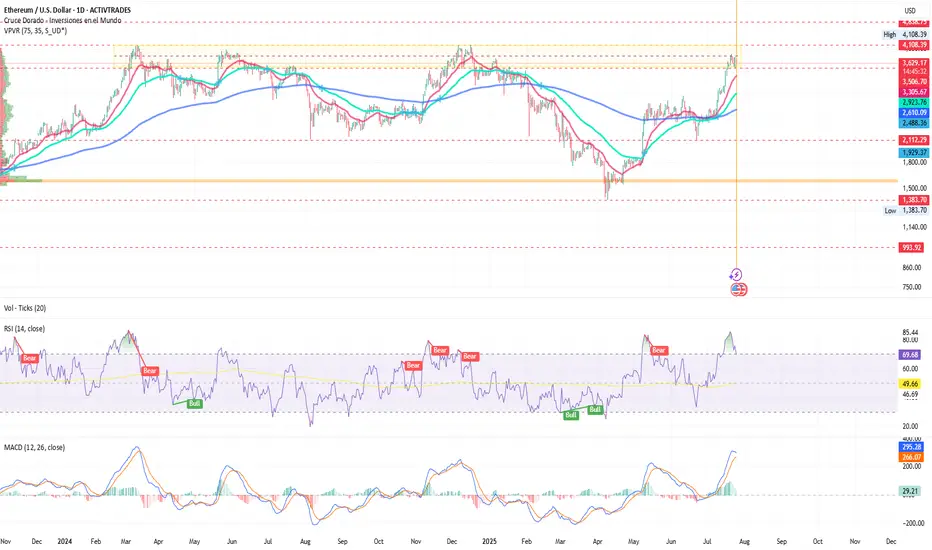
ETH/USD analysis: Beginning of a new bullish phase?
On the charts, Ethereum has responded to the macro and political environment with sustained recovery since April, entering a partial consolidation phase during several months this year. After holding the support level around $2,579, and since the golden cross on the 10th of this month, it has consolidated a price expansion leading it to test a new consolidation zone around $3,500. ETH now aims for more ambitious levels that could push the commodity towards recent highs of $3,857.67 and potentially break through to $4,000.
Currently, the price is within a range it has tested for the fourth time. If it fails to break out, we could see a pullback towards $2,700 or even a return to previous supports at $2,112 and the long-term point of control at $1,586.
Key support: $2,579
Immediate resistance: $3,857.67 (recent highs)
Target zone: $3,850 – $4,000 if a clean breakout occurs
Danger zone: Below $2,880, bearish pressure could return
Ethereum ready to make the leap
With the SEC’s legal backing, a recent surge in volume, the rise of spot ETFs, and the shift in traditional banking led by JPMorgan, Ethereum is cementing its role as a strategic asset in the new financial era, ready to lead the next phase of crypto adoption. This time, with Wall Street watching closely. Ethereum appears ready to play a leading role in the next stage of integration between traditional and digital finance — and it seems that big banks are betting heavily on ETH.
Ethereum is no longer in bitcoin’s shadow. Today, it stands as a key player in bridging traditional finance and the digital future.
*******************************************************************************************
The information provided does not constitute investment research. The material has not been prepared in accordance with the legal requirements designed to promote the independence of investment research and such should be considered a marketing communication.
All information has been prepared by ActivTrades ("AT"). The information does not contain a record of AT's prices, or an offer of or solicitation for a transaction in any financial instrument. No representation or warranty is given as to the accuracy or completeness of this information.
Any material provided does not have regard to the specific investment objective and financial situation of any person who may receive it. Past performance and forecasting are not a synonym of a reliable indicator of future performance. AT provides an execution-only service. Consequently, any person acting on the information provided does so at their own risk. Political risk is unpredictable. Central bank actions can vary. Platform tools do not guarantee success.
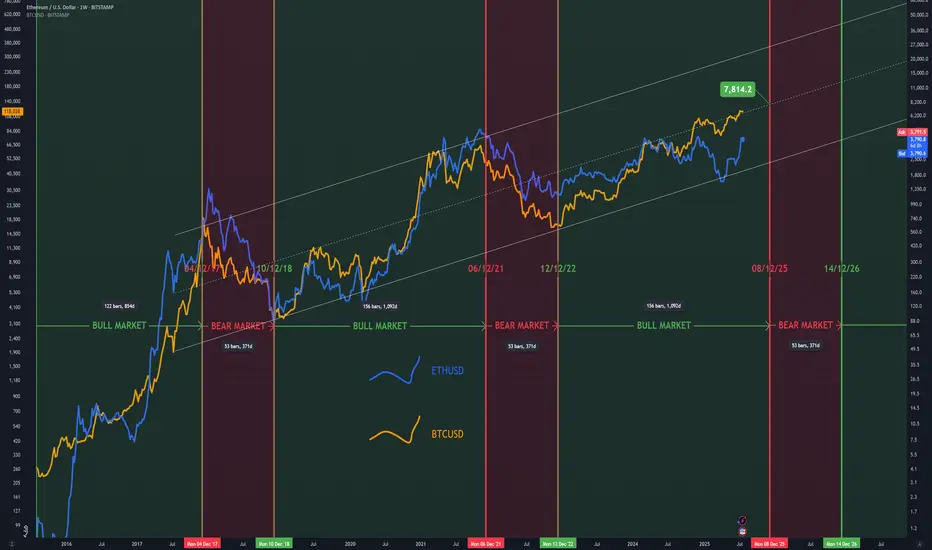
Realistic ProjectionThis is the more realistic approach for the Bull Cycle. Using both ETHUSD and BTCUSD and using their BEAR and BULL durations, this provides us with a December peak, with ETHUSD topping at the middle of the channel in the $7.5-8k range.
Bullish continuation?The Ethereum (ETH/USD) is falling towards the pivot and could bounce to the 1st resistance.
Pivot: 3,471.00
1st Support: 3,039.91
1st Resistance: 4,094.93
Risk Warning:
Trading Forex and CFDs carries a high level of risk to your capital and you should only trade with money you can afford to lose. Trading Forex and CFDs may not be suitable for all investors, so please ensure that you fully understand the risks involved and seek independent advice if necessary.
Disclaimer:
The above opinions given constitute general market commentary, and do not constitute the opinion or advice of IC Markets or any form of personal or investment advice.
Any opinions, news, research, analyses, prices, other information, or links to third-party sites contained on this website are provided on an "as-is" basis, are intended only to be informative, is not an advice nor a recommendation, nor research, or a record of our trading prices, or an offer of, or solicitation for a transaction in any financial instrument and thus should not be treated as such. The information provided does not involve any specific investment objectives, financial situation and needs of any specific person who may receive it. Please be aware, that past performance is not a reliable indicator of future performance and/or results. Past Performance or Forward-looking scenarios based upon the reasonable beliefs of the third-party provider are not a guarantee of future performance. Actual results may differ materially from those anticipated in forward-looking or past performance statements. IC Markets makes no representation or warranty and assumes no liability as to the accuracy or completeness of the information provided, nor any loss arising from any investment based on a recommendation, forecast or any information supplied by any third-party.

Ethereum at Crucial Resistance – Will the Bulls Hold or Fade?Ethereum at Crucial Resistance – Will the Bulls Hold or Fade?”
Ethereum is currently trading near a key resistance zone around $3,800, as marked on the chart. After a strong bullish rally with clear Break of Structures (BOS) along the way, ETH has now reached an extended point where price may face selling pressure.
The Bollinger Bands are stretched, showing overextension, and the marked arrow suggests a possible correction or pullback from this level. A retest of previous support zones (~$3,400–$3,200) could be expected if the resistance holds.
⸻
Key Levels:
• 🔼 Resistance: ~$3,800
• 🔽 Support: ~$3,400 / ~$3,000
• 🔄 Price Action: Watching for rejection or breakout confirmation
This is a textbook case of price approaching a strong resistance level after a bullish wave, where caution and confirmation are key for the next move.

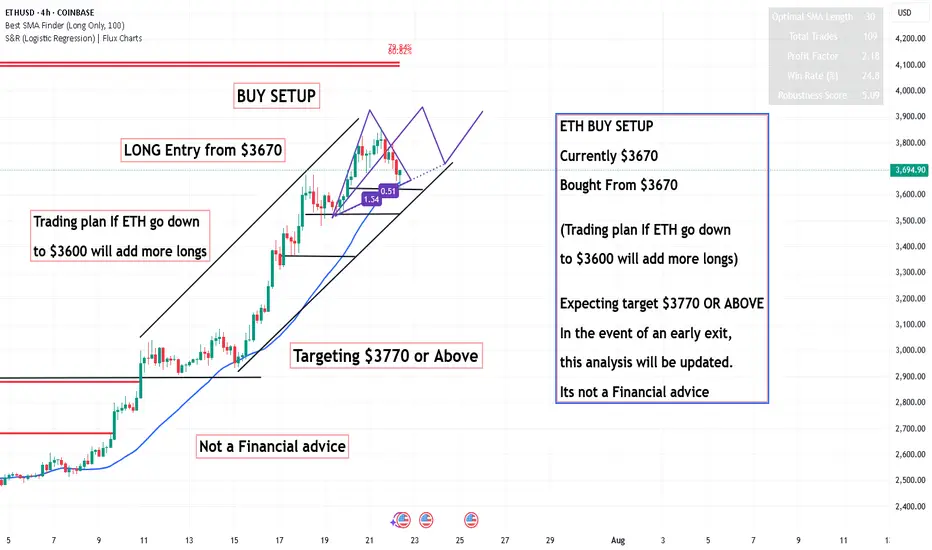
ETH BUY SETUP ,Bought From $3670ETH BUY SETUP
Currently $3670
Bought From $3670
(Trading plan If ETH go down
to $3600 will add more longs)
Expecting target $3770 OR ABOVE
In the event of an early exit,
this analysis will be updated.
Its not a Financial advice
Ethereum to $8000On the monthly chart, Ethereum has reached major resistance at $3,800 again and, in my opinion, can break through this time. This is the final leg to $8,000 soon.

Ethereum Long These zones are significant because they represent areas where large institutions and professional traders are likely to be active, potentially causing strong price movements when those orders are triggered. We want to enter trades that have minimal drawdown to maximize our buying power.
ETH | USDHello! This is my bearish scenario for ETH. If we get a weekly or monthly candle close below the red lines above, I’ll be expecting a downward phase toward the 1930 levels within 1–2 months. However, if we can close July above 3725, then my bullish outlook will remain intact.
CRYPTO:ETHUSD BINANCE:ETHUSDT BINANCE:ETHUSDT.P CRYPTOCAP:ETH.D BINANCE:ETHBTC CRYPTOCAP:ETH INDEX:ETHUSD BINANCE:ETHUSDT

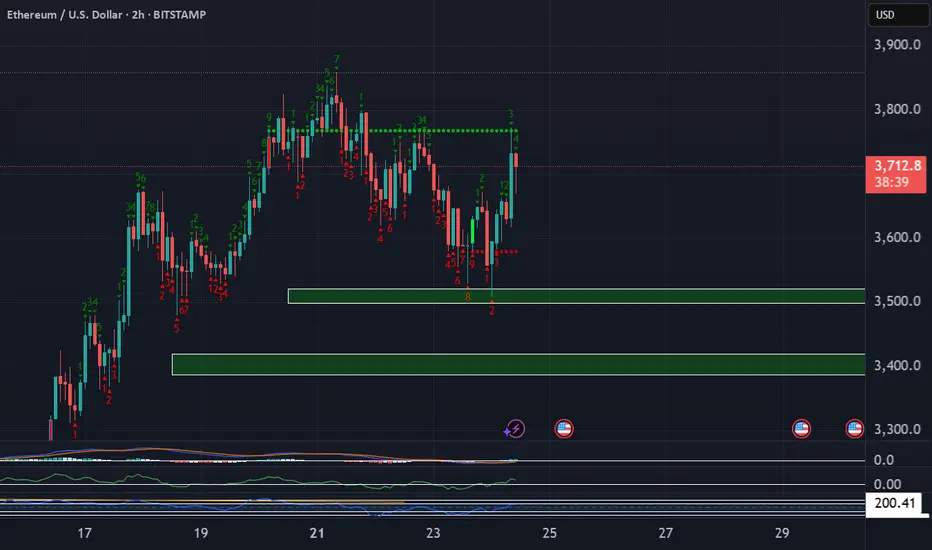
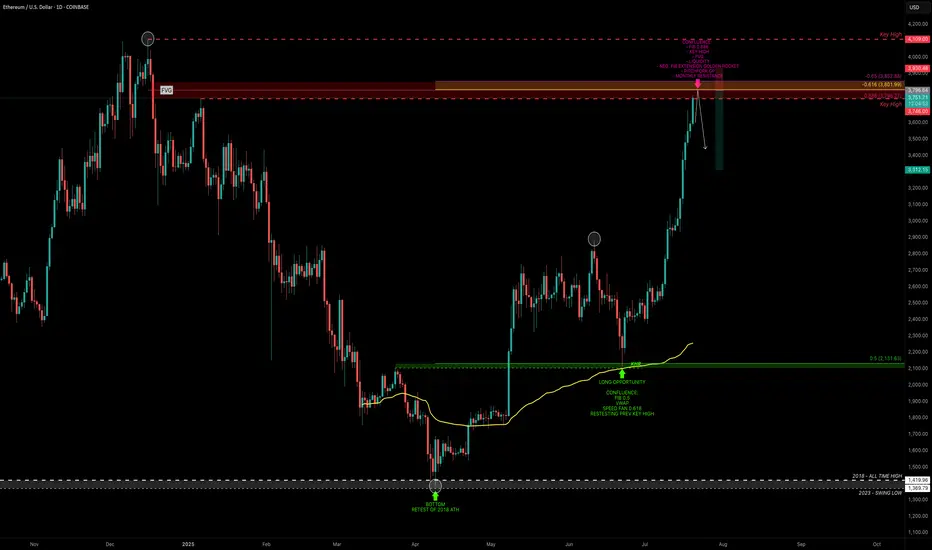
ETH — Rally Exhaustion or More Upside?ETH has been on an absolute tear. After retesting its old 2018 all-time high, it marked a bottom at $1383 — a brutal -66% correction over 114 days from the $4109 top.
From there, ETH ripped +100% in just one month, followed by 40 days of consolidation, and now, over the past 28 days, it’s surged another +76%, currently trading around $3715 — all without any major correction.
So the big question:
What’s next? Are we near a short setup, or is it time to long?
Let’s break it down.
🧩 Key Technicals
➡️ Bounce Zone:
On June 22, ETH retested the 0.5 fib ($2131.63) of the prior 5-wave Elliott impulse, with extra confluence from:
Anchored VWAP
Speed fan 0.618
➡️ Key Highs to Watch:
$3746 → recent local high
$4109 → 2021 all-time high
➡️ Fib Retracement Levels:
ETH has smashed through all major fibs, including the golden pocket (0.618–0.65) and 0.786 fib. The 0.886 fib at $3798.27 is the last major resistance, just above the $3746 key high.
At this zone, we also have:
Fair Value Gap (FVG)
Monthly Resistance
Negative Fib Extension Golden Pocket Target
➡️ Momentum Signal:
ETH is currently on its 8th consecutive bullish daily candle — historically, after 8–13 consecutive candles, price tends to cool off or correct. A sign to be cautious about longing here and consider profit-taking.
🔴 Short Trade Setup
Look for a potential SFP (swing failure pattern) at the key high $3746 to initiate a short trade.
This offers a low-risk setup with:
Entry: around $3746 (if SFP confirms)
Target (TP): ~$3300
Stop-loss: above SFP
R:R ≈ 1:4+
💡 Educational Insight: Why You Don’t Want to Long the Top
Markets often trap late longers near key highs or resistance zones — this is where smart money distributes while retail piles in emotionally.
Lesson: Look for zones of confluence (fib, VWAP, liquidity, FVG) and avoid chasing extended moves after multiple bullish candles.
Patience and confirmation at reversal points lead to higher-probability setups — you don’t need to catch every pump.
Final Thoughts
We’re approaching major highs, so this is a time for caution, not FOMO. Watch for reaction and potential reversals near $3750–$3850.
Stay sharp, manage risk — and remember, tops are where longs get trapped.
_________________________________
💬 If you found this helpful, drop a like and comment!
Want breakdowns of other charts? Leave your requests below.
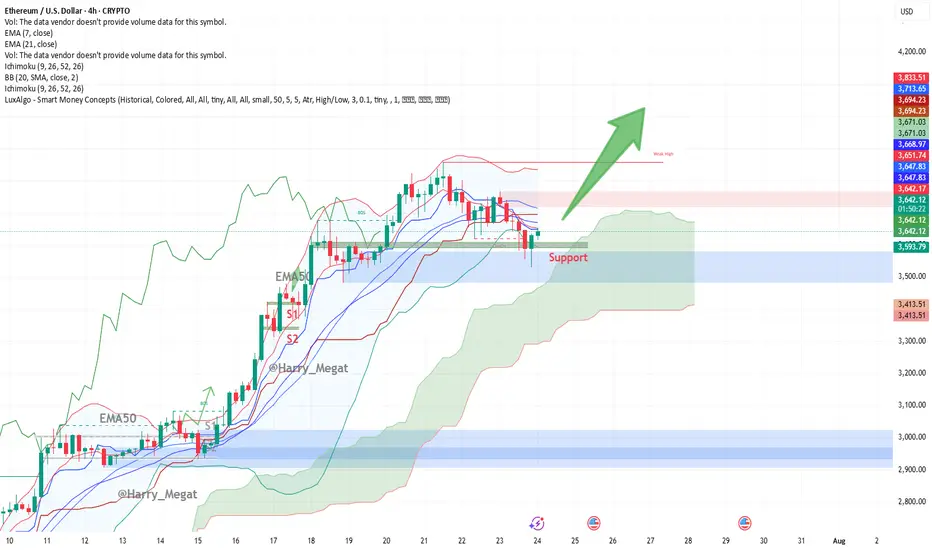
Ethereum (ETH/USD) 4-hour chart Technical AnalysisThis Ethereum (ETH/USD) 4-hour chart presents a **bullish setup**. Let’s break it down:
**Chart Overview:**
* **Price at the time of chart:** \~\$3,650
* **Support Zone:** \~\$3,615–3,630 (highlighted in green box)
* **Indicators:**
* **EMA 7 (Red):** \~\$3,653.87
* **EMA 21 (Blue):** \~\$3,669.75
* **Bullish Signal:** Large upward green arrow suggests expectation of a breakout rally from current support.
**Technical Analysis:**
**1. Bullish Bounce at Support**
* ETH tested the **horizontal support zone** multiple times, showing strong demand.
* The recent candle shows a **wick rejection** from the support zone — indicating buyer strength.
**2. Moving Averages**
* Price is trying to reclaim above the **EMA7**, with EMA21 nearby (\~\$3,670).
* A **bullish crossover** or strong candle close above both EMAs could confirm upside continuation.
**3. Structure**
* Previous resistance (\~\$3,615) has turned into **new support** — a classic bullish flip.
* The large green arrow projects a **potential breakout move**, targeting higher highs possibly above **\$3,750+**, then **\$3,900+**.
**Trade Setup Idea:**
| Type | Entry | Stop Loss | Take Profit 1 | Take Profit 2 |
| Long | \$3,655–3,660 | Below \$3,600 | \$3,750 | \$3,900+ |
**Watch Out For:**
* Rejection near EMA21 (\$3,670)
* False breakout if volume is weak
* Macro risk or sudden BTC movement dragging ETH
**Conclusion:**
The chart signals a **bullish bias** if ETH maintains above the support zone and reclaims both EMAs. A clean break above \~\$3,670–3,700 could spark further upside toward \$3,900+.
$Eth Ethereum nearing critical resistance....All Time High soon!This is a weekly candlestick chart of ETHUSD
Current price: 3800
CRYPTOCAP:ETH Ethereum recently broke out of a long-term downtrend, indicated by the red diagonal trendline. Price action has shifted from bearish to bullish. This is also a show of strong Momentum as recent candles are large and green, showing aggressive buying (strong bullish pressure).
If #eth continues in this uptrend then here are the resistance above to watch: 4000, 4800 and possibly new all time highs at 5600, 6400
Note worthy to know that the areas between 3800-4000 is very critical resistance.
Assuming a retracement from this resistance, Ethereum remain bullish above 2900
Invalidation of this idea is under 2900

Eth next bottom before the next leg upIn a bull market the average retrace
is between .2 -.4 Fib from the bottom
of that run.
Several factors of confluence lead me
to believe Eth will hit my red T1 target,
bounce to the top of current range (green T1)
then drop to a minimum of .35 Fib = $2990