Buy Ethereum: This coin lags BitcoinHello,
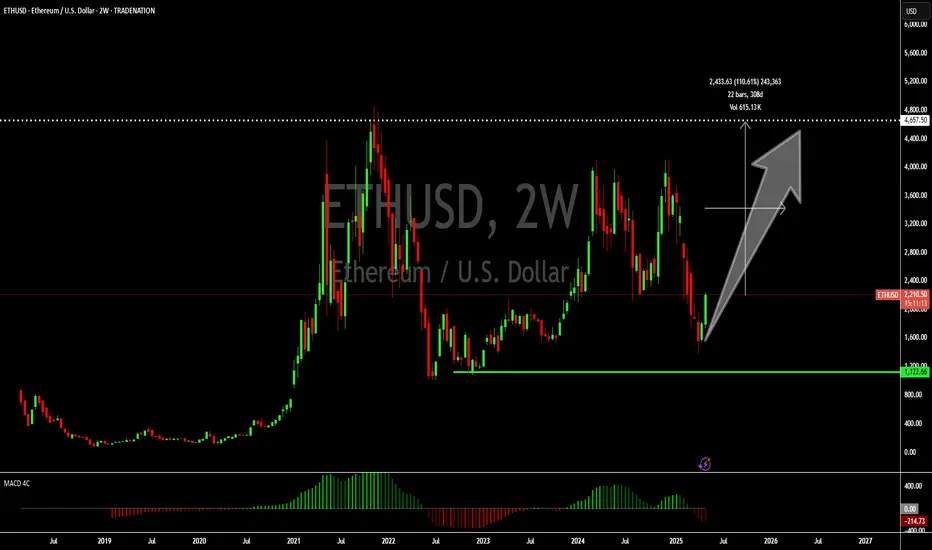
The Ethereum coin is a great coin to consider adding to your portfolio. Bitcoin has rallied over the past few days passing above $100K yesterday and looks poised to break the previous high as more money begins flowing in. For those not already invested, we see an opportunity in boarding the Ethereum train as investors who missed the Bitcoin rally are likely to pack their money here.
From a technical perspective the coin is still trading at the bottom and is at a great entry point. The target for this coin is $4,400 giving a return over 100% from the current price. The MACD indicator is also heading to 0 crossover further strengthening our view for a solid buy.
Don't let this opportunity pass. Ethereum's fundamentals, market dynamics, and technical setup align for a powerful breakout. Act now to position yourself ahead of the curve.
Disclosure: I am part of Trade Nation's Influencer program and receive a monthly fee for using their TradingView charts in my analysis.
ETHUSD trade ideas
massive breakoutGuys massive breakout
It's going to collect after ethereum news of so called halving
still 50% off from beginning of year
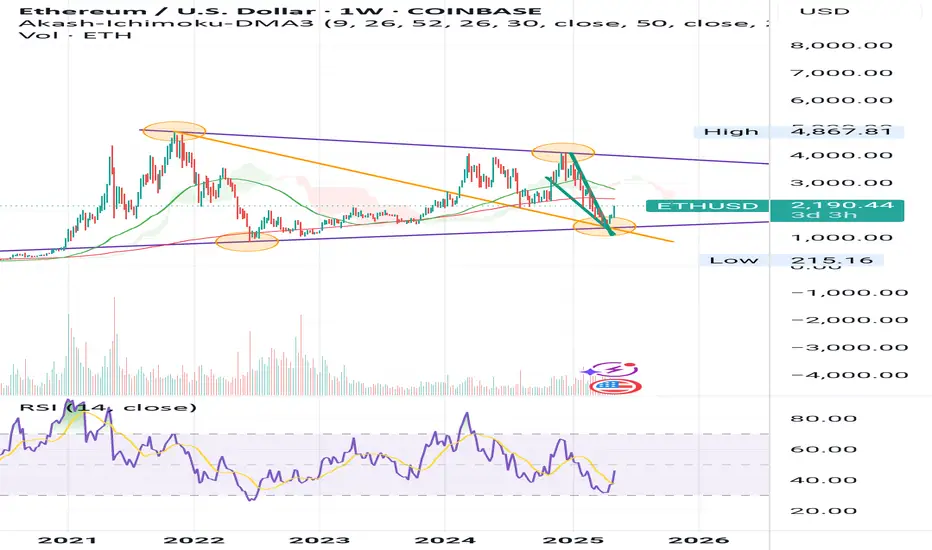
Ethereum - Perfect exactly how I thoughtEthereum
Stage 1 - Triangle Pattern - Gave perfect breakdown of triangle pattern
Stage 2 - Form M Pattern - Have almost completed the selling target
Stage 3 - Retesting completed *Current)
Stage 4 - Forming inverse cup and handle and inverted head and shoulder pattern
Stage 5- in either of the scenario it may come down but if it goes above 2297 expect it to reach 4000/500/7000 in coming days
Stage 5.2 - if the retesting is completed and bearish patter is continued expect it to reach to 900 USD
For more details ping me
GK Trade manthan

ETHUSD Long (UPDATE)The run is continuing on ETH.
CRYPTO seems to be on run across the board with BTC over $100K

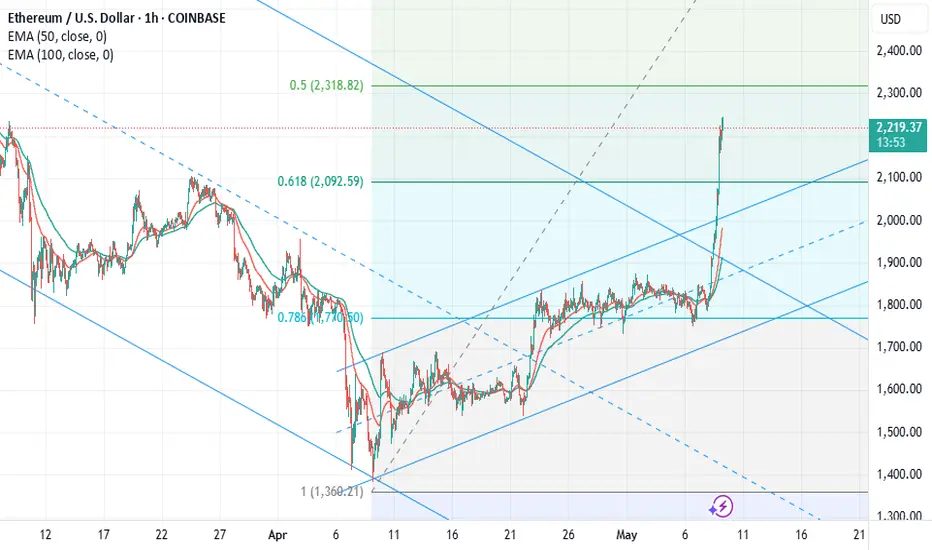
$ETH 20% Move With 20/50DMA CrossoverHOLY MOLY!
Over 20% gain for CRYPTOCAP:ETH on the day
20DMA making a bullish crossover the 50.
Next target at the .382 Fib ~$2400
Did Pectra actually work?
And is Ethereum back from the dead !?

ETH to 8kAnother depiction of my earlier analysis explicitly showing the touch points for the bull penant
Not financial advice
Ether-Bitcoin Ratio Signals ETH Is 'Extremely Undervalued,' The cryptocurrency market is a realm of intricate signals, complex metrics, and often-conflicting narratives. Among the myriad indicators traders and investors scrutinize, the Ether-Bitcoin (ETH/BTC) ratio holds a prominent place. This metric, a simple division of Ethereum’s price by Bitcoin’s price, serves as a barometer for the relative strength and market sentiment between the two leading crypto assets. Recently, this ratio has dipped to levels that historically signaled significant undervaluation for Ether, sparking debate about a potential upcoming rally. However, a confluence of factors – notably surging ETH supply, stagnant network demand, and a weakened token burn mechanism – casts a considerable shadow over this optimistic outlook, suggesting that past performance may not be a reliable guide in the current, uniquely challenging environment.
Understanding the ETH/BTC Ratio: A Barometer of Relative Strength
At its core, the ETH/BTC ratio reflects the market's perception of Ethereum's value proposition relative to Bitcoin. When the ratio trends upwards, it indicates that ETH is outperforming BTC, suggesting growing investor confidence in Ethereum's ecosystem, technological advancements, or utility. Conversely, a declining ratio signifies BTC's relative strength, potentially due to factors like "digital gold" narratives, safe-haven appeal, or specific Bitcoin-centric catalysts.
A low ETH/BTC ratio, such as those observed in recent times, is often interpreted by analysts as a sign that ETH is "cheap" or "undervalued" compared to Bitcoin. The logic is that, over time, capital flows within the crypto market tend to seek out assets with stronger growth potential or those perceived as lagging behind their fundamental value. If ETH is indeed undervalued, the expectation is that it will eventually catch up, leading to a rally in both its USD price and its value relative to BTC. This potential for "mean reversion" or a "catch-up trade" is what excites many market participants when the ratio hits historical lows.
Historical Precedents: When Undervaluation Sparked Rallies
The argument for an impending ETH rally based on the current low ETH/BTC ratio is not without historical merit. There have been several instances where a depressed ratio preceded substantial upward movements for Ether.
1. Post-2018 Crypto Winter: After the ICO boom and subsequent crash, the ETH/BTC ratio languished for an extended period. However, as the DeFi (Decentralized Finance) ecosystem began to gain traction in 2020 ("DeFi Summer"), ETH, as the foundational layer for most DeFi protocols, experienced a resurgence. The ratio climbed significantly as capital flowed into Ethereum to participate in yield farming, lending, and decentralized exchange activities.
2. The NFT Boom (2021): The explosion of Non-Fungible Tokens (NFTs) in early 2021, predominantly on the Ethereum blockchain, provided another major catalyst. The increased demand for ETH to mint, buy, and sell NFTs pushed its price and the ETH/BTC ratio upwards, as Ethereum's utility as a platform for digital collectibles and art became undeniable.
3. Anticipation of The Merge (2021-2022): As Ethereum moved closer to its pivotal transition from Proof-of-Work (PoW) to Proof-of-Stake (PoS) – "The Merge" – market sentiment turned increasingly bullish. The promise of significantly reduced energy consumption, coupled with the "ultrasound money" narrative (where ETH issuance would drastically decrease and potentially become deflationary due to EIP-1559's burn mechanism), fueled strong buying pressure. The ETH/BTC ratio saw notable gains during periods of heightened Merge anticipation.
In these instances, the low ETH/BTC ratio acted as a tinderbox, and specific fundamental catalysts served as the spark that ignited significant rallies. Investors who recognized the undervaluation signal and anticipated these catalysts were handsomely rewarded. This historical pattern underpins the current optimism among some analysts who see the present low ratio as a similar buying opportunity.
The Complicating Factors: Why This Time Might Be Different
Despite the compelling historical precedents, the current market environment for Ethereum presents a unique set of challenges that complicate the simple "undervalued, therefore rally" thesis. These headwinds stem from fundamental shifts in Ethereum's tokenomics and network dynamics.
1. Surging Supply: The Post-Merge Issuance Reality
While The Merge successfully transitioned Ethereum to a more environmentally friendly PoS consensus mechanism, its impact on ETH supply has been more nuanced than initially portrayed by some bullish narratives.
• Staking Rewards: Under PoS, new ETH is issued as rewards to validators who stake their ETH to secure the network. While the rate of new ETH issuance is significantly lower than it was under PoW, it is still a consistent inflationary pressure. The annual inflation rate from staking rewards is currently in the low single digits.
• Net Issuance vs. Deflation: The "ultrasound money" thesis largely depended on the EIP-1559 burn mechanism (discussed later) consistently burning more ETH than is issued through staking rewards, leading to a net deflationary supply. However, this has not always been the case post-Merge. There have been extended periods where ETH has been net inflationary.
• Unstaking and Liquid Staking Derivatives: The ability for validators to unstake their ETH (enabled by the Shanghai/Capella upgrade) means that previously locked supply can re-enter the market. Furthermore, the proliferation of Liquid Staking Derivatives (LSDs) like Lido's stETH or Rocket Pool's rETH, while enhancing capital efficiency, also means that staked ETH is not entirely removed from liquid circulation, as these derivative tokens can be traded or used in DeFi.
This consistent, albeit reduced, issuance contributes to sell pressure, especially if demand does not keep pace. The narrative of ETH becoming a deflationary asset has been weakened, impacting one of the key bullish arguments that previously supported a higher ETH/BTC ratio.
2. Flat Demand: A Stagnant Network Picture
For ETH's price to appreciate significantly, there needs to be robust demand for the token, driven by network usage and adoption. Currently, several indicators suggest that demand is, at best, flat, and in some areas, declining.
• Network Activity Metrics: Key on-chain metrics such as daily active addresses, transaction counts, and total gas consumed have shown periods of stagnation or even decline. While Layer 2 scaling solutions are processing more transactions, this activity doesn't always translate directly into proportional demand for ETH on the mainnet, especially if Layer 2s manage their own fee markets efficiently.
• Total Value Locked (TVL) in DeFi: While DeFi remains a cornerstone of Ethereum's value proposition, the growth in TVL has slowed considerably compared to the explosive growth seen in 2020-2021. Capital inflows into DeFi protocols on Ethereum have been less aggressive, partly due to macroeconomic conditions, regulatory concerns, and the emergence of competitive DeFi ecosystems on other blockchains.
• Competition from Alternative Layer 1s and Layer 2s: Ethereum faces increasing competition from other Layer 1 blockchains (e.g., Solana, Avalanche, Aptos, Sui) that offer higher throughput and lower transaction fees, attracting users and developers. Moreover, Ethereum's own Layer 2 ecosystem (e.g., Arbitrum, Optimism, Polygon zkEVM, Starknet, zkSync Era), while crucial for its long-term scalability, also fragments user activity and can, in some ways, reduce direct demand pressure on ETH for L1 transactions if users primarily operate within these L2 environments.
• Macroeconomic Headwinds & Regulatory Uncertainty: Broader economic conditions, including inflation, interest rate hikes, and recession fears, have generally dampened risk appetite across financial markets, including crypto. Additionally, the ongoing regulatory uncertainty in key jurisdictions like the United States creates an environment of caution, potentially hindering institutional adoption and large-scale investment in assets like ETH.
• NFT Market Cool-Down: The NFT market, which was a significant driver of ETH demand, has experienced a substantial cool-down from its peak in 2021-2022. While innovation continues, transaction volumes and average sale prices have fallen, reducing the ETH velocity associated with this sector.
Without a significant uptick in genuine network demand – more users transacting, more capital flowing into DeFi, a resurgence in NFT activity, or new killer dApps emerging – it becomes harder for ETH to absorb the ongoing supply issuance and stage a sustainable rally.
3. Weakened Burn Mechanics: The Diminished Impact of EIP-1559
EIP-1559, implemented in August 2021, was a landmark upgrade for Ethereum. It introduced a mechanism where a portion of every transaction fee (the "base fee") is burned, permanently removing that ETH from circulation. This was a key pillar of the "ultrasound money" narrative, as it created a deflationary pressure that could, under conditions of high network demand, outpace new ETH issuance.
However, the effectiveness of this burn mechanism is directly tied to network congestion and the level of the base fee.
• Lower Network Congestion: In periods of lower network activity and congestion (as has been observed more frequently recently), the base fee required to get transactions included in a block decreases. A lower base fee means less ETH is burned per transaction.
• Impact of Layer 2s: As more transaction activity shifts to Layer 2 scaling solutions, which have their own, typically much lower, fee structures, the demand for block space on Ethereum Layer 1 can decrease. While L2s do periodically batch transactions and settle them on L1 (consuming L1 gas and contributing to the burn), the overall L1 gas consumption directly attributable to individual user transactions might be lower than if all those transactions occurred on L1.
• Periods of Low Burn: Consequently, there have been extended periods post-Merge where the amount of ETH burned via EIP-1559 has been insufficient to offset the ETH issued as staking rewards. During these times, ETH's supply becomes net inflationary, undermining the deflationary narrative that was a strong catalyst in previous cycles.
While EIP-1559 remains a crucial and beneficial upgrade for Ethereum's fee market predictability, its power as a consistent deflationary force has been tempered by the current realities of network demand and the evolving Layer 2 landscape.
Synthesizing the Outlook: A Tug-of-War
The current situation for Ethereum is a complex tug-of-war. On one side, the historically low ETH/BTC ratio flashes a compelling "undervaluation" signal, suggesting a potential for significant upside based on past market behavior. This attracts traders looking for relative value plays and those who believe in Ethereum's long-term fundamental strengths.
On the other side, the fundamental picture is clouded by persistent, albeit reduced, supply issuance, a lack of explosive growth in network demand, and a burn mechanism whose deflationary impact is currently muted. These factors create genuine headwinds that could prevent ETH from easily replicating its past ratio-driven rallies.
For ETH to truly capitalize on its apparent undervaluation relative to Bitcoin, several things likely need to occur:
1. A Resurgence in Demand: This could come from a new "killer app" or narrative on Ethereum, a significant rebound in DeFi or NFT activity, increased institutional adoption (perhaps spurred by clearer regulation or new investment products like spot ETH ETFs in more jurisdictions), or a general improvement in macroeconomic conditions that boosts risk appetite.
2. Successful Maturation and Value Accrual from Layer 2s: As Layer 2 solutions mature and gain wider adoption, their success needs to translate into tangible value accrual for ETH itself. This could happen through increased L1 settlement demand, the use of ETH as a primary gas token on L2s, or innovative mechanisms that tie L2 economic activity back to the L1 token. EIP-4844 ("Proto-Danksharding") is a step in this direction by aiming to reduce L2 transaction costs, potentially fostering more L2 activity and, consequently, more L1 settlement.
3. A Shift in Broader Market Sentiment: Often, major altcoin rallies, including for ETH, occur after Bitcoin has established a strong uptrend and market sentiment becomes broadly bullish. A sustained Bitcoin rally could create a "wealth effect" and encourage capital to rotate into ETH and other altcoins.
Conclusion: Caution Warranted Despite Undervaluation Signals
While the ETH/BTC ratio strongly suggests that Ether is trading at a significant discount compared to Bitcoin, historical precedent alone may not be enough to guarantee a rally in the current market. The fundamental challenges posed by ongoing supply, relatively flat demand, and a less potent burn mechanism are significant and cannot be ignored.
Investors and traders eyeing ETH must weigh the allure of its apparent undervaluation against these tangible headwinds. A potential ETH rally is likely contingent not just on the ratio mean-reverting, but on a demonstrable improvement in Ethereum's core demand drivers and a favorable shift in the broader market environment. The "extremely undervalued" signal is a call for attention, but thorough due diligence and a clear understanding of the current complexities are more crucial than ever. Ethereum's long-term vision remains ambitious, but its path to reclaiming relative market dominance against Bitcoin in the near term appears more challenging than in previous cycles.

ETH gonna startWhen the Eth is 1500 -1600 dollars i said its the good time to buy this one
I think if you are holder the ETH just start and ATH can come in 3 or 6 months.

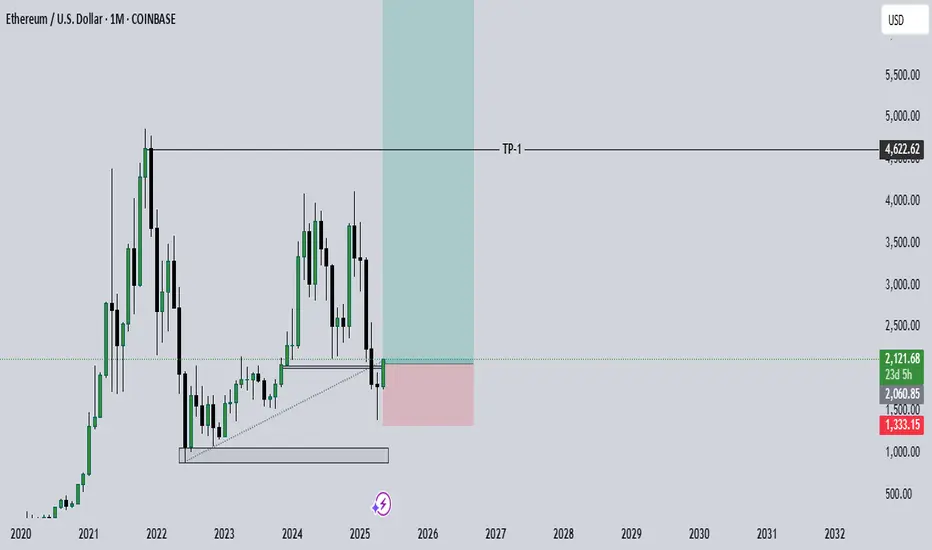
ETH buying zoneBuying Eth now :-
fakeout of monthly support zone
currently at above support level
Targetting recent ATH as TP1 and 30,000/ETH for long run
If Ethereum behaves like $BTCIf Ethereum behaves like CRYPTOCAP:BTC , which after breaking through the downward channel continued to grow without a rollback, then soon we will see our Favorite Ether at $2500.
The altcoin season will come after the growth of Ether, but there will not be enough Liquidity for everyone!
Projects that are alive, working, and earning will grow.
Projects should have realized - It's time to take responsibility and independently ensure the Liquidity of their Tokens at the expense of income from the Business Model, and not live at the expense of VCs with a printing press.
#RateXAI #RAA token
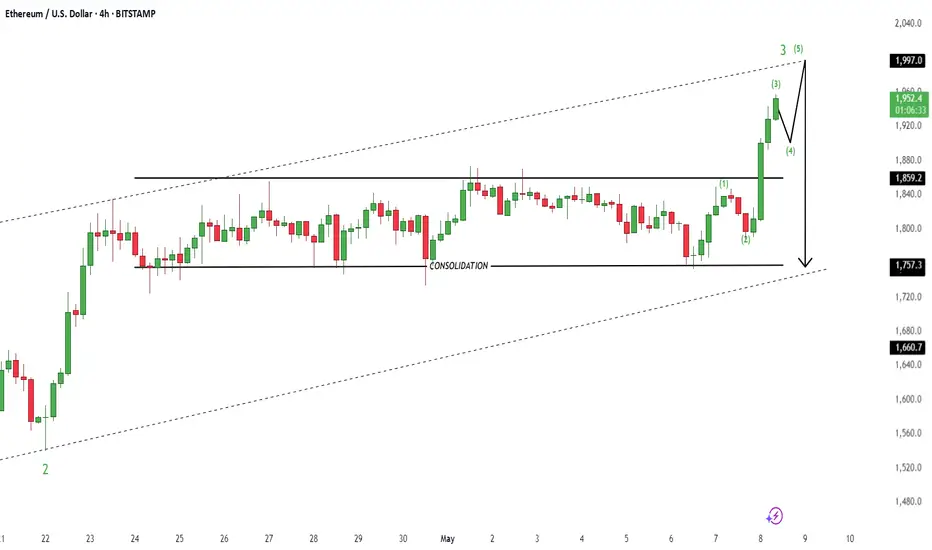
Ethereum $ETH – Breakout from Accumulation Zone!
ETH has successfully reclaimed the accumulation zone after consolidating for weeks. This zone previously acted as a strong demand area and is now a potential launchpad for higher prices.
🔸 Upside Target: $3,500 - $4,500
The breakout above $2,000 signals a bullish shift. A confirmed move past $2,200 could trigger continuation towards $2,800, $3,500, and eventually the $4,500 psychological level.


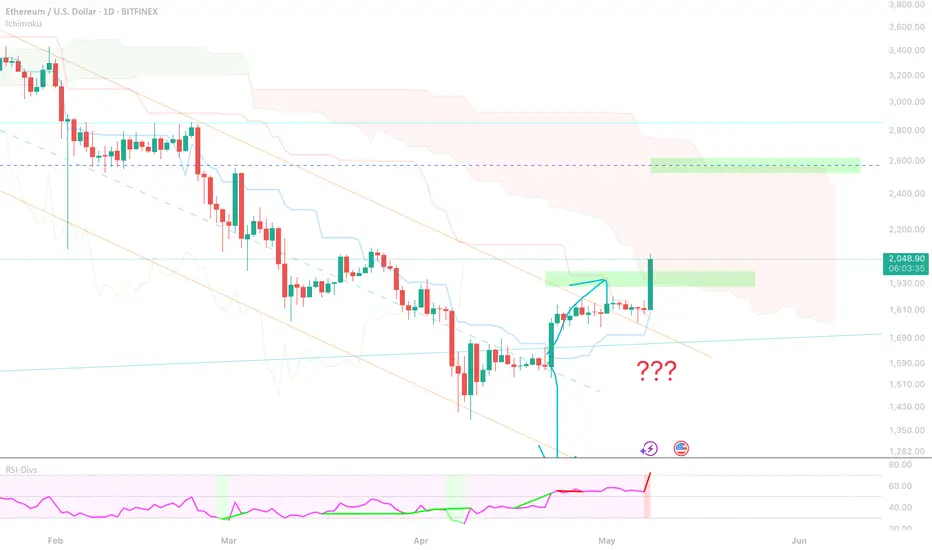
EthereumETHUSD
- Consolidation Phase as an corrective pattern in short time frame
- Break of Structure
- RSI - Divergence
- Completed " 123 " Impulsive Waves
- Bullish Channel in Long Time Frame
Where is ETH headed? What are the targets?Historically, it’s clearly visible that after a significant correction of 65–75%, ETH has always bounced back to the 0.382 level and slightly above. I don’t know if that will happen this time, but as soon as we approach the 0.382 level, I’ll consider closing my positions.

There is is guys, it's going up up and awayBye bye Eth godspeed
It's hit its EMA 50 its broken out of its downward trend, it's out of its long channel from December. What more do you need.

Ethereum: Flight-path idea.$2,149 is a price of significance. Believe that we will see resistance from this price point.
Breaks above the downtrend would be Bullish.
A bounce off the downtrend AND $2,149 (flipped into support) could present an optimal long entry.
