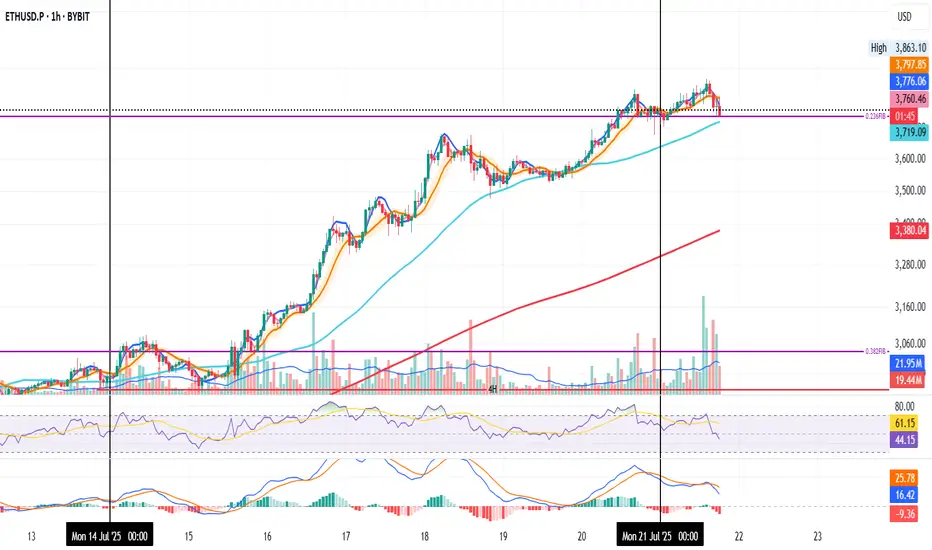
shortly bearish closed my trade at ~3750.
healthy retracement and 3 key levels for me to watch out. Next hours maybe a few days bearish, in my opinion a high chance to reach this targets.
Overall still bullish. Also watch out my post on ETH/BTC.
ETHUSD trade ideas

ETHUSD: A potential short term trade setting upHello,
The ETHUSD pair is currently forming a well-defined bullish flag pattern, a reliable indicator of a potential continuation of the upward trend. Risk-tolerant investors may consider entering at the lower boundary of the flag, while risk-averse investors might prefer to wait for a confirmed breakout to the upside before entering a position.
The MACD is showing a bullish zero-line crossover, further supporting our bullish outlook. Additionally, the cryptocurrency market has experienced significant growth recently, with Bitcoin trading at all-time highs. While Ethereum has underperformed Bitcoin, this lag presents a compelling buying opportunity, as investors who missed Bitcoin's rally may turn to Ethereum to capitalize on its potential catch-up
Disclosure: I am part of Trade Nation's Influencer program and receive a monthly fee for using their TradingView charts in my analysis.
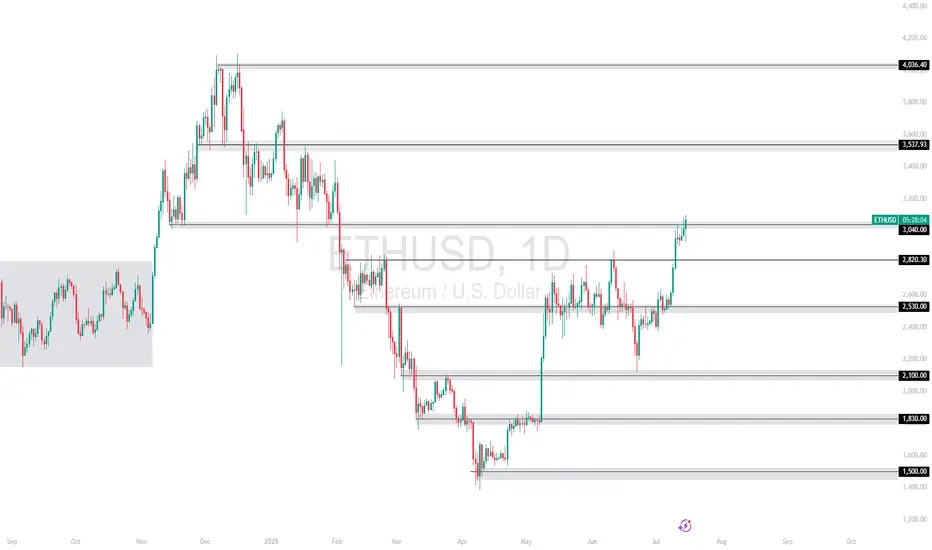
ETHUSD | Breakout Watch Above $3,040Ethereum has surged above the critical $2,530 resistance zone and is now challenging $3,040, a key structure level. A daily close above this could open the path toward $3,537 and even $4,056 in the mid-term.
Support at: 2,530 / 2,100 / 1,830 🔽
Resistance at: 3,537.93 / 4,056.40 🔼
🔎 Bias:
🔼 Bullish: Holding above 2,530 confirms breakout structure; a clean break above 3,040 targets higher zones.
🔽 Bearish: Failure to stay above 3,040 may invite a retest of 2,530.
📛 Disclaimer: This is not financial advice. Trade at your own risk.
ETHUSD 1 hour time frame
EHT USD Long Call Buy Setup
Bulllish Hammer Trigger the trade
Mange your risk reward as per your capital and book partial profits
ETH bullish trend.ETH bullish trend on Daily TF, Retracement can happen till 0.5 till 0.618 fib level.
Resistances shown with R sign and All time high as ATH.

ETHUSD: Road to 4K today after a breakout. ETH/USD – 4H Outlook: Targeting $4,000+
Ethereum is coiling within a descending wedge, signaling potential breakout momentum. Volume compression indicates that once ETH breaks above the wedge resistance (~$3,750), it could accelerate toward the $4,000–$4,050 supply zone.
Key Levels:
Resistance: $3,750 → $4,000
Support: $3,650 → $3,550
Breakout Target: $4,007 (mid-term)
VolanX Protocol Insight:
Institutional liquidity clusters sit above $3,800. A clean breakout with strong volume could trigger stop runs and a swift rally to 4K.
Risk Management:
Entry after breakout retest above $3,750.
Stop-loss: Below $3,640.
Take-profit: $3,980–$4,050.

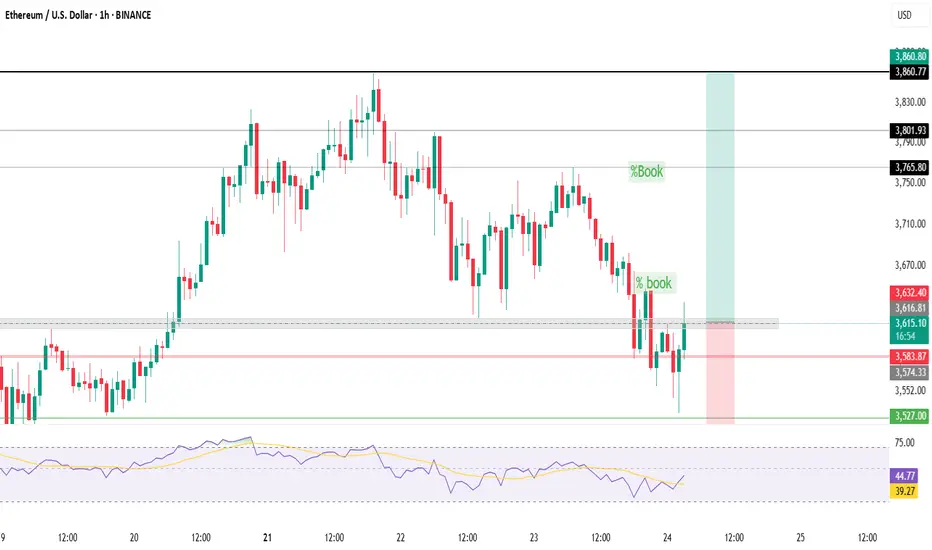
ETH Price Analysis & Bullish Continuation Prediction 4h & 1DThis analysis examines the Ethereum/US Dollar 1-day chart from Binance, focusing on a potential bullish continuation as of July 22, 2025. The chart indicates a recent upward movement following a consolidation phase, with the price approaching a key resistance at $4,090.81. As a reader, I’d want to grasp the context: the 1-hour and 2-hour support zone around $2,455.64 has provided a strong foundation, while the current price action suggests a possible rejection point near $3,600.00 if it fails to break resistance.
My thought process starts with the support zone at $2,455.64, which has historically held, indicating a solid base for any upward move. The price has now reached $3,600.00, a level where it could either break out toward $4,090.81 or face rejection. A successful break above $4,090.81 with increased volume could lead to a continuation toward $4,200.00. However, if the price falls below $3,600.00, it might signal a retreat back to the support zone, invalidating the bullish outlook.
Profit Targets:
Short-term: $4,090.81 (key resistance)
Long-term: $4,200.00 (bullish continuation)
Stop Loss: $2,455.64 (below the 1h/2h support zone)
These targets and stop loss levels provide clarity for managing the trade effectively.

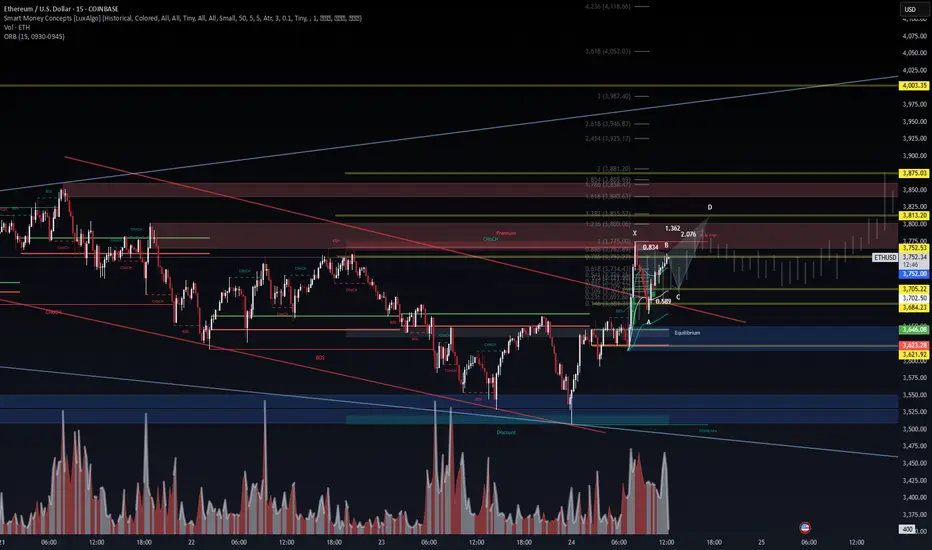
ETHUSD – Long Setup Activated | VolanX Protocol AlertEthereum (ETHUSD) is displaying strong bullish intent after reclaiming the VolanX Alert Line (~$3,659). Price action is forming higher lows with BOS (Break of Structure) signals, indicating that smart money is accumulating before a potential continuation rally toward the premium zones.
Key Levels & Zones:
Entry Zone: $3,660 – $3,680 (retest of equilibrium/alert line)
Target 1: $3,767 (weak high zone)
Target 2: $3,875 (premium zone)
Target 3: $4,000+ (extended bullish target)
Invalidation: Close below $3,620 (discount zone breach)
Rationale:
CHoCH → BOS → Retest Pattern: Multiple change-of-character moves followed by a BOS above $3,705 signal bullish market structure.
Liquidity Hunt Completed: Price swept the $3,540 discount zone and rebounded sharply, confirming smart money entry.
OPEX Volatility Catalyst: With options expiration tomorrow, volatility could drive ETH toward key liquidity zones. Favoring long bias as buy-side liquidity builds above $3,750.
Volume Surge: Breakout volume on 15m and 1H charts suggests institutional participation.
Trade Plan:
Long Entry: On a successful retest of $3,660–$3,680 zone with strong bullish candle confirmation.
Stop-Loss: Below $3,620 (structure invalidation).
Targets: Scale out at 3,767 → 3,875 → trail above $3,900.
Risk-Reward: ~1:3 or better, depending on execution and trailing strategy.
Disclaimer:
This analysis is for educational purposes only and not financial advice. Trade responsibly and use proper risk management.

ETH/USD Harmonics forecast. We are still studying it's trend, looks like the next move is going to be toward downwards, temporary.
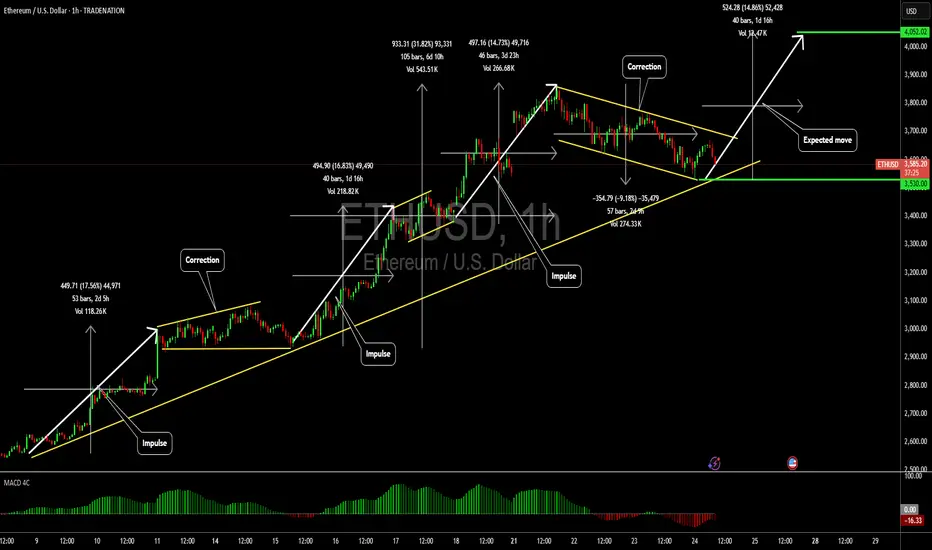
ETH: Eyes Resistance, But Correction Still LoomsEthereum has also seen a modest pullback since yesterday morning, but here too, it’s too soon to confirm a high for turquoise wave B. Accordingly, we anticipate further gains in this corrective rally—potentially up to resistance at $4,107—before the subsequent turquoise wave C takes over and drives the price down into the green long Target Zone ($935.82–$494.15). Within this range, we primarily expect the low of the wave- correction, which has now lasted more than four years, setting the stage for a long-term trend reversal to the upside. According to to our alternative scneario, magenta wave alt.(1) would complete with the next high. The following pullback, attributed to wave alt.(2), would then only extend into the slightly adjusted magenta Target Zone ($2,622–$1,914) before a move to new all-time highs (probability: 35%).
📈 Over 190 precise analyses, clear entry points, and defined Target Zones - that's what we do (for more: look to the right).

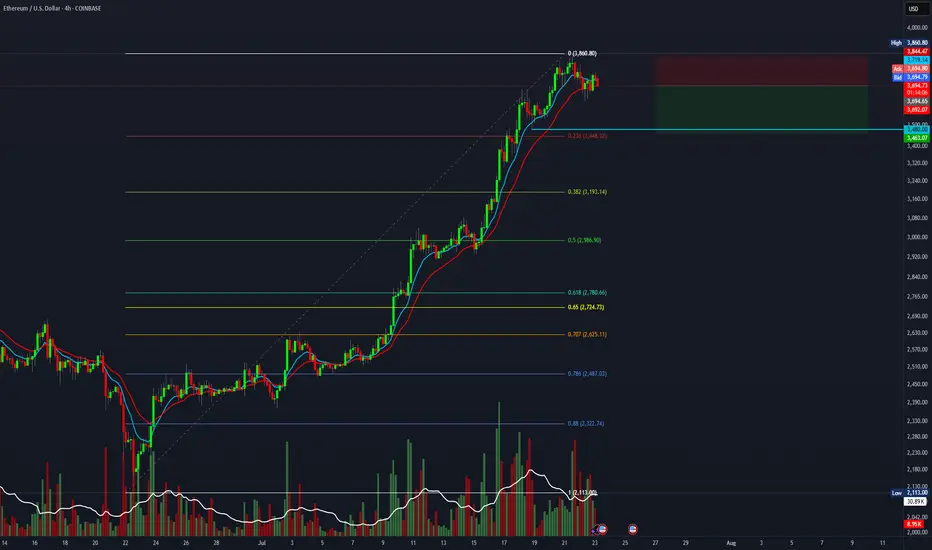
$ETH Hit Our Targets and was rejectedCRYPTOCAP:ETH hit our signal take profit target at $3820 and was rejected at the High Volume Node EQ to the penny.
That appears to have completed wave 3 of this motif wave. Wave 4 has an expected target of the R2 daily pivot and 0.236-0.382 Fibonacci retracement, $3260 before continuing to the upside in wave 5 with a target of the all time high.
This aligns with my views of a significant pullback at the end of August and September which is typical after a summer rally.
No divergences yet in daily RSI.
Safe trading

Short swing setup on ETH, targeting 1.5R.It's time for a healthy pullback on ETH. This short setup offers a 1.5:1 risk-to-reward ratio with a target of $3,500.
Entry at $3,725
Stop loss at $3,850
Target at $3,500.
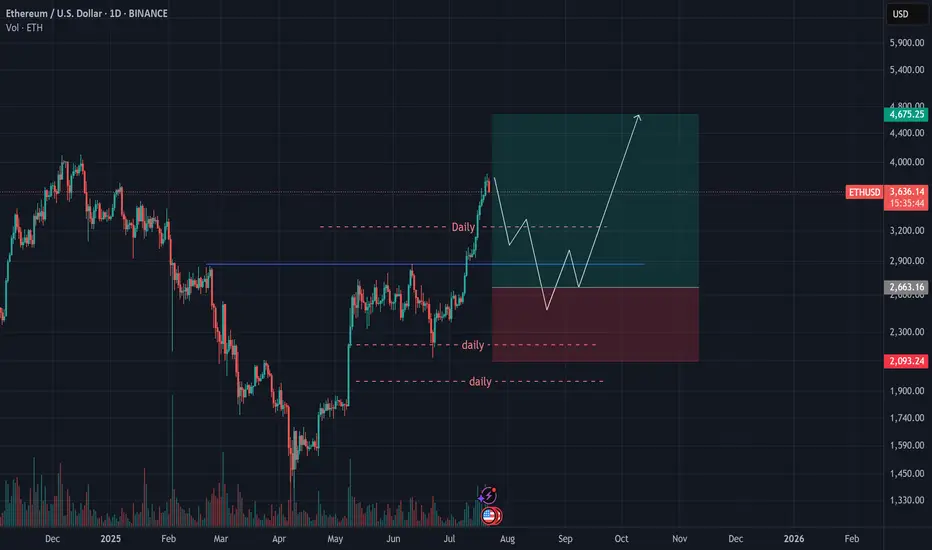
Ethereum (ETH) Analysis – July 21, 2025Ethereum has decisively broken through the key $3,000 level, pushing toward $4,000 with strong bullish momentum.
📉 While a short-term correction is likely in the coming weeks, ETH — much like Bitcoin — tends to attract increased investor interest with each dip.
As such, a continued rally toward $5,000 by the end of September remains well within reach, given the current structure and sentiment.
✅ Personally, I’m waiting for a pullback to around $2,700 as a more optimal re-entry point.
#ETH/USDT SETUP ,Bought From $3696#ETH
The price is moving within a descending channel on the 1-hour frame, adhering well to it, and is on its way to breaking strongly upwards and retesting it.
We have support from the lower boundary of the descending channel at 3640.
We have a downtrend on the RSI indicator that is about to be broken and retested, supporting the upside.
There is a major support area in green at 3600, which represents a strong basis for the upside.
Don't forget a simple thing: ease and capital.
When you reach the first target, save some money and then change your stop-loss order to an entry order.
For inquiries, please leave a comment.
We have a trend to hold above the Moving Average 100.
Entry price: 3696.
First target: 3764.
Second target: 3826.
Third target: 3904.
Don't forget a simple thing: ease and capital.
When you reach your first target, save some money and then change your stop-loss order to an entry order.
For inquiries, please leave a comment.
Thank you.

ETH on the 1H and the 0.236 Fib level
Could be a retest. Could be a fakeout. Could be the start of a move down.
RSI and MACD are both dropping.
SMA < MLR < BB Center confirms a downtrend.
50MA is sitting below the Fib level.
200MA is far below at $3,400, but rising quickly.
If tonight’s candles start closing under the Fib level, the warning gets louder.
If not, more upside remains likely.
Always take profits and manage risk.
Interaction is welcome.
Ethereum: Breakout Holds Strong | Next Targets $4K, $7K+Last week, three major crypto bills cleared the U.S. House of Representatives—and Ethereum (ETH) is emerging as the biggest winner from this legislative momentum.
ETH recently broke out of a rounding bottom pattern and hasn’t looked back. Momentum continues to build, and it’s now outperforming most other major assets.
📈 Technical Highlights:
✅ Short-term target: $4,000
✅ Long-term potential: $7,000–$8,000
🛡️ Key support: $2,700–$2,800 (bullish as long as this holds)
📣 Takeaway:
Ethereum’s breakout remains intact. Pullbacks into support could offer high-probability setups for swing traders and long-term investors.
#Ethereum #ETHUSD #Crypto #Trading #TechnicalAnalysis #CryptoTrading #EthereumPrice #Altcoins #Bullish #Breakout

ETH - FULL top-to-bottem AnalysisHere is the full analysis for CRYPTOCAP:ETH as requested 🫡
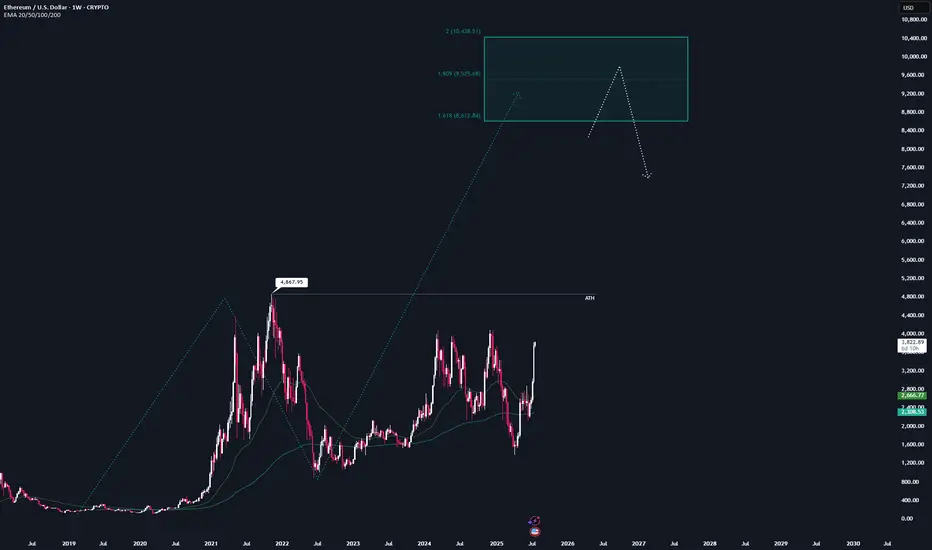
Weekly Time-frame:
We currently have one potential bullish structure for this cycle, which could take ETH into the $8,600–$10,400 price range.
This sequence gets activated once we break the all-time high at $4,867.
That area also marks my maximum target for this cycle — anything beyond that is pure maga FOMO, and I’m not going to gamble on some “super cycle” narrative.
At the weekly level, I wouldn’t recommend making additional buys in the current price range.
If you're still sidelined at this point, you should honestly reflect on your positioning this cycle — we’ve been given plenty opportunities to enter at good prices.
Daily Chart:
Around 1.5 weeks ago, we finally broke through the major resistance at $2.8k, which has been the key level to watch for the past two years.
That breakout also activated a bullish structure, targeting the $4,500–$5,100 range — which aligns with new all-time highs.
However, a retracement before reaching the target zone is always possible, and any pullback should be viewed as a gift for long entries.
I’ll be placing 4 long orders at each Fib level within the orange B–C retracement zone, each with a stop-loss just before the next level.
The key resistance to watch now is around $4k — once we break above that, hitting the target zone becomes highly likely.
Local price action:
Currently, no valid structures can be identified on the lower timeframes.
However, if valid bearish structures appear on the 1H or 4H charts, I’ll consider them for hedge short opportunities.
Summary:
All in all, waiting is the best strategy right now.
I wouldn’t recommend buying in this region anymore — and it's still too early for valid short setups.
Hope this analysis was helpful for at least one person ❤️
Thanks for reading,
Cheers!
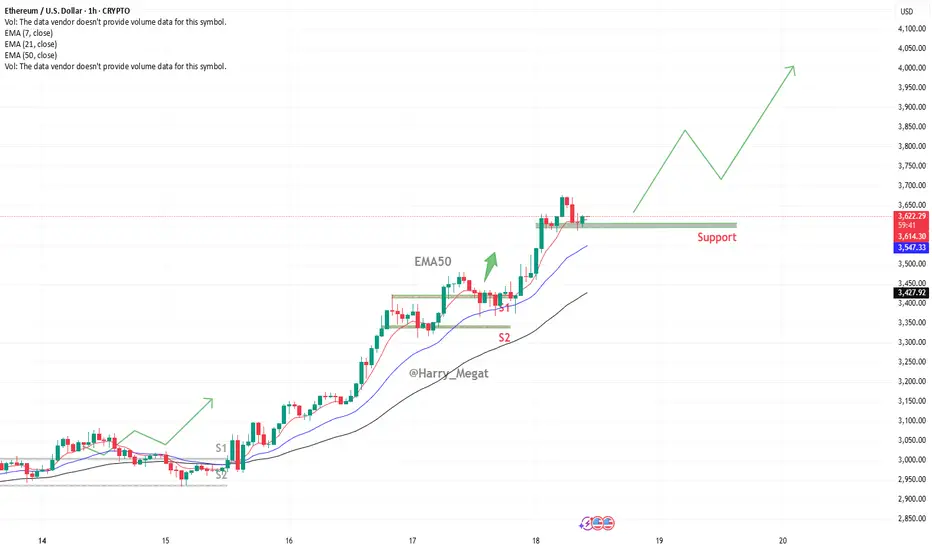
Ethereum (ETH/USD) Chart AnalysisEthereum (ETH/USD) Chart Analysis
**Trend Overview:**Ethereum (ETH/USD) Chart Analysis
* The chart shows **strong bullish momentum**, with Ethereum maintaining an upward trend of **higher highs and higher lows**.
* The price is currently around **\$3,618**, well above the key moving averages:
* **EMA(7): \$3,610**
* **EMA(21): \$3,539**
* **EMA(50): \$3,419**
**Support Levels:**
* The recent pullback found support at the **\$3,570–\$3,600 zone**, which is now acting as a **key horizontal support**.
* Below this, **EMA 21 (\$3,539)** and **EMA 50 (\$3,419)** offer additional dynamic support zones.
* Marked support areas **S1 and S2** also highlight previous breakout zones that could act as strong demand levels if retested.
**Bullish Outlook:**
* As long as ETH stays **above the support zone**, the bullish trend is likely to continue.
* A bounce from the current level could lead to a **retest of \$3,740**, followed by a move toward the **\$4,000 target** shown by the projected green path on the chart.
**Indicators & Sentiment:**
* Price respecting the EMA lines confirms **strong buyer interest** on pullbacks.
* No visible bearish divergence, and the chart structure favors **trend continuation**.
**Conclusion:**
Ethereum remains in a **bullish structure**, with strong support around \$3,570–\$3,600. As long as it holds above this zone, the next upside targets are \$3,740 and potentially \$4,000. A break below the EMAs would signal weakness, but for now, momentum supports continued gains.
ETHUSD FORMED A BEARISH WEDGE. READY TO REVERSE?ETHUSD FORMED A BEARISH WEDGE. READY TO REVERSE?📉
ETHUSD has been moving bullish since July 9, forming the bearish wedge, supported by the bearish divergence. Today the price started to breakdown this pattern.
A bearish wedge is a bearish reversal pattern in an uptrend, where the price forms higher highs and higher lows within converging upward trendlines, signaling weakening bullish momentum and a potential downward reversal. To trade, identify the wedge with declining volume and confirm with RSI or divergence. Sell or short on a breakdown below the lower trendline with a volume spike. Set a stop-loss above the recent high or upper trendline. Target the wedge’s height projected downward from the breakdown or the next support level with a 1:2 risk-reward ratio.
The decline towards local support of 3,500.00 is highly expected. If the bearish impulse gets strong enough, we may see the decline towards 3,000.00 support level.

Ethereum Price Target $3,120 by Sunday?Ethereum short position Price Target $3,120 by Sunday ? Negative divergence on the hrly RSI.
Exhausted the 15 minute positive divergence when bouncing off the EMA 200 on the 1 Hour chart. First profit target is $3,350 second is $3,120. I am usually wrong with my estimations... I would recommend the opposite. So go long!


ETH Ready to Pop!ETHUSD is once again testing the upper boundary of a long-term symmetrical triangle on the monthly chart. This pattern has been forming since the 2021 peak, showing consistently higher lows and lower highs. Previous breakouts from similar consolidation patterns (2017 and 2020) led to massive rallies. With the current monthly candle showing strong bullish momentum, a confirmed breakout above this structure could mark the beginning of Ethereum's next major bull run. Keep an eye on the breakout level for confirmation.
Cheers
Hexa

ETH BUY SETUP ,Bought From $3620ETH BUY SETUP
Currently $3620
Bought From $3620
(Trading plan If ETH go down
to $3520 will add more longs)
Expecting target $3715 OR ABOVE
In the event of an early exit,
this analysis will be updated.
Its not a Financial advice
