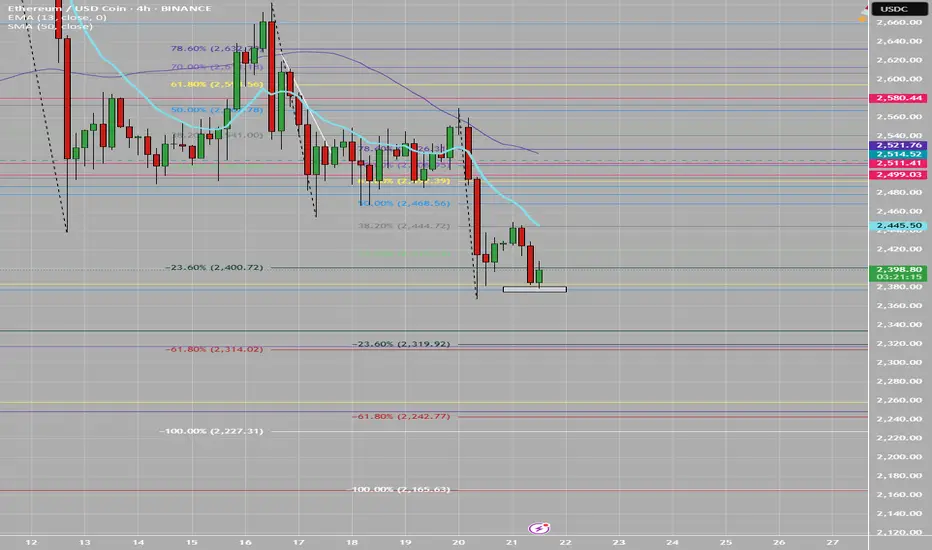
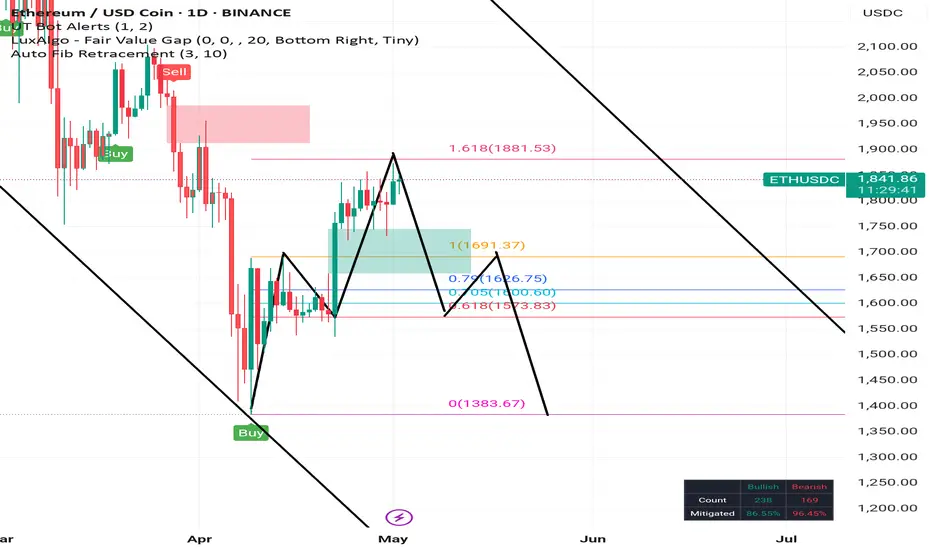
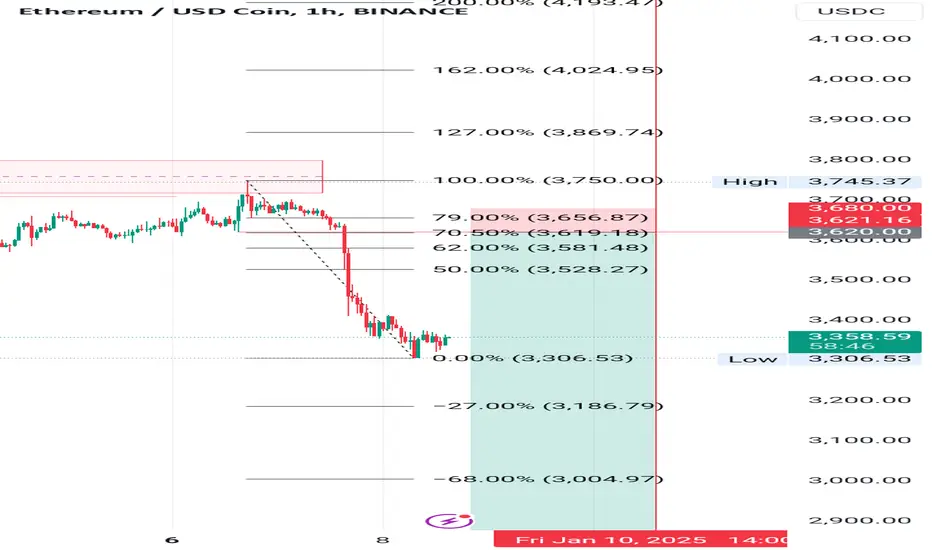
Longing ETH hereusing fibonacci, i think it go up from here in my humble and correct opinon. or fails this level and nuke further idk
ETHUSDC trade ideas
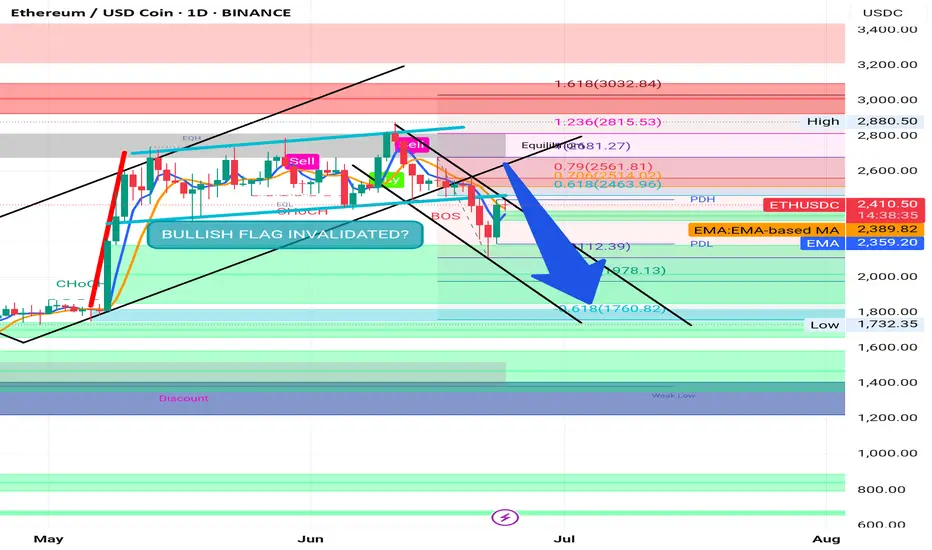
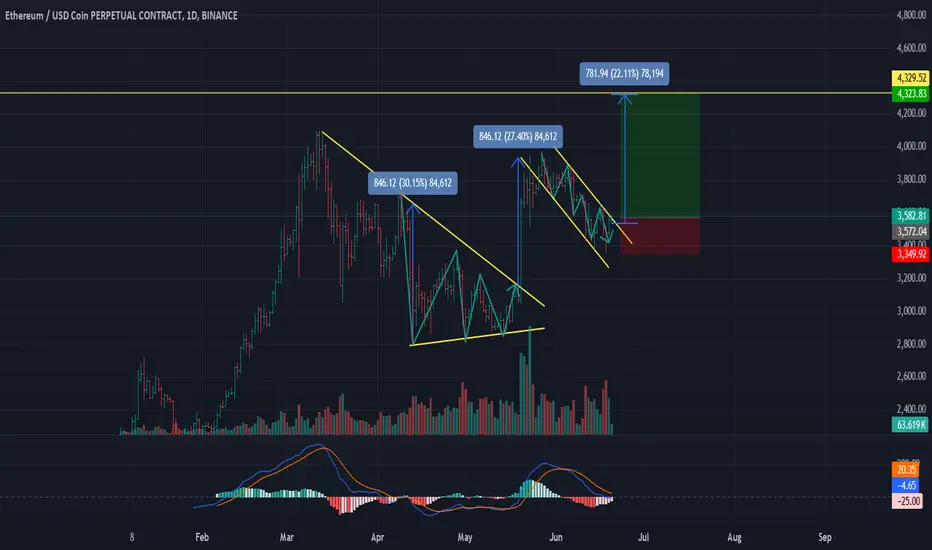
ETHEREUM Bullish Flag Cancelled?BINANCE:ETHUSDT
Predicting cryptocurrency prices, including Ethereum (ETH), for the short term like "next week" is highly speculative and subject to rapid change due to market volatility, global economic factors, and news events. However, I can provide a summary of recent analysis and upcoming factors that might influence Ethereum's price in the coming week.
Current Landscape & Recent Trends:
* Price Fluctuations: Ethereum has experienced significant volatility recently. As of June 24, 2025, ETH is trading around $2,260 - $2,400. There have been declines over the past week and month.
* Geopolitical Tensions: Geopolitical events, particularly in the Middle East, have been cited as a factor influencing recent crypto market dips, including Ethereum.
* Whale Activity: Despite recent price drops, some reports indicate that Ethereum whales (large holders) are not showing signs of significant selling, which could be a positive long-term signal.
* Technical Indicators:
* Some analyses suggest ETH found support around $2,110 and could eye a recovery.
* Resistance levels are noted around $2,500 and potentially higher towards $2,850.
* Other analyses point to bearish momentum with indicators like the MACD and RSI in certain timeframes.
* Long-Term Bullish Sentiment: Despite short-term fluctuations, some analysts maintain a long-term bullish outlook for Ethereum, citing its fundamental utility and potential for further growth.
Potential Influencing Factors for Next Week:
* EIP-7782: This Ethereum Improvement Proposal aims to significantly reduce block proposal, attestation, and aggregation times, potentially making the network faster and more efficient. Positive developments or news around this could be bullish.
* ETF Inflows: The ongoing interest and inflows into Ethereum ETFs could provide a sustained demand for ETH.
* Broader Market Sentiment: The performance of Bitcoin and the overall cryptocurrency market will heavily influence Ethereum's price. If Bitcoin sees a strong recovery, Ethereum is likely to follow.
* Macroeconomic News: Any major global economic news, inflation reports, or central bank decisions could impact investor sentiment towards riskier assets like cryptocurrencies.
* Geopolitical Developments: Continued or escalating geopolitical tensions could lead to further risk-off sentiment in the market.
General Outlook:
Some predictions indicate that Ethereum could see a slight increase next week, with some forecasts suggesting it could reach around $2,426.44 based on a 5% predicted growth rate. However, there are also warnings of potential further declines if key support levels are not held, with some analysts even suggesting a possible drop towards $1,800.
Important Disclaimer:
These are just predictions and observations based on available information. The cryptocurrency market is extremely unpredictable, and actual prices can deviate significantly. Do not consider this financial advice. Always conduct your own research and consider consulting with a financial professional before making any investment decisions.
Scalp ethShort term scalp probability very high so everything is goin to plan you can still catch other moves or probably set a limit atbechb point with tight stop loss
Good luck
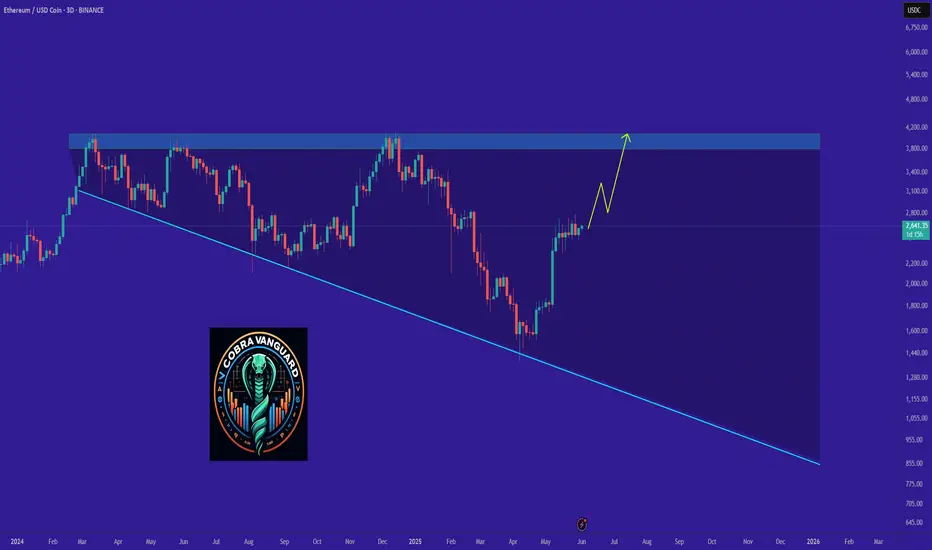
"ETH - Time to buy again!" (Update)The ETH will increase $2K and reach to the top of the wedge in the coming weeks .
Best regards CobraVanguard.💚
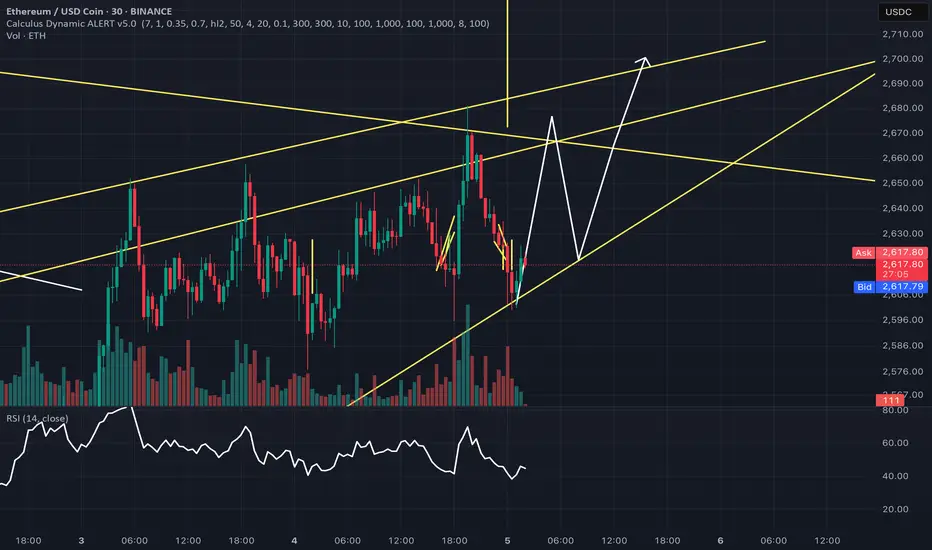
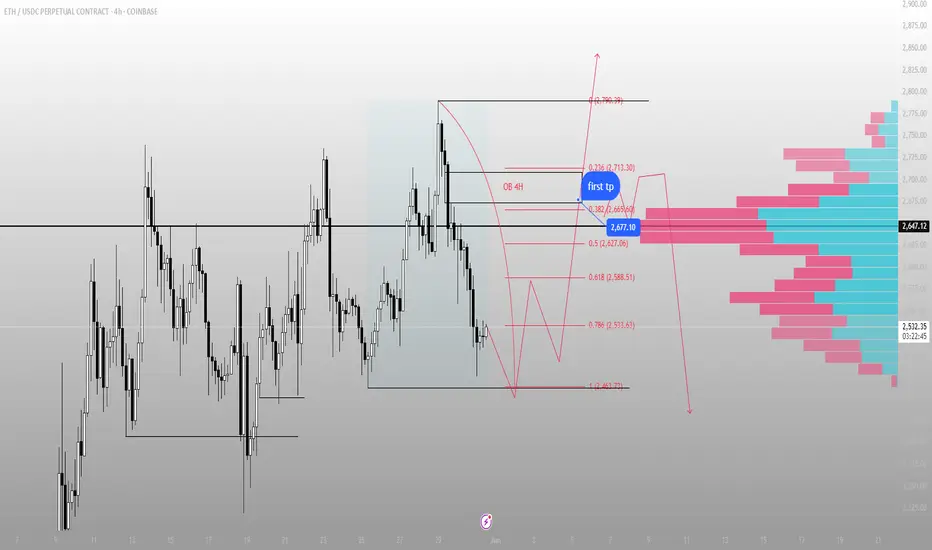
They thought ETH was breaking down. I saw the setup buildingThis ETH move has nothing to do with fear. It's engineered delivery.
We swept the local range low, tapping directly into the 1.0 extension around 2,463 — right at the edge of a thin volume node. That’s where Smart Money accumulates, not where it panics.
I’ve seen this structure play out too many times:
Consolidation under an old high
Expansion that traps late buyers
Retracement right back into a 4H OB + 0.786 level (2,533 zone)
Then, manipulation meets inefficiency — and price delivers
From here, I’m expecting a move toward the first objective: 2,677. That’s the .382 retrace sitting just above a HVN and right under the 4H OB. A perfect draw. Not random — designed.
Above that, the volume imbalance between 2,677 and 2,713 becomes the magnet. Price will fill it or reject it clean — but either way, that’s where liquidity sits.
Key levels I’m watching:
🚀 Entry from OB rejection around 2,463–2,533
🎯 First TP: 2,677 / Next zone: 2,713
❌ Invalidation: 4H close through 2,463 with velocity
This isn’t reactionary trading.
This is watching price deliver exactly where it should.
Structure speaks louder than any signal group.
ETHUSDT — Wyckoff Accumulation: Is the Reaccumulation Complete?
📍 Timeframe: 12H
📍 Exchange: BYBIT
Structure breakdown (based on Wyckoff phases):
🔹 PSY (Preliminary Support) — Around $1,490
🔹 SC (Selling Climax) — Major volume spike and capitulation
🔹 AR (Automatic Rally) — Strong bounce to around $3,700
🔹 ST (Secondary Test) — Retests near $2,500–$2,700
🔹 Spring — Final shakeout below support, bottom confirmed near $1,490
🔹 Test — Successful retest of Spring zone with diminishing volume
🔹 LPS (Last Point of Support) — Local higher low forming base
🔹 SOS (Sign of Strength) — Breakout above resistance, early confirmation
🔹 BU/LPS — Potential pullback to previous resistance (~$4,030) acting as support
📌 What to watch:
Spot entries on dips (if Test holds).
Margin exposure reasonable — ideal setup if we get 1 more retest.
Breakout above $4,000–$4,200 = likely signal for markup phase (Phase E).
📈 Upside target scenario: $6,000+ by Q4 if Wyckoff structure plays out.
🔔 Not financial advice. Always manage your risk.

Ethereum: Correction to $1,300–$1,500 and Rise to $2,500–$2,800#Ethereum Price Analysis: Correction to $1,300–$1,500 Before Potential Rise to $2,500–$2,800
Let’s break down why Ethereum (ETH) might correct to the $1,300–$1,500 range and then potentially rise to $2,500–$2,800 (with increased risk beyond that).
Technical Analysis
On the ETH/USDC 5-day timeframe chart from Coinbase, key points confirm a correction to $1,300–$1,500:
1. Correction Target: $1,300–$1,500 ("Coinbase orders")
• Limit orders were placed on Coinbase before the drop.
2. Hyperliquid Liquidation Map
• According to the Hyperliquid Liquidation Map, the liquidation level for long traders is at $1,337.00, within the target zone of $1,300–$1,500.
• A price drop to this level could trigger a cascade of liquidations, and market makers might accumulate positions at the lowest prices, specifically in the liquidation area.
3. Elliott Waves
• We’re completing the 5th wave and starting to form a reversal. This event will roughly coincide with the S&P 500’s reversal.
What Event Could Trigger the Correction?
• An expected Bitcoin correction to $70,000–$76,000 could trigger Ethereum’s drop, as the altcoin market historically follows BTC.
• I’ve previously shared this Bitcoin idea; we’re waiting for it.
Potential Targets for Ethereum Before a Global Downturn
Look for an exit point in this area: $2,500.00–$2,800.00
➖ This is approximately the 61.8% Fibonacci level
➖ A significant area according to the Volume Profile
➖ Large sell orders on Binance at $2,500, $2,800, and $3,000
➖ On Coinbase, they’re getting smarter and splitting orders into 500–600 ETH.
➡️ In Summary for Ethereum
This makes the $1,300–$1,500 range attractive for buying the dip.

ETH ,Head&Shoulders is coming .ETH ,Head&Shoulders is coming .
It seems that from next Wednesday we going short.
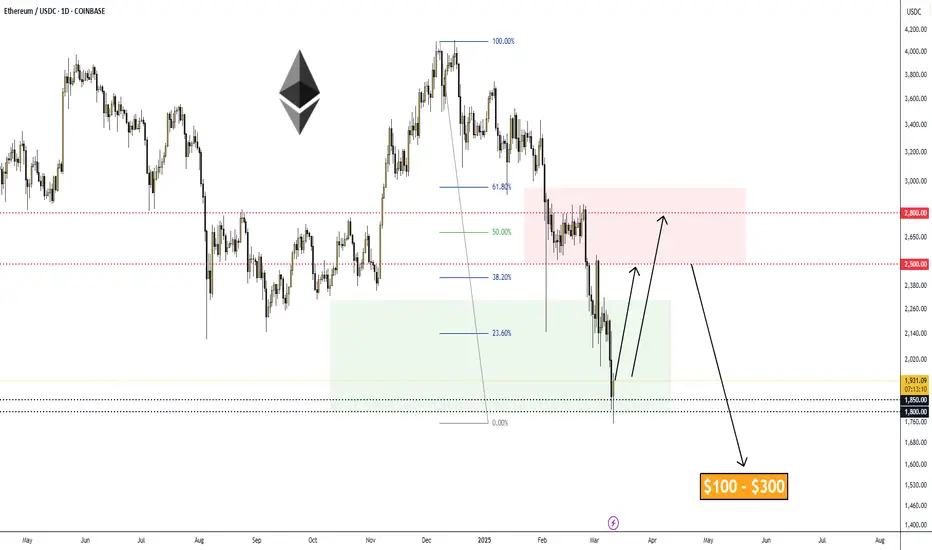
Ethereum Next up: a correction to $2,500-$2,800Before Idea:
After:
Ethereum targets reached. Coinbase orders played out perfectly at $1,800-$2,243.
Next up: a correction to $2,500-$2,800, then we dive into the bear phase and wait for a drop to $100-$300. :))
Ethereum: I expect it to reach $1,800-$2,243.Current situation with Ethereum: I expect it to reach $1,800-$2,243 based on Coinbase data.
Not going into too much detail, but in short: the stock market will drop, and Bitcoin and Ethereum will follow.
➖ Please avoid using leverage—the market is highly volatile right now.

ETH has broken its 2 year ascending trendlineI have been busy working on our AI Super Aggregator so have not been as active in the market but look at this chart, it looks not good. We have broken a 2 year ascending trendline, the only goodish news is that it looks like we are trying to assume a nearly horizontal channel versus some steep descending channel.
Since we are at the bottom of that new channel I would expect some reprieve from the current descent but a good chance its just enough to come up and prove our old ascending channel as resistance before potentially heading back down to retest the bottom of channel support.
Really most the broad crypto market looks not so great but some assets have been trying to break their descent, and for some assets they are so oppressed right now you have to wonder, how much lower can it go?
Be vigilant, the market has already been cruel and at the moment it looks like it still has more anger to blow off.

loning eth with leveragedidnt even drwa the fancy stuff on the chart. Im long here and few levels beneath it in a 5/2/1 sizing. I thimk it going up from there clearly
Short on ETHISDC
About 30 million dollars was removed from btc yesterday and it implied that we might see shorts for a while until the bull run is set to pick up again
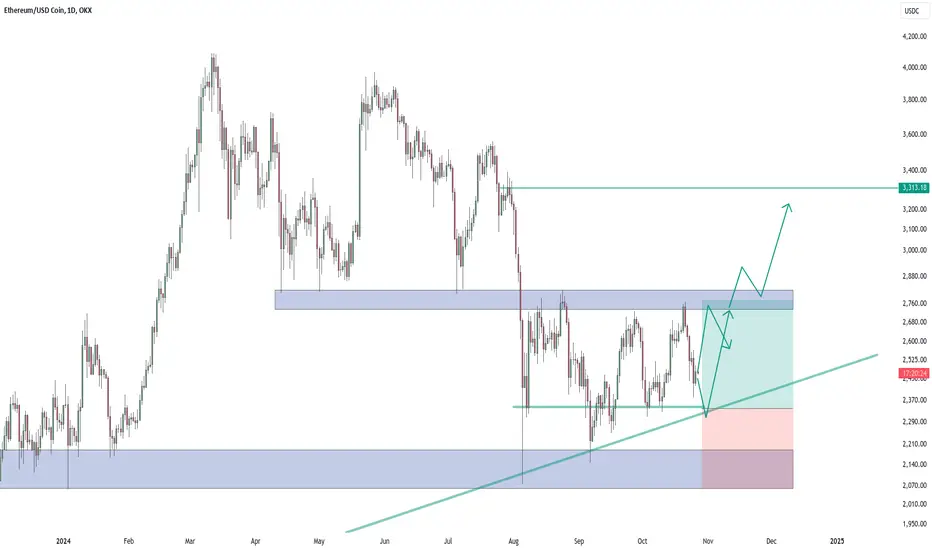
Waiting for a push lower to take us higherOKX:ETHUSDC could push lower into a longer running trendline.
This trendline has confluence with a support zone based on almost equal highs / double bottom.
Ethereum to break the structure after sfp longsMid term bullish looking chart with the target on ATH. Bottom is full of sell stops which could be withdrwan before going higher

Bear flag breakdownEthereum is breaking down again after consolidation
Will it break the swing low. I think so

ETH ETF to be traded soonETH price action looks bullish probably market is ready pump it for a while. It's perfect time to add ETH to your portfolio because huge amount of liquidity from tradfi is going to pour over it.
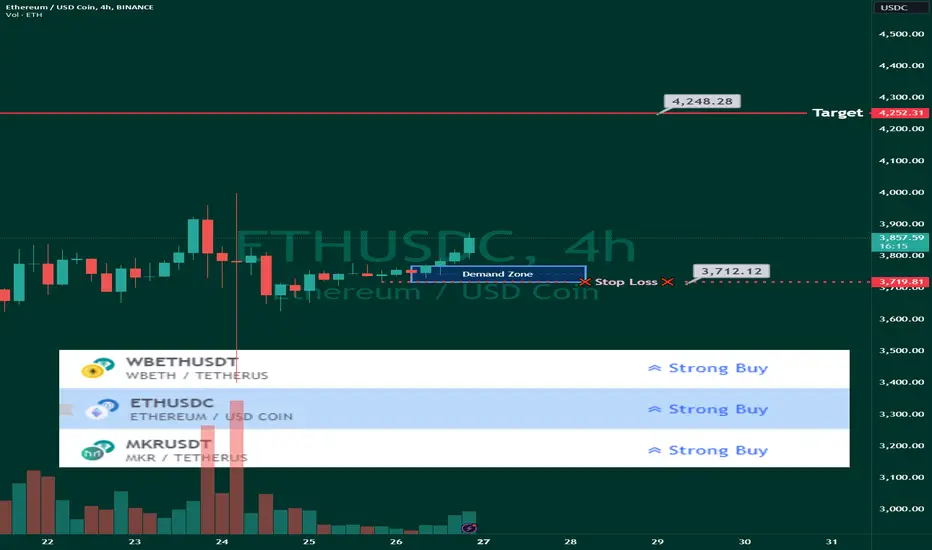
Long setup ETHUSDT👋Hello Traders,
Our 🖥️ AI system detected that there is an ICT Long setup in ETHUSDT for scalping.
Please refer to the details Stop loss, FVG(Buy Zone),open for take profit.
For more ideas, you are welcome to visit our profile in tradingview.
Have a good day!
Please give this post a like if you like this kind of simple idea, your feedback will bring our signal to next better level, thanks for support!
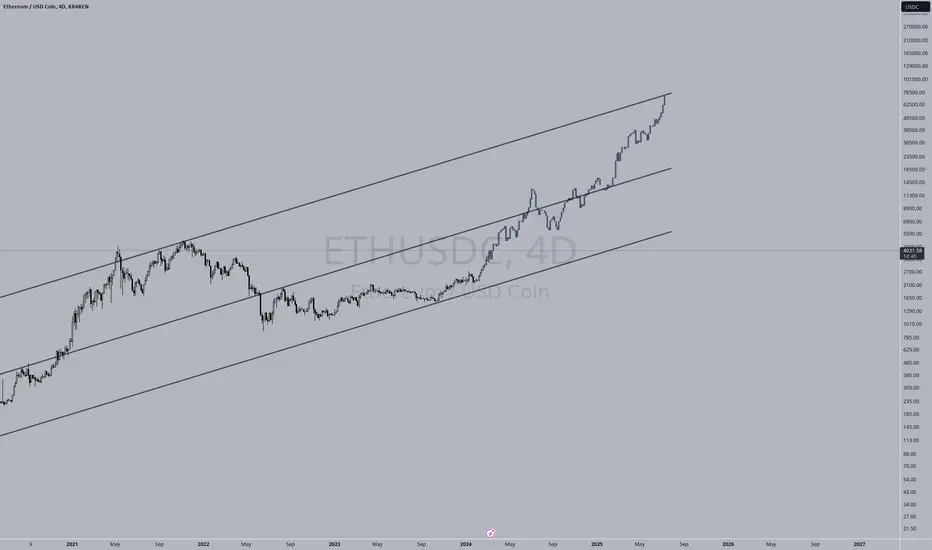
ETH Trend AnalysisCould this be ETH's price channel? If so, we could see prices over 10k this year, and even more unimaginable prices into 2025.
ETH IDEAThe market is buzzing with anticipation as Ethereum (ETH), a leading cryptocurrency, shows signs of a bullish trend. Experts predict a swift surge in its value, expecting it to break the $2,000 barrier in a remarkably short time. Following this milestone, projections suggest a continued upward trajectory, with ETH potentially exceeding $2,500, fueled by positive market sentiments and technological advancements in its blockchain network

Last massive leg up for ETH for 2023.ETH looks primed for one final leg up before retracing to previous supports from 2022. Then on it run to new all time highs!

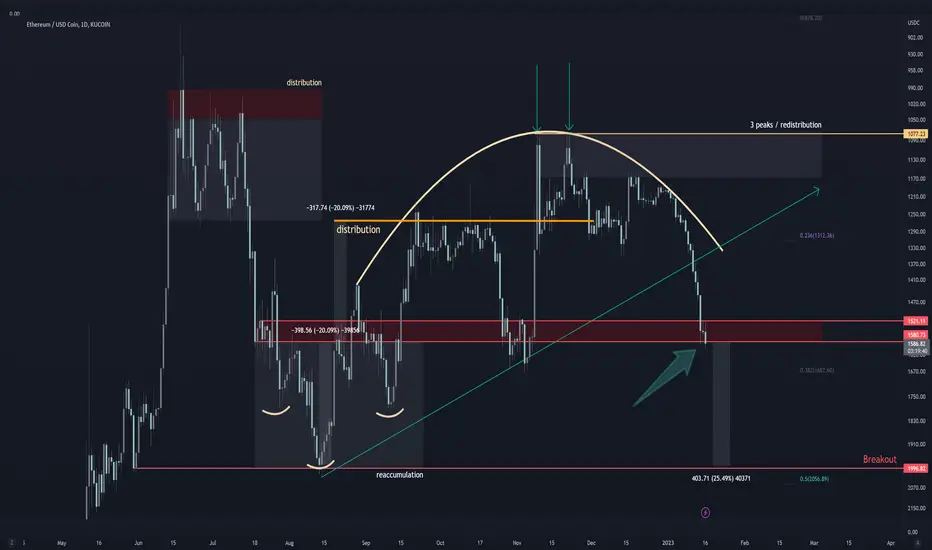
$ETH Ethereum Inverse DistributionIf we were to assume ETH was in an accumulation phase, referencing a potential Adam & Eve double bottom forming on higher time frames, we would expect to see "inverse" distribution on the lower time frames.
The adam and eve double bottom is essentially an accumulation range, and the breakout would be the top of the range or neckline. Ideally youd want to see the breakout point broken, and a checkback or retest.
This is an inverted chart breaking down the distribution and reaccumulation, which in turn would represent accumulation within the normal context of the chart.
This is a bias exercise and its too early to validate the adam and eve bottom, but underneath this inflection zone, it would make sense to go test the bottom of the range next on this chart. Which would imply a test of the neckline without the inverse context.
Just an idea for now, but it does appear we are setting up for a continuation.
Short ETHJust MY opinion But there is nothing healty in the market now....
institutions are building short positions.
Lets first Hit the 1200$ eth.
