Eth $2,500 Resistance — Will Harmonic Pattern Trigger a Rally?Ethereum Stuck at $2,500 Resistance — Will Harmonic Pattern Trigger a Rally to $3,400?
Ethereum has been trading in a prolonged consolidation phase around the $2,500 level — a region that has acted as resistance for several weeks. This extended period of sideways action could signify either accumulation or distribution, depending on what comes next. Technically, Ethereum remains capped below major resistance and has yet to confirm a bullish breakout. However, a deeper corrective move followed by a reclaim of key levels could activate a larger harmonic pattern, which presents a potential rally scenario toward the $3,400 region.
-$2,500 Resistance Zone: Price continues to stall at this critical area, signaling indecision
-$2,200 Support Level: A potential bounce zone where bulls may re-enter the market
-Harmonic Pattern Forming: Possible C-to-D leg expansion targeting $3,400, pending confirmation
Ethereum’s price has remained stuck around the $2,500 region, which has evolved into a high time frame resistance. Price has yet to show a decisive breakout, and this extended stay near resistance typically signals one of two things: stealth accumulation before a breakout, or distribution before a breakdown. The direction will become clearer once price action reacts to either a support retest or a break of the current range.
From a bullish perspective, a potential corrective move toward the $2,200 region — a well-established support — would provide a healthy reset for price action. This zone has previously acted as a demand area and aligns closely with the value area low. If Ethereum bounces from this level and reclaims the point of control (POC) around $2,550 — which also aligns with weekly resistance — it would be a strong structural signal.
This sequence of moves could activate a larger harmonic pattern currently visible in Ethereum’s price action. If valid, the market could enter the C-to-D expansion phase of the harmonic setup, targeting the $3,400 region. While this pattern remains speculative and unconfirmed, its structure is valid and aligns with both historical Fibonacci extensions and support/resistance dynamics.
For this pattern to be confirmed, Ethereum must hold the $2,200 support level and produce a strong reclaim of $2,550 backed by volume. Without this confirmation, the idea remains purely speculative and should be approached with caution.
If Ethereum corrects to $2,200 and reclaims $2,550, a bullish C-to-D harmonic expansion may play out targeting $3,400. Until then, ETH remains range-bound and capped under major resistance.
ETHUSDT.3S trade ideas
Why You Still Lose Money Even With Perfect AnalysisYour setup was on point, your entry was clean, your stop-loss was tight.
Everything looked perfect.
And yet, you still lost.
Maybe the real issue isn’t in your chart, maybe it’s in your head.
Hello✌
Spend 3 minutes ⏰ reading this educational material.
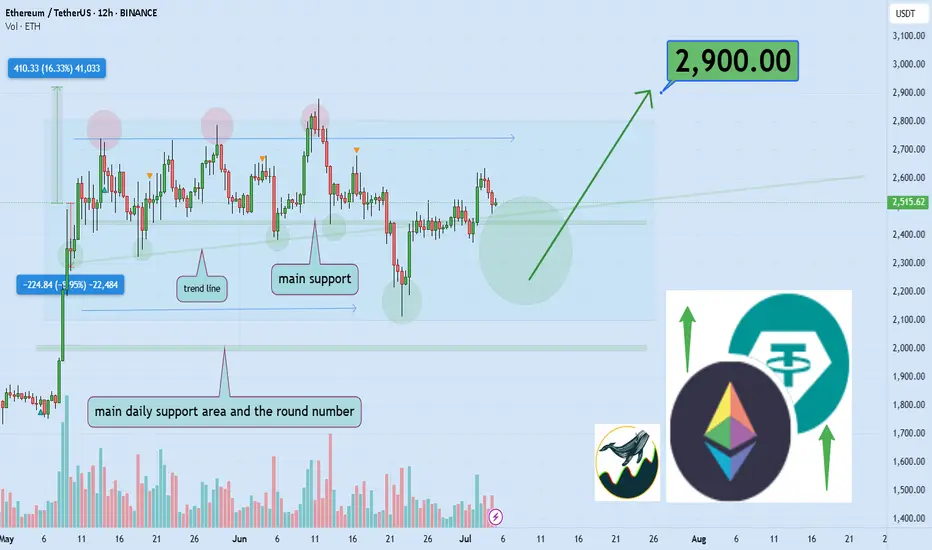
🎯 Analytical Insight on Ethereum:
BINANCE:ETHUSDT is currently trading inside a well-defined parallel channel 📈. It is approaching a key daily support level that coincides with an important ascending trendline. A breakout above this channel could lead to a bullish move, targeting at least a 16% gain with a primary resistance zone near $2900 🚀. Monitoring how price reacts around this area will be critical for confirming the next leg up.
Now , let's dive into the educational section,
🧠 Analysis Is Half the Game
Having a clean technical analysis doesn’t guarantee anything if your behavior ruins it.
Most traders change their minds mid-trade because of fear, hope, or noise from other sources.
Market psychology doesn’t always respect your Fibonacci retracement. You might be right and still lose because you couldn’t hold on to the plan.
🕒 Don’t Enter Before the Market Does
Timing is underrated. Many traders get in too early. Your analysis may predict a breakout, but price isn’t ready yet.
Zoom out. A solid setup on the 1-hour chart might need confirmation from the 4-hour or daily.
A great trade is not just where you enter, but when.
😤 It’s Not the Chart — It’s Your Mind
Many times, the chart setup is perfect. But when price wobbles a bit, you lose confidence.
Imagine this: a clean uptrend, higher highs forming, but a small retracement hits and you close the trade. Why? Fear. Not logic.
You lost not because of analysis, but because you couldn’t handle being right under pressure.
📊 TradingView Tools: More Than Just Indicators
If all you're using in TradingView are the typical RSI or MACD indicators, you're barely scratching the surface.
Tools like Bar Replay can simulate real-time reactions to past price action, not just for backtesting, but for testing your discipline under real psychological pressure.
Try this: pick a point where you lost money despite solid analysis. Use Bar Replay and “re-live” the chart without knowing what happens next. Was your entry early? Did you panic exit? Or did your stop-loss placement ignore structure zones?
Also, use the Long/Short Position Tool to visually plan your risk/reward, and adjust your bias if the chart structure doesn’t validate it.
For those wanting a deeper layer, add Volume Profile Fixed Range to identify value zones, where whales are active, and overlay it with your own trade setup.
TradingView isn’t just a charting platform. It’s a behavioral mirror. You don’t just look at the chart, it shows how you act when money’s on the line.
🎯 Your Stop-Loss is for the Chart, Not Your Emotions
If your stop-loss is placed based on what feels safe rather than key market structure, you’re not trading the chart. You’re managing anxiety.
Let structure dictate where your risk lies, not your nerves.
😬 Not Executing = Not Trading
If you don’t follow through with your own trade plan, your analysis is meaningless.
Did you cut early just because a big red candle scared you? Or because someone tweeted a bearish take?
That’s not discipline, that’s reactive trading. It has nothing to do with your original logic.
📉 Losses Are Part of Trading… But Not These Ones
There’s a difference between calculated losses and emotional mistakes.
The first is expected, even professional. The second will drain your account and confidence.
Take losses when the plan fails, not when your emotions freak out.
🔍 Reverse-Engineer Your Entry Logic
Next time you trade, take a screenshot and write down your full reasoning.
Why this entry? What did you see? How will you exit?
Later, go back and compare it to what actually happened.
This habit alone can fix more issues than a dozen trading books.
💡 Perfect Analysis ≠ Profitable Trading
Analysis opens the door, but execution and consistency keep you in the room.
Most traders think the problem is their indicator, but it’s usually the part of themselves that doesn’t listen to the indicator at the critical moment.
🧠 The Power of “Logged Experience”
The real difference between amateurs and veterans isn’t screen time. It’s tracked behavior.
Use TradingView’s built-in Note feature, place icons or comments on every trade setup, and keep a record of your actual thought process.
That feedback loop is gold. It builds self-awareness, the rarest edge in trading.
📺 Make It Visual to Make It Stick
Don't rely solely on indicators.
Use Chart Pattern Drawing Tools, head and shoulders, flags, triangles, and reinforce visual memory.
Also, by managing Visibility Settings, you can keep your charts clean while viewing different structures across timeframes.
The result? You start to see the story behind price, not just numbers.
🔚 Final Thought
If you're still losing money with accurate analysis, maybe it’s time to analyze your reactions instead.
TradingView gives you the tools, but the real upgrade is learning to trust your system under stress.
✨ Need a little love!
We put so much love and time into bringing you useful content & your support truly keeps us going. don’t be shy—drop a comment below. We’d love to hear from you! 💛
Big thanks , Mad Whale 🐋
📜Please remember to do your own research before making any investment decisions. Also, don’t forget to check the disclaimer at the bottom of each post for more details.
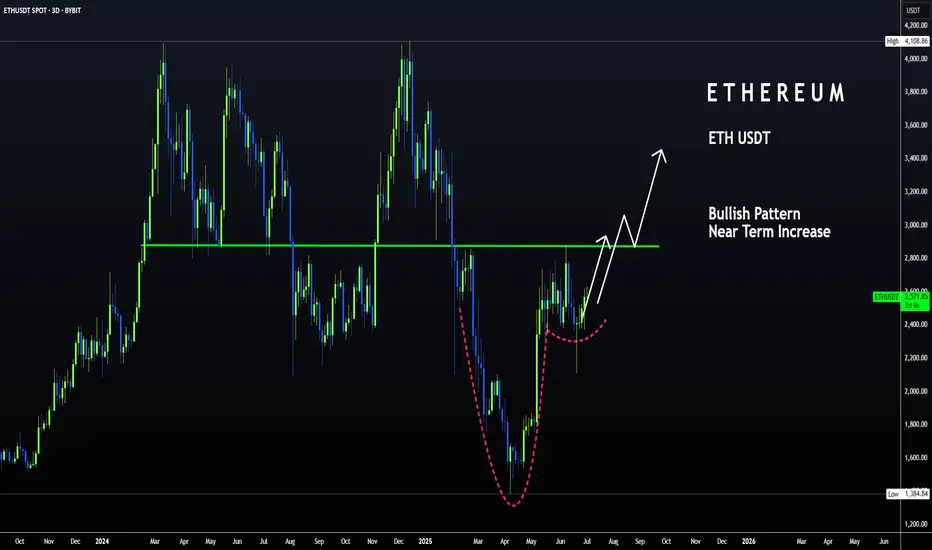
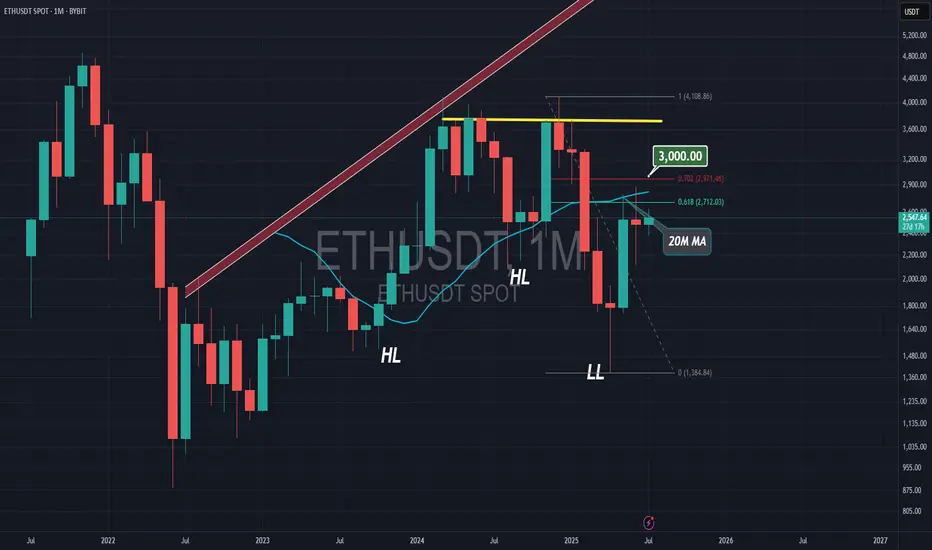
ETH | Bullish Pattern - Cup and Handle +15%A Bullish pattern is appearing on the Ethereum chart.
From a Cup and Handle pattern, we can easily expect atleast a 15% increase. This is true for the near term. A +15% would put us here:
Just under $3K we may see heavy resistance. This is also the neckline resistance, as it was the previous support for the breakout that ultimately led to a new ETH ATH.
_______________________________
BYBIT:ETHUSDT
Ethereum Analysis – Vitalik’s Gas Cap Proposal Adds PressureToday, I want to show you the possible moves for Ethereum ( BINANCE:ETHUSDT ) this week.
Please stay with me .
Let’s first take a look at the important news that has come for Ethereum in the last 24 hours :
Ethereum’s Gas Cap Proposal Sparks Concerns
Ethereum co-founder Vitalik Buterin recently proposed EIP-7983 , introducing a gas limit cap to prevent potential DoS (Denial of Service) attacks on the network.
Bearish Takeaways:
This proposal reveals a current vulnerability in Ethereum’s infrastructure. If gas limits grow unchecked, nodes may fail to sync, leading to possible network instability.
Imposing a gas cap could temporarily reduce transaction throughput, affecting DeFi protocols and NFT platforms that rely on Ethereum’s scalability.
The market tends to react cautiously to core protocol changes, and this uncertainty could trigger short-term selling pressure.
Bullish Counterpoints:
The cap aims to strengthen the network’s long-term stability against spam and DoS attacks.
It’s still in the proposal stage, with no immediate impact on users or network performance.
Conclusion:
While the long-term impact may be positive, the short-term uncertainty and exposed risks provide a bearish narrative for Ethereum, especially amid growing competition from alternative chains.
--------------------------------------
Now let's take a look at the Ethereum chart on the 4-hour time frame .
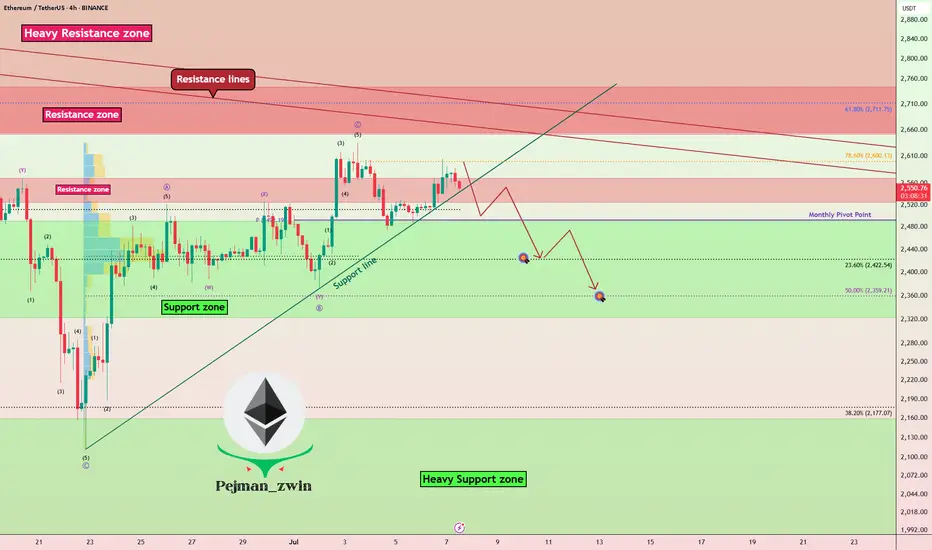
Ethereum is currently trading near the Heavy Resistance zone($2,929-$2,652) and Resistance lines , and is also trying to break the Support line .
In terms of the Elliott Wave theory , it seems that Ethereum has completed the Zigzag Correction(ABC/5-3-5) , so we can expect the next bearish wave .
I expect Ethereum to fall to at least $2,433 AFTER breaking the Support line, and if the Support zone($2,491-$2,323) is broken, we should expect further declines.
Second Target: $2,374
Note: Stop Loss (SL) = $2,689= Worst Stop Loss(SL)
Please respect each other's ideas and express them politely if you agree or disagree.
Ethereum Analyze (ETHUSDT), 4-hour time frame.
Be sure to follow the updated ideas.
Do not forget to put a Stop loss for your positions (For every position you want to open).
Please follow your strategy and updates; this is just my Idea, and I will gladly see your ideas in this post.
Please do not forget the ✅' like '✅ button 🙏😊 & Share it with your friends; thanks, and Trade safe.
Ethereum Faces Key Resistance: Potential Pullback AheadHello Guys!
What I see:
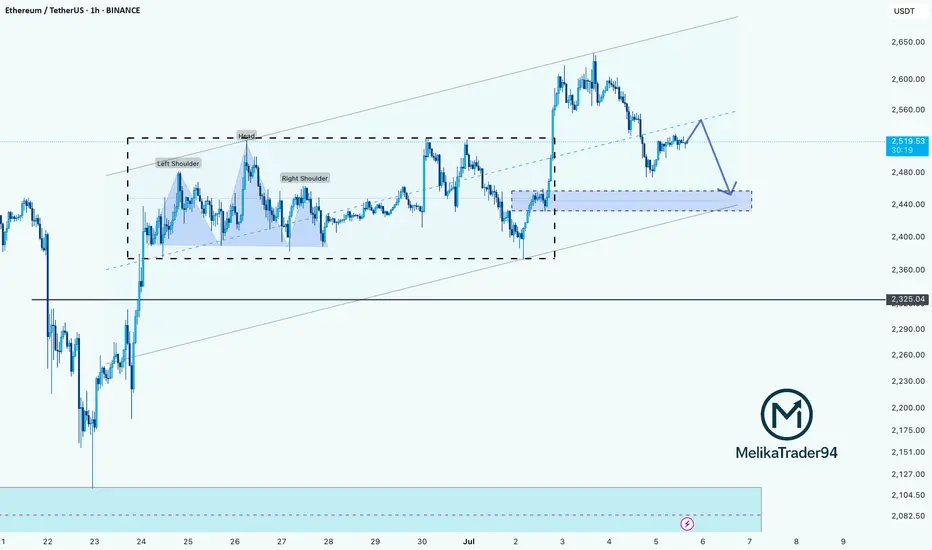
Head and Shoulders Pattern:
Left Shoulder: Formed
Head: Peak, followed by a drop.
Right Shoulder: Formed.
The neckline break around $2,450 initiated a downside move, confirming the bearish setup.
Current Price Action:
ETH is currently trading near $2,519, attempting to reclaim the broken neckline zone, which now acts as resistance.
The price action is showing lower highs, hinting at weakening bullish momentum.
Bearish Retest in Progress:
The chart shows an anticipated bearish retest of the support-resistance flip zone ($2,530–$2,550), with a probable rejection leading ETH back down toward the $2,440–$2,450 support zone.
Demand Zone:
A strong demand area is visible between $2,420–$2,450. Price may revisit this zone before making the next major move.
Trend Channel:
ETH is moving within an ascending channel, and the lower bound coincides with the highlighted demand zone.
________________________
Let's check this deja vu:
You can see that previously the price formed an H&S and after that did a hunting of the head! And after that price experienced a drop there! Same scenario here!
ETH SHORT SCALP ! to 2500
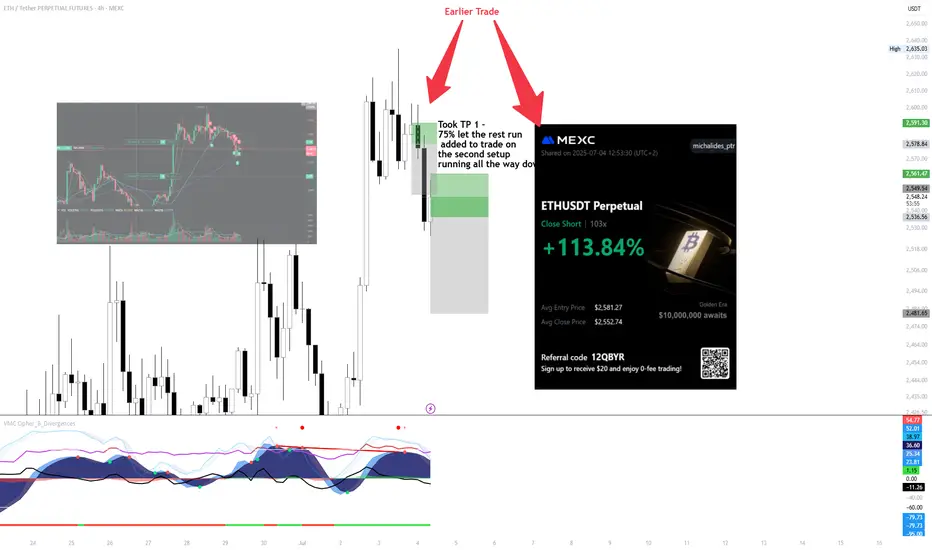
Executed an ETH short from the earlier setup — took 75% profit at TP1, then let the rest run.
Price pulled back into the secondary zone, added to the position with structure confirmation.
Let it roll into the next leg — clean execution, solid momentum follow-through.
+113.84% on the full move, managed with scale-out and conviction on the retest.
Patience paid. System did the work.
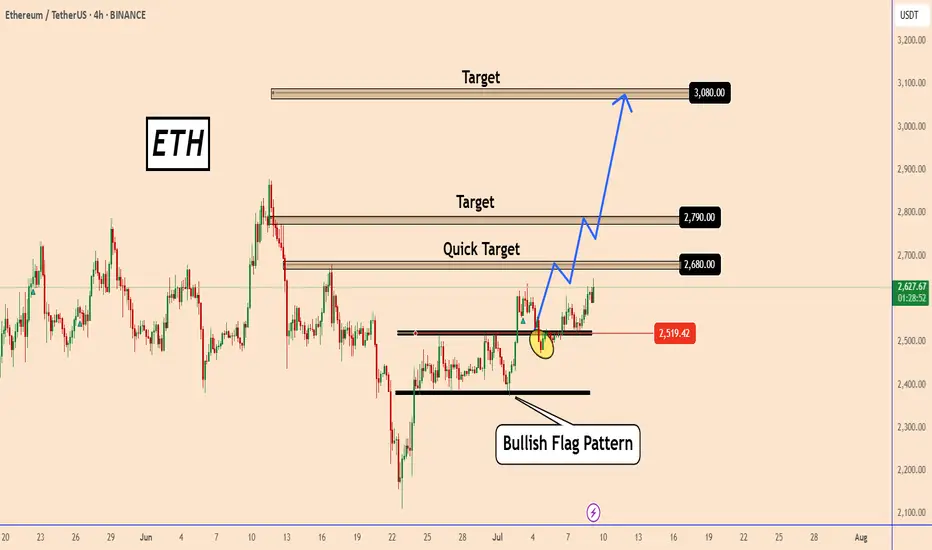
ETH Completes a Clear Bullish Flag Pattern! What’s Next?ETH Completes a Clear Bullish Flag Pattern! What’s Next?
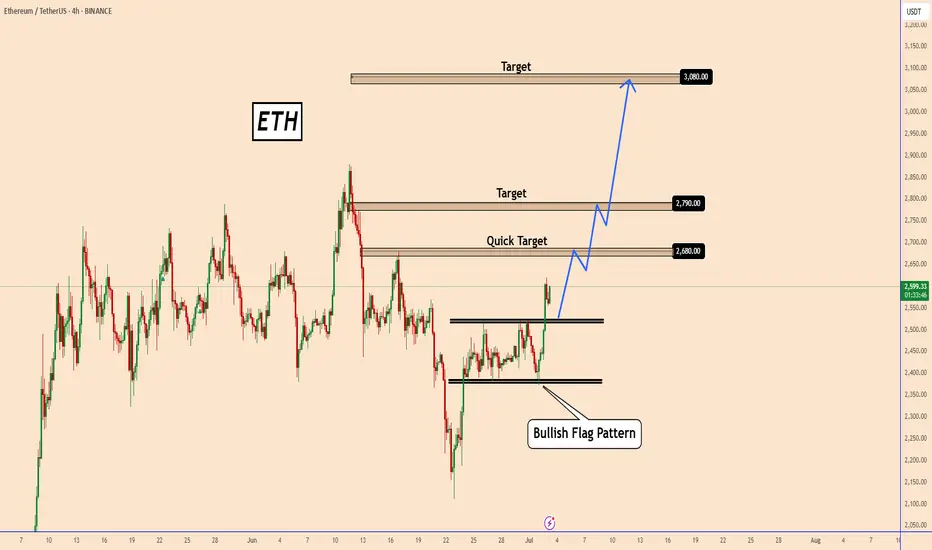
Yesterday, Ethereum completed a bullish flag pattern.
This is a clear signal that bulls are already increasing their long positions.
If this is not a false breakout, then ETH could start from a normal bullish move to a larger one.
Today’s NFP data and the US market's preparation for a long weekend before the 4th of July could support this bullish scenario.
Key Target zones: 2680, 2790 ,and 3080
You may find more details in the chart!
Thank you and Good Luck!
PS: Please support with a like or comment if you find this analysis useful for your trading day
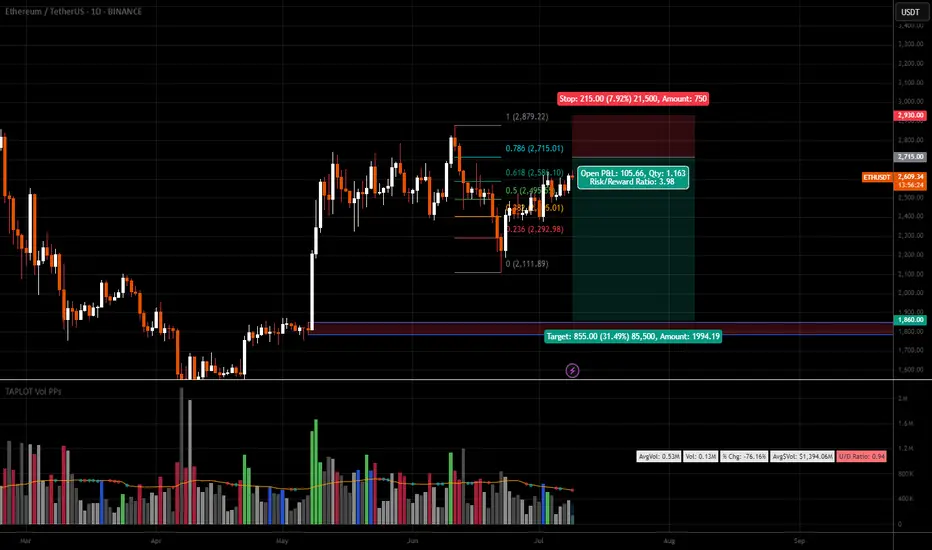
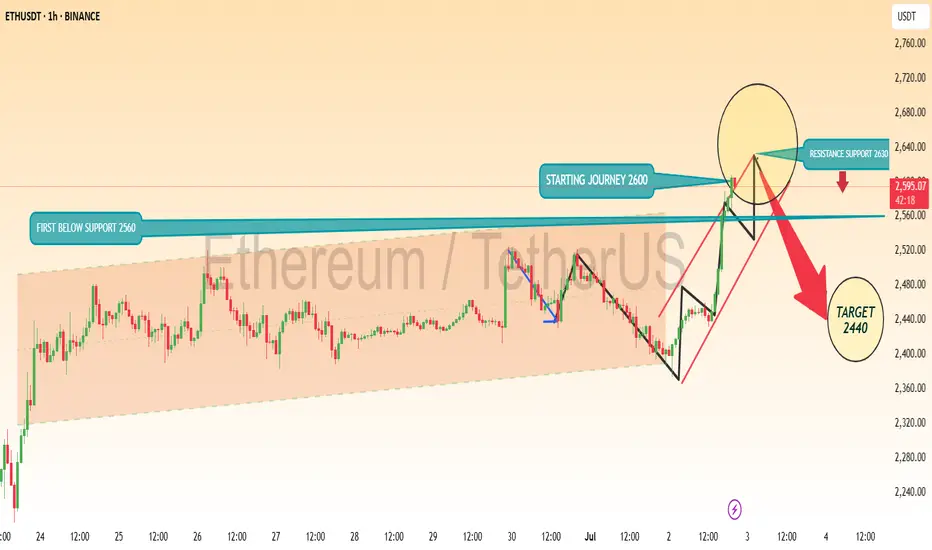
ETHEREM ETHUSD LONG TECHNICAL CHART IDEAEthereum (ETHUSD) Technical Outlook – Short-Term Levels and Potential Targets
📊 Key Insights:
First Below Support: 2560 USDT
Starting Journey: 2600 USDT
Resistance Zone: 2630–2650 USDT
Target on Breakdown: 2440 USDT
Market Structure:
After a period of consolidation between 2560 and 2600, ETHUSD has initiated a sharp upward move towards the resistance zone near 2630–2650. The chart projects a possible rejection from this resistance area, suggesting a potential pullback targeting 2440 if support fails to hold.
✅ Key Considerations:
Watch for price action confirmation around 2630–2650.
A sustained break above resistance could invalidate the short-term bearish scenario.
The target zone of 2440 aligns with prior support and could offer buying interest
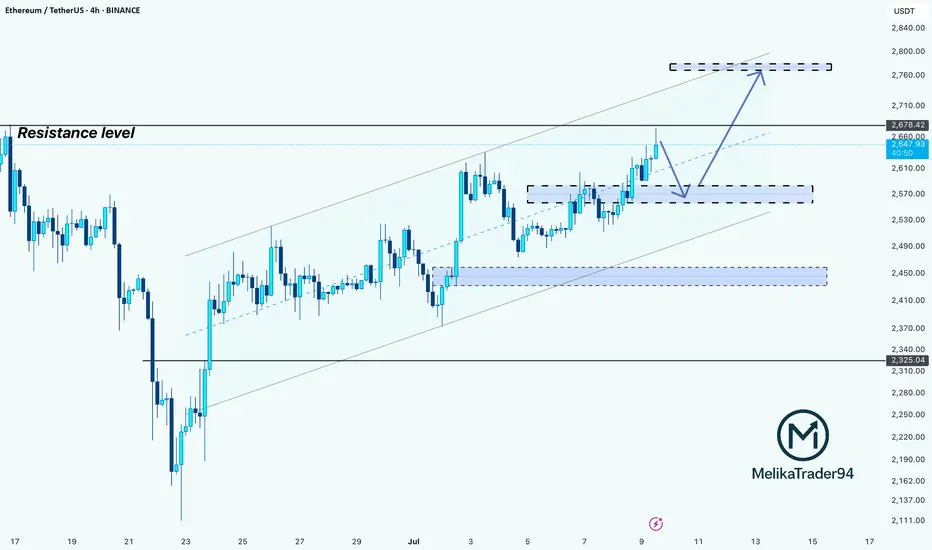
ETH Pullback Before Next Rally? Hello guys!
Ethereum is currently testing a strong resistance zone around the $2,678 level, which has previously acted as a key barrier. Price action has been climbing steadily within an ascending channel, indicating a clear bullish trend in play.
However, since ETH is right at the resistance, we could see a short-term correction or pullback toward the $2,560–$2,580 support range (highlighted zone), which also aligns with the midline of the channel and previous consolidation structure.
If this support holds, a healthy bounce from this area would likely push ETH toward the next bullish target around the $2,760–$2,800 zone, which sits near the upper boundary of the current channel.
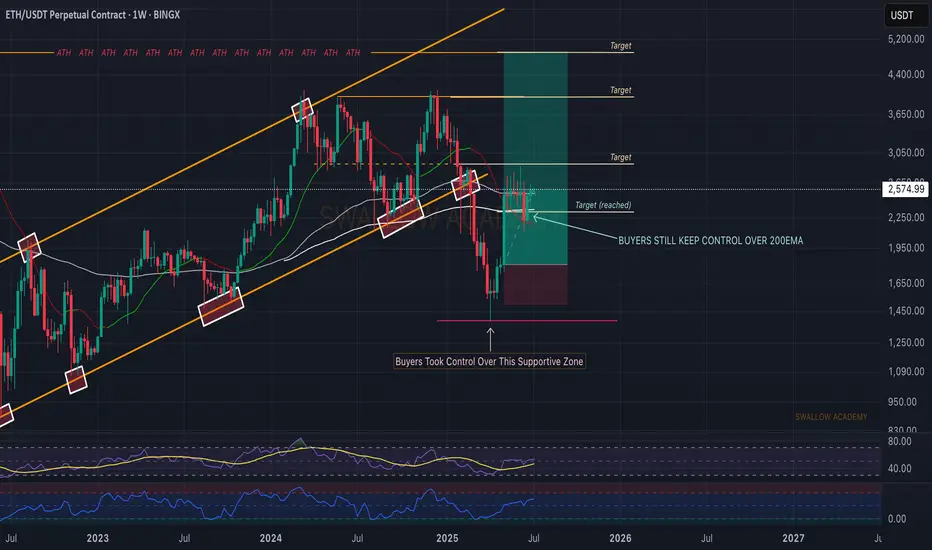
Ethereum (ETH): Still Cheap Don't You Think? | $2800 NextEthereum is still cheap compared to what is about to happen. Now saying "about to happen" is a little broad, saying as it might be weeks or months until we see the full potential of ETH but we are bullish for sure.
Bitcoin had its moment of money inflow and now money has to flow somewhere else, which should be ETH. This is the next stage for the bull market and that's what we are looking for.
Targeting currently $2800, but overall we want to see at least $4000.
Swallow Academy
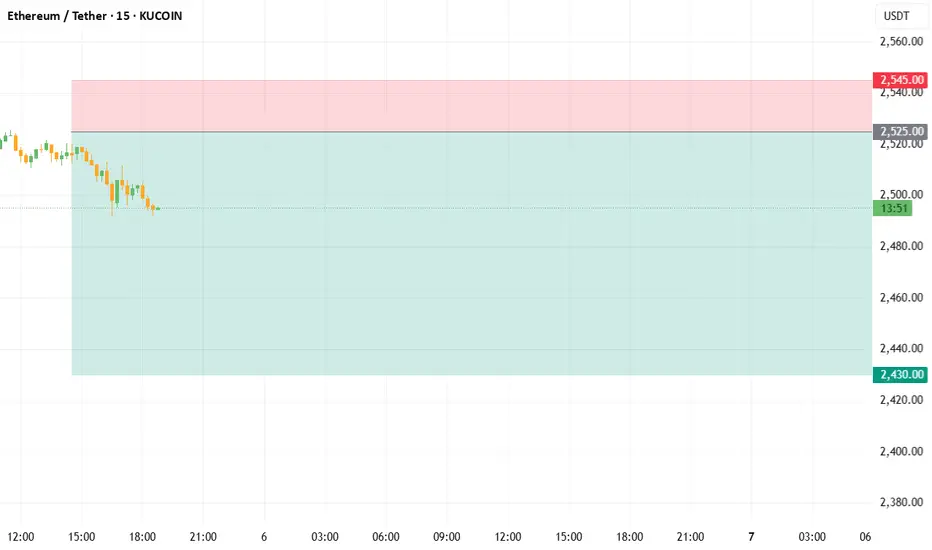
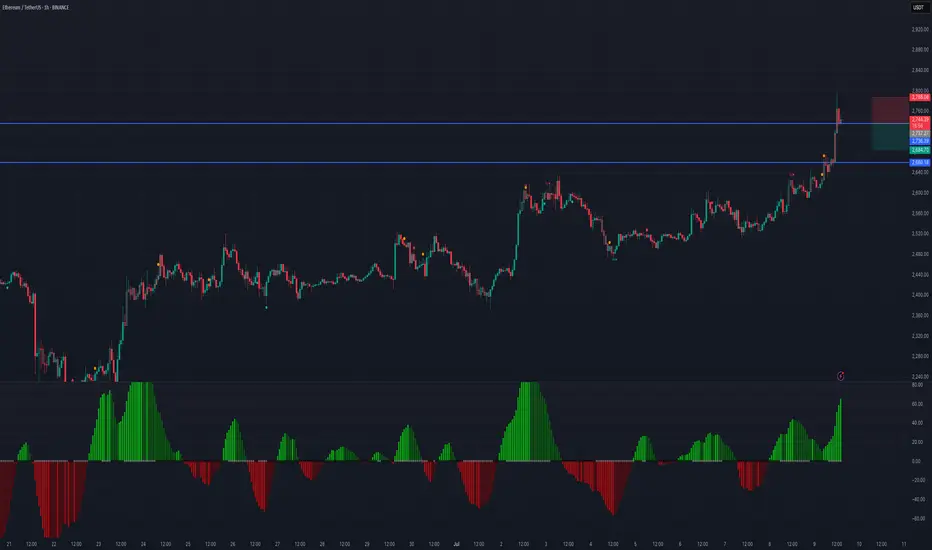
ETH SHORT LIMIT2510–2525 SHORT
TP - 2465 / 2430
SL - 2545
The old pending order is no longer valid, easy to mistakenly touch the high short, resulting in a reverse stop loss
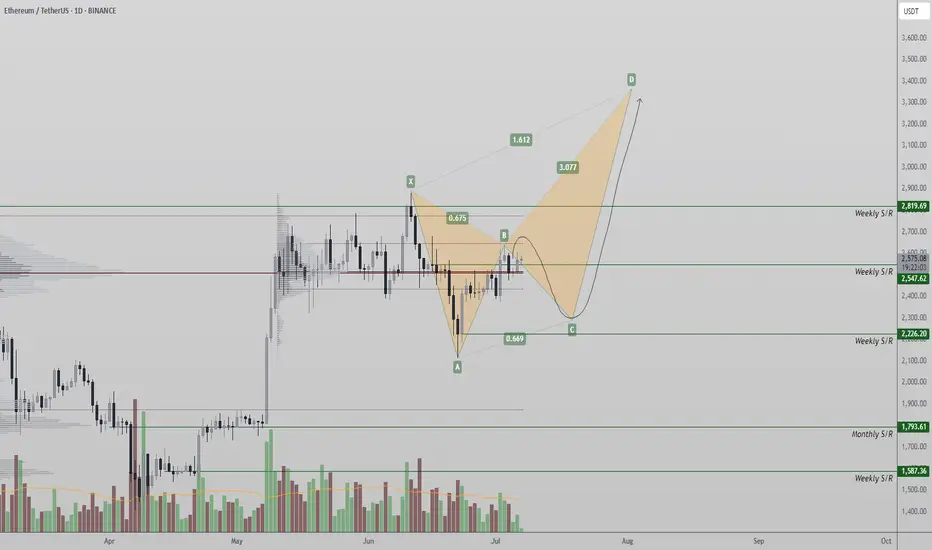
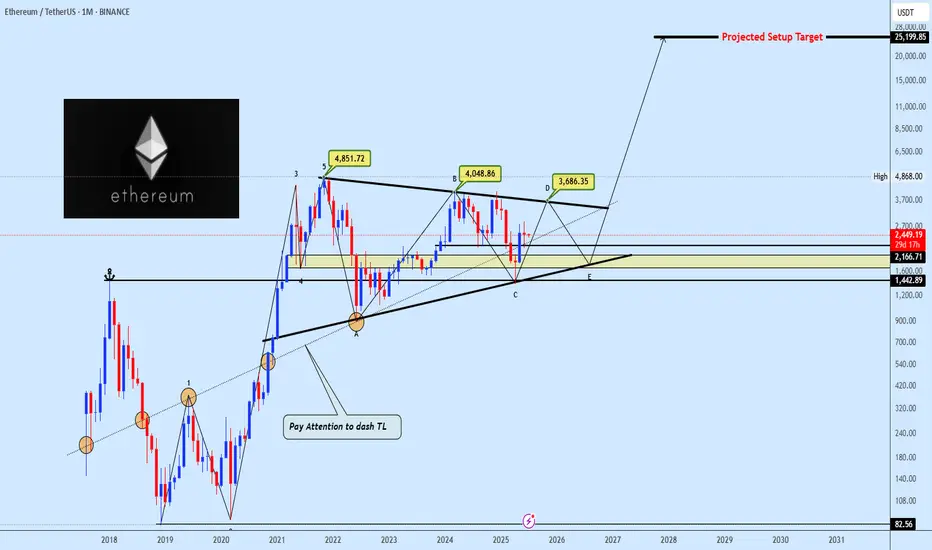
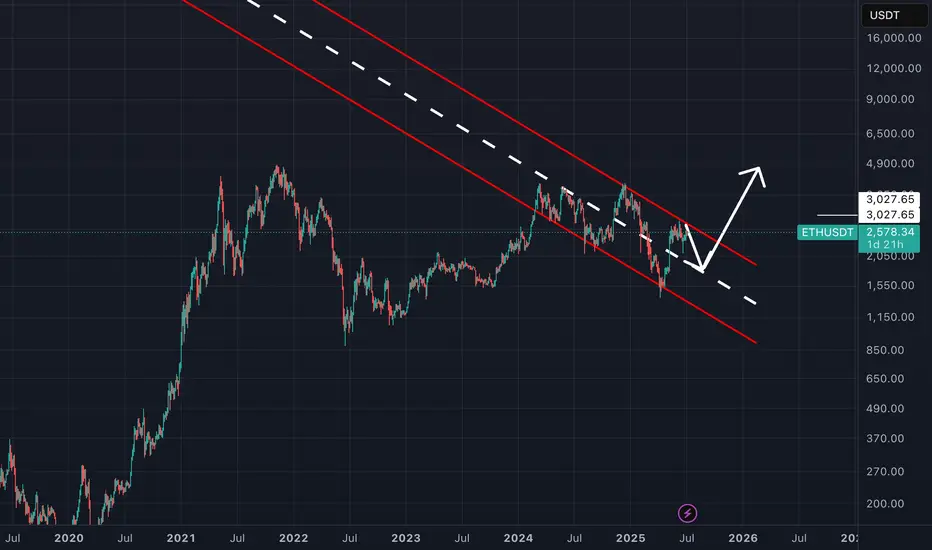
ETHUSDT Long Term Structure Signals Imminent ExpansionEthereum has been consolidating within a large-scale symmetrical pennant formation following its peak at $4,851. This macro structure, spanning several years, reflects sustained accumulation within a clearly defined corrective range, bounded by well-established trendline support and resistance.
After reaching its all-time high, ETH entered a structured correction that has unfolded into what appears to be an ABCDE wave pattern. Currently, price action is developing near point D, approaching the upper boundary of the pennant a crucial area that could define the next directional move.
In addition, the daily chart presents a developing Inverse Head and Shoulders (IH&S) pattern, with the neckline anchored around $2,855. This level is acting as a key resistance, temporarily halting ETH’s short-term upside. A confirmed breakout above the neckline would likely validate both the IH&S and the breakout from wave D, setting the stage for a potential expansion move toward the $6,000 target and beyond.
However, in the event of a temporary rejection at the neckline or pennant resistance, a retracement toward wave E becomes likely. This would bring price back into the $1,400–$1,800 support region a high-confluence demand zone that aligns with the long-term ascending trendline, previous breakout levels, and multiple historical reaction points. This zone may serve as a base for a strong bullish reversal.
Recent price behavior shows compressed volatility and increased buying interest on dips, reinforcing the possibility of an imminent directional breakout. A decisive move outside this macro structure may mark the beginning of a new phase of long-term price expansion.
Share your view with us in the comments, how do you see ETH playing out from here?
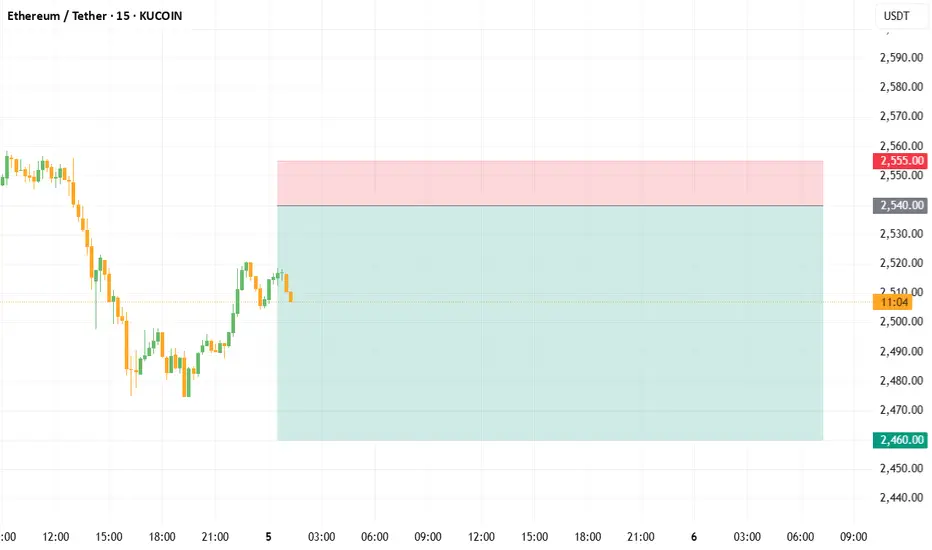
Wait for ETH to rebound to $2528-2542 and place a short order.Short
$2528~$2542
Take Profit
$2480, $2460
Stop Loss
$2555
If the price falls below $2510, do not chase short, wait for a rebound.
Ethereum in JULYEthereum should close above $3000 by the end of July to stay in the bull run, Monthly candle is so important now.
ETH Price Forecast: Keep Bullish Above 2519ETH Price Forecast: Keep Bullish Above 2519
Finally, ETH is holding strong above 2520. Over the previous days, ETH lost momentum and was about to invalidate the pattern, as it reached 2475.
However, the uncertain situation from geopolitical tension and tariffs is still supporting the bulls on the crypto market.
On the other hand, ETH still has room for growth and as long as the price respects this flag pattern, the chances of ETH rising further remain high despite the developments in BTC.
You may find more details in the chart!
Thank you and Good Luck!
PS: Please support with a like or comment if you find this analysis useful for your trading day
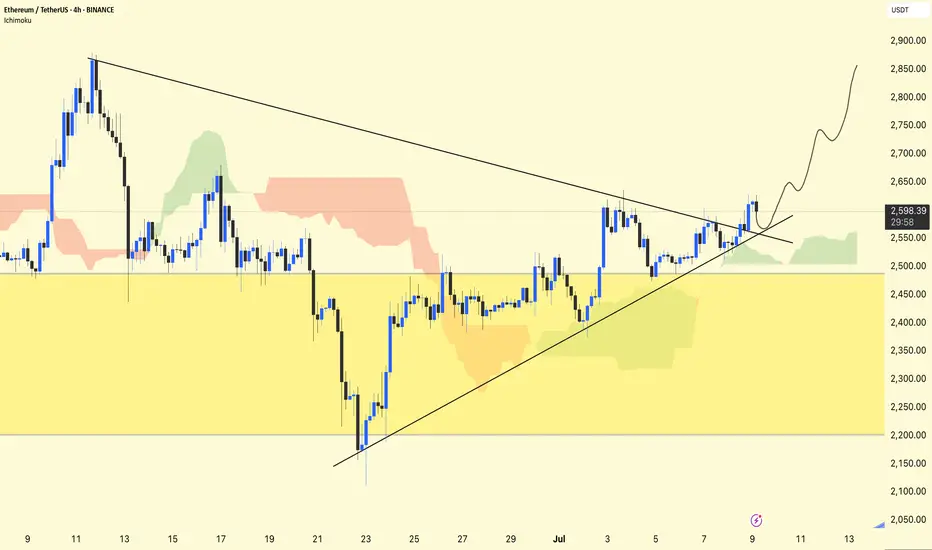
ETH/USDT Chart Analysis (4H)
ETH has been trading inside a symmetrical triangle (shown by converging black trendlines).
A breakout has occurred above the descending trendline, signaling bullish momentum.
The rising diagonal trendline from late June is acting as strong support.
Ichimoku Cloud:
ETH is above the cloud, indicating a bullish bias.
The cloud below the price is green and fairly thin, suggesting modest support if the price dips back.
Key Levels:
Resistance Zone: $2,650–$2,700 (upper breakout zone).
Immediate Support: $2,550 trendline area.
Major Support Zone: $2,250–$2,450 (large yellow box). This has previously served as a significant accumulation zone.
Potential Scenario:
The price may retest the broken triangle trendline around $2,550–$2,570 (as indicated by the wavy projection on your chart).
Holding above this level could fuel a rally toward $2,750–$2,850 next.
Losing $2,550 would expose ETH back toward the bigger yellow support zone.
Short-Term Outlook:
Momentum favors bulls as long as ETH stays above ~$2,550.
Watch for volume on any move above $2,650 to confirm continuation toward higher targets.
Conclusion:
ETH has broken its triangle resistance and looks poised for further upside. A successful retest near $2,550–$2,570 could launch the next leg higher toward $2,750–$2,850.
Stay tuned for updates and key levels to watch!
Thanks for your support!
DYOR. NFA
Short oppurtunity for ETHShort Opportunity on Ethereum (ETH)
Ethereum has recently failed to reclaim key resistance near \$2,800 and is showing signs of renewed bearish momentum. A brief pullback toward \$2,705 is likely before any meaningful bounce back to retest \$2,800. This setup offers a shorting opportunity with defined risk and reward.
Technical Rationale
Resistance at \$2,800 : Price has been unable to close convincingly above this level on multiple attempts, indicating strong overhead supply.
Bearish Momentum : Recent lower highs on the 4-hour chart and a break of the short-term uptrend line suggest sellers are in control.
Support Target at \$2,705 : The next logical area where buyers may step in confluence of the 50-period moving average (4h) and prior swing low from late June.
Outlook
If ETH reaches \$2,705 and shows bullish signs (hammer or bullish divergence on RSI), expect a retest of the \$2,800 area. Conversely, a decisive break below \$2,705 could open the path to \$2,650 and lower. Adjust your plan accordingly based on how price behaves around these key levels.
Disclaimer : Always conduct your own due diligence and size positions according to your risk tolerance. Markets can be unpredictable, use proper risk management.
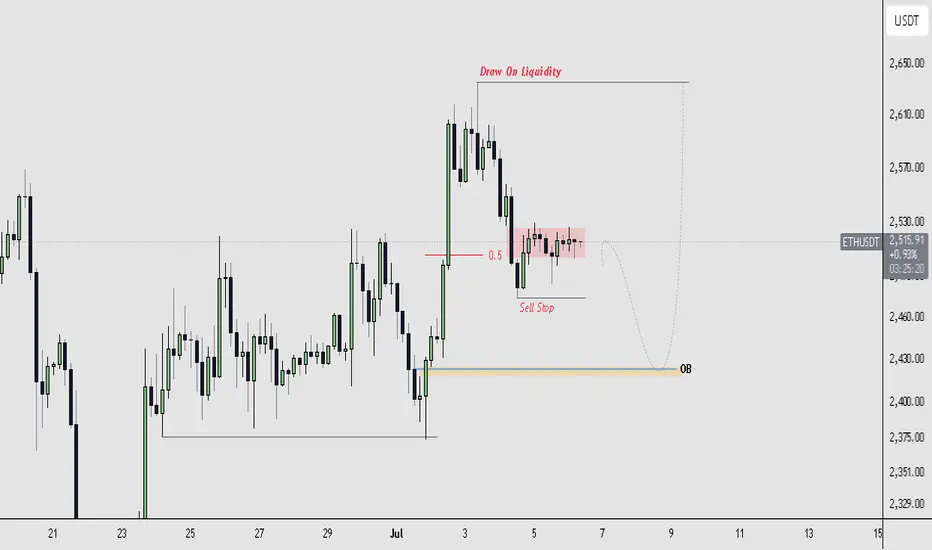
ETHEREUM TRADE PLAN!!!Ethereum still remains bullish, especially on the daily timeframe there's a +OB/BISI supporting the price.
My focus is on the "4-Hour TF" I want to see price revisit (BISI) level as a more favorable entry point for continuation. This level aligns with a key bullish order block, which I anticipate will draw price down before resuming the uptrend.
eth is waking upETH is finally waking up, but it is likely that there is still one more weekly dump before the real melt up.
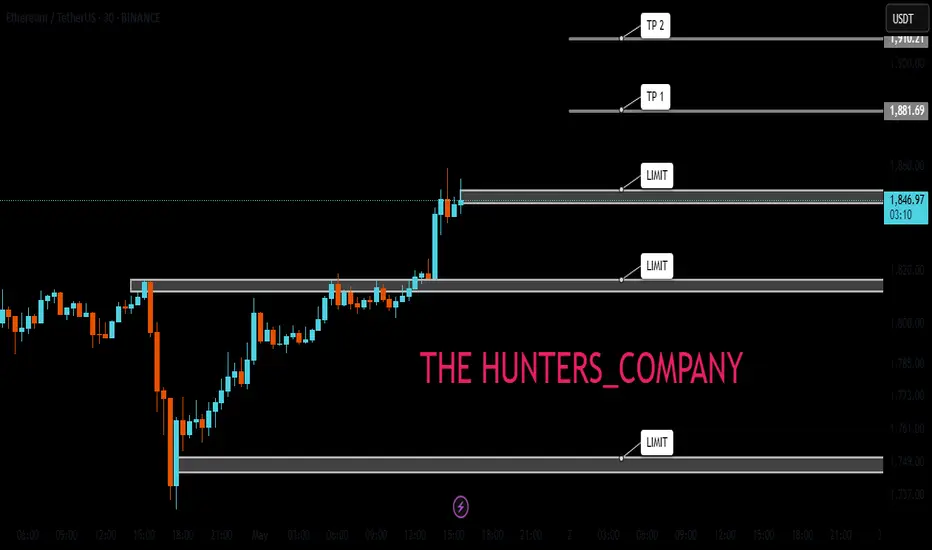
ETH : BUY...Hello friends
Due to the entry of buyers and the breakdown of the trading range, we can buy in the direction of the trend and with capital and risk management within the specified limits and move to the specified targets.
*Trade safely with us*
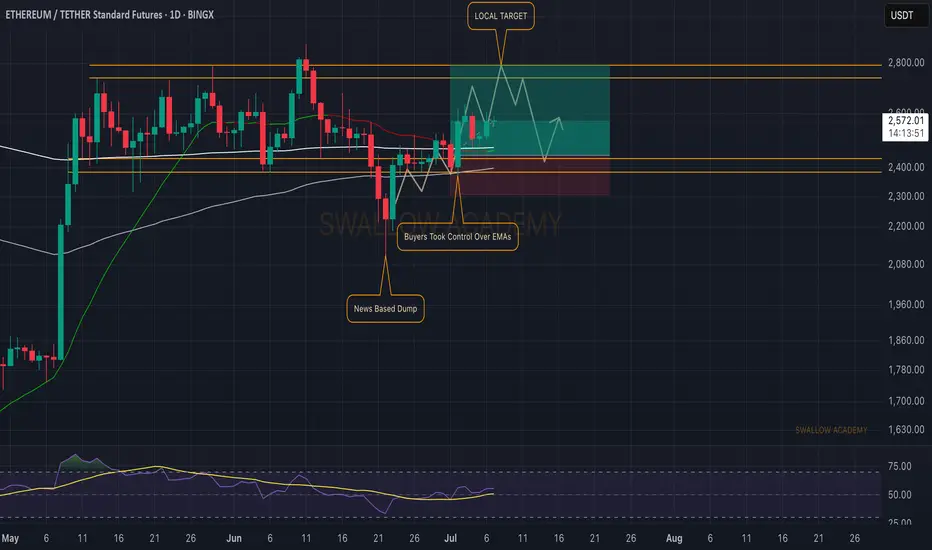
Ethereum (ETH): Buyers Back in Control | From $2570 to $2800?Ethereum is still strong on the 1D timeframe, we are seeing the EMAs being controlled by buyers and secured, which is opening for us the gap to move towards the $2800 area.
What we want to see now is a proper BOS on the current timeframe at $2600, which would then be an ideal entry for a smaller long position!
Swallow Academy
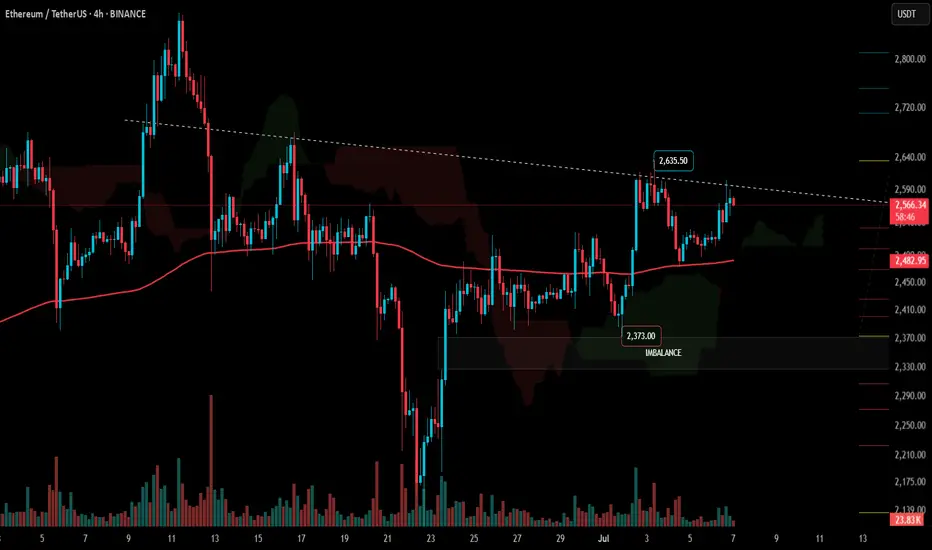
#ETH Update #1 – July 7, 2025🟢 #ETH Update #1 – July 7, 2025
Ethereum is currently testing a resistance level that dates back about 30 days . I’m seeing long upper wicks forming here, suggesting a potential rejection from this zone. Price still hasn’t cleared its previous impulsive high, and this resistance could push ETH back toward the $2,480 level.
As long as ETH holds above $2,480, I don’t see any major concern. But if it loses that support, I’ll be watching the $2,375 level next. Below that, there's a visible imbalance around $2,320, which could act as a magnet for price.
For me, a long position becomes valid above $2,635 with momentum and confirmation. On the flip side, if ETH breaks $2,480 to the downside with strength, I may consider a short setup toward $2,327 .
But for now, I’m staying out. No position until the chart speaks more clearly.
ETH Short IdeaRising trend broken. You can see MSB easily
Volume going down during price rising.
I am waiting correction to 1860