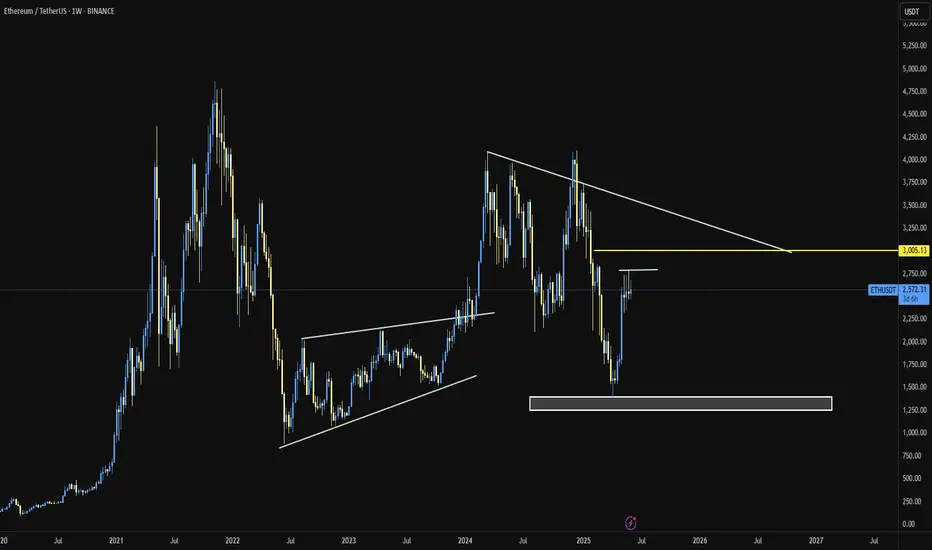
ETH ShortLiquidity taken above 2530 on 4hour timeframe, looking to take profits at 2379, and 2200 eventually.
Inferring from weekly chart, price would likely hit 2200 before making a move further up - ultimately reaching 4100 long term.
ETHUSDT.3S trade ideas
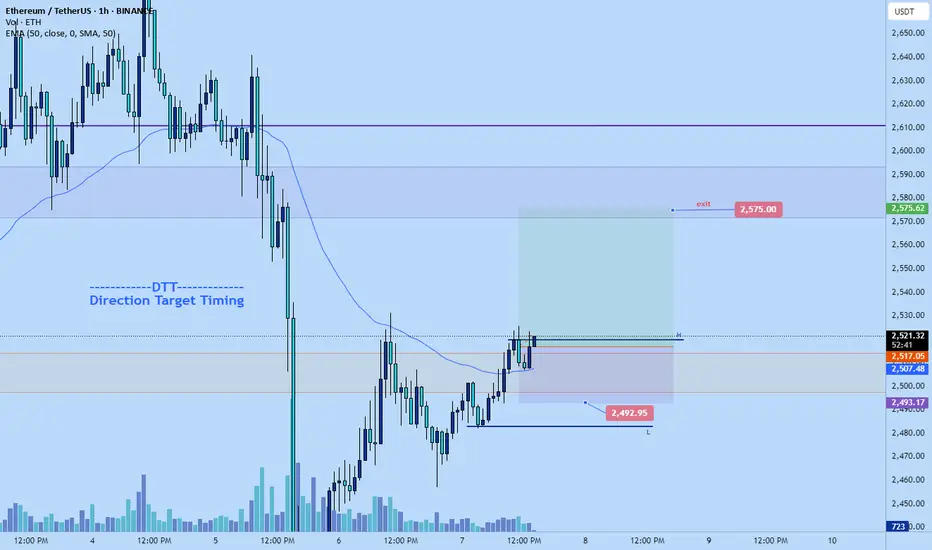
Eth long to $2575Eth long
tp: $2575
Stop: $2492.95 or lower
Roughly 2.5R .. Can use tighter stop if desire to get up RR to 3.
Anticipating smooth push to upside soon. More of a sclap
Time sensitive
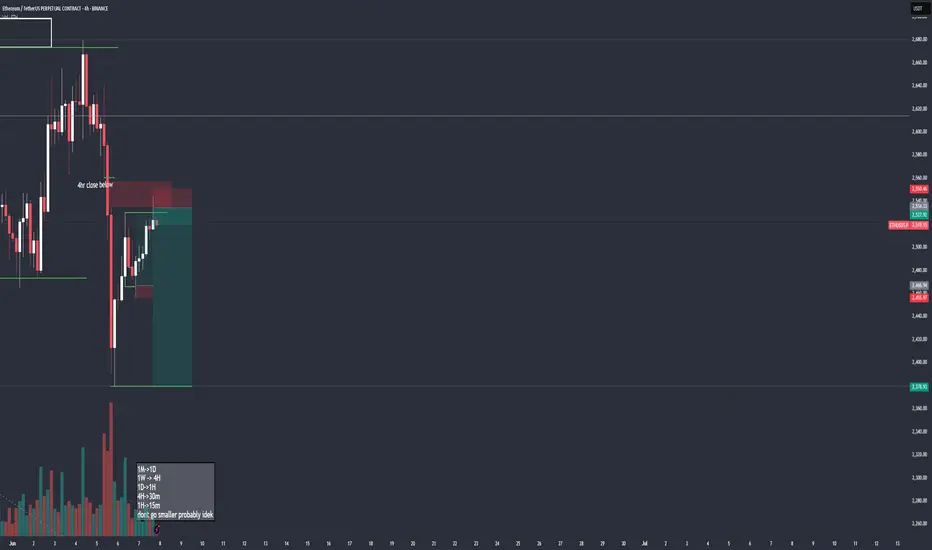
All eyes are on the daily closeA daily close back within the range would look super bullish for ETH.
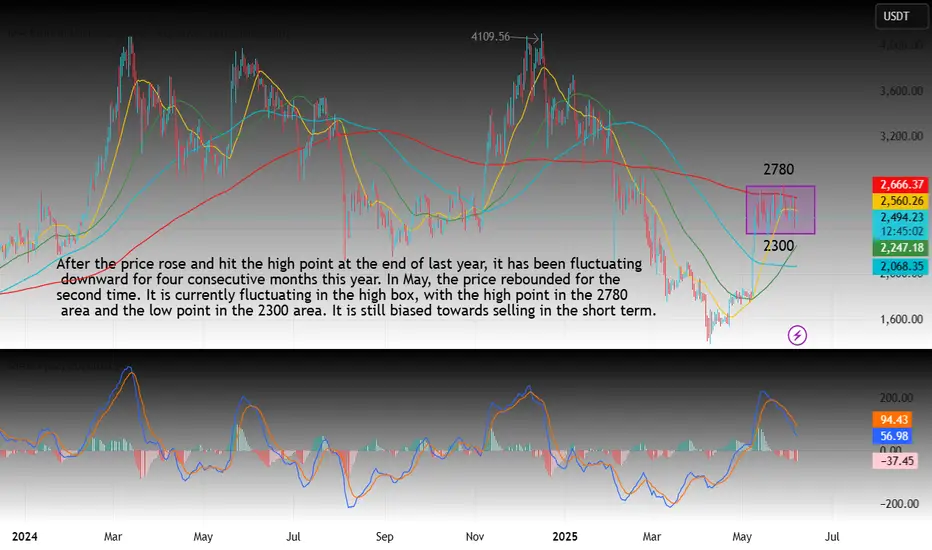
Technical analysis of ETH contracts (outlook for next week)Technical analysis of ETH contract on June 7 (next week outlook):
After the price rose last year and hit the high point of 4170, the weekly level has been fluctuating downward for four consecutive months this year. After the price rose sharply in May, it has maintained a high-level oscillation trend. The K-line pattern is single Yin and single Yang, and there is no signal of breaking; the daily level is still oscillating in the box, with a high point of 2780 and a low point of 2300; although the price is below the moving average, the attached indicator is dead cross, but the strength and continuation are the current problems; then the advantage of price decline in a short time is relatively large, the current high pressure of the four-hour chart and the hourly chart is near the 2533 area, and the low is near the 2450 area; in general, next week, before the price has no obvious break and trend signal, it is still necessary to follow the trend and still treat it as a range of fluctuations;
ETH. seed at 2400 zone today. Poised for +1000$ price growth.ETH was met with a good healthy correction back to 38.2 Fib. An ideal retracement zone for new buyers to converge.
ETH was able to tap 2800 zone before retreating back to -400 -- and everything is moving based on expectation. The current behavior just made the bull scenario much attractive now conveying some healthy metrics for the bulls.
Best to seed at the current price as 2400 levels. Based on our diagram this is replicating the same structure as the last surge from 1500 area last April 2025.
From this range hibernation, we can see some good setup forming for the BULLS -- an apparent accumulation zone in progress.
Don't miss out if you missed the last pump -- its your chance today. It does'nt come often.
Spotted at 2400
Mid Target at 3400.
* The chart above is in USDETH, an eth reverse metrics -- depicting the heavy gravity bears at the moment. Bulls are about to take over soon.
TAYOR.
Trade safely.

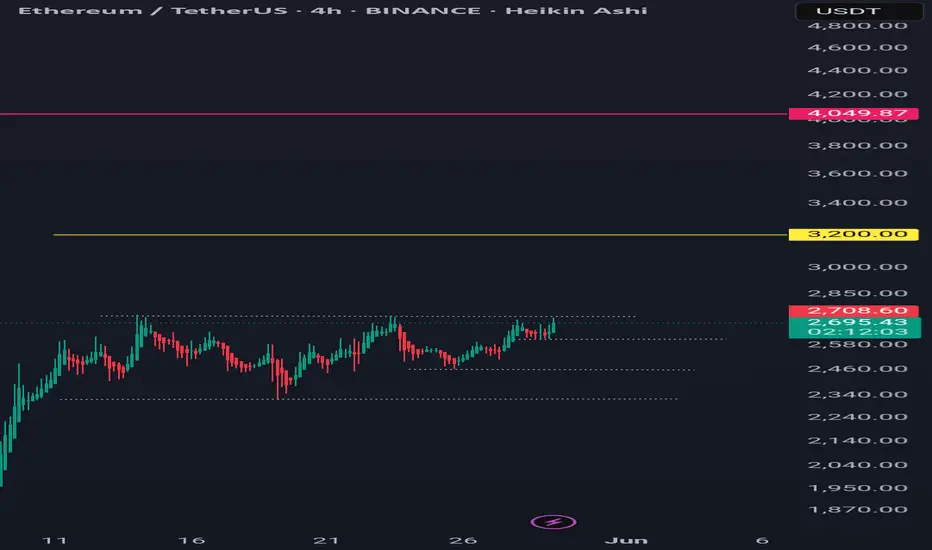
Ethereum: No Sellers, No Bears, No Pressure; Bullish ConfirmedTo put it simple, there is absolutely no selling pressure on ETHUSDT. And this is reasonable, Ethereum is now so cheap that not many people are looking to sell.
Let's dive into this chart and see what we can find.
Spoiler alert: I am no longer bearish on ETHUSDT. "The retrace" simply isn't a thing on this pair. There is no bearish action. Let's read the chart and see what it has to say.
The low 7-April... Ok.
8-May ETHUSDT produced a very strong green candle to break above EMA55 and EMA89. Volume was also high on this date. These levels tend to work as strong resistance and the fact they broke decisively, means that the bullish bias is confirmed and Ethereum isn't likely to move back below again. Whenever there is a drop, these lines will work as support.
The peak soon happened and Ethereum went sideways, it has been sideways in a small phase of consolidation. The lowest point came 18-May. There was a failed attempt by the bears to push prices lower but this ended as a big fail. Ethereum continues strong.
Here we have again EMA55 and EMA89, magenta and blue lines on the chart. These levels remain untested as support which is a signal of strength. While some pairs went down 20%, 30%, 50%, Ethereum's maximum drop has been 14%, now, that's strength.
As seen from the diagram on the chart, we are about to enter the third wave of a bullish impulse. There can be a correction after the third wave ends followed by additional growth.
The break of EMA55/89 as resistance confirms that Ethereum is bullish mid- to long-term. This means 3-6 months of growth.
Once MA200 is broken as resistance, we have at least six months of bullish growth confirmed, this will happen later this month.
No bears means the bulls are in control.
A very small retrace means buyers are strong.
It all makes sense, who would be willing to sell their Ether when there is so much room left for prices to grow?
No one, that is why prices remain strong.
Adapt to market conditions fast and live.
Some pairs are going down while others are going up.
Some pairs are sideways; some are growing strong.
This is the early stage of the 2025 bull-market, just wait and watch... Just watch! It will get wild faster than you think and it will become so wild that you won't be able to handle the market at all. Everything will become so good, so fast, that you will feel blessed for deciding to enter the Cryptocurrency market during April's low.
It is still early though, remember, $7,000 is the minimum price for Ethereum in late 2025. $11,000 is also possible.
Thanks a lot for your continued support.
Namaste.

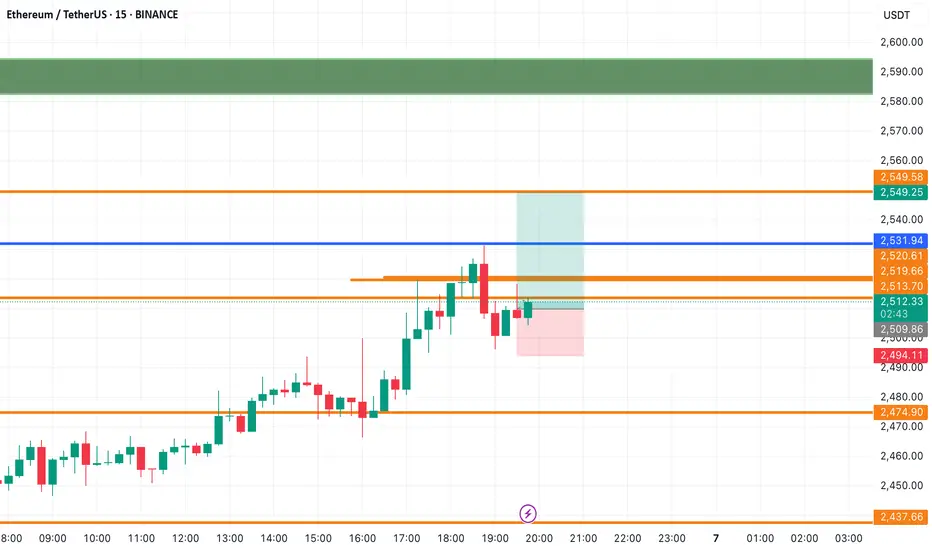
ETH/USDT – Quick Long OpportunityETH/USDT – Quick Long Opportunity
Ethereum is showing bullish momentum from support.
Looking for a short-term long setup with a target at $2,509.
📈 Clean structure, tight risk — watching for a push toward resistance.
🚀 Follow for real-time trade setups, no fluff — just sharp charts!
A healthy pullback before moving to the upward.Everything is based on market structure and price action, as indicated by the charts that ETH is bullish.

This is a healthy pullback before the price moves to the upside Everything is based on market structure and price action, as indicated by the charts that ETH is bullish .
ETH Technical Structure: Bullish Bias Unless This Level BreaksEthereum is at an interesting spot.
After forming a clear bullish structure with Higher Highs (HH) and Higher Lows (HL), ETH entered an accumulation zone right below the key resistance zone.
Currently, price is retesting the 50 EMA + 100 EMA confluence zone — a critical area of demand. This level has previously acted as a strong support, and the Stoch RSI is bouncing from oversold territory, signalling possible bullish momentum ahead.
If ETH holds this accumulation zone and the EMA support, we could see another push toward the key resistance zone or even a breakout. However, if this zone fails, a deeper pullback toward lower support levels is likely.
For now, watch how price reacts here — this is a decision point.
If you liked it, do comment and follow us for regular market updates.
THANK YOU

Ethereum Breakdown Ahead? Classic Head & Shoulders Pattern Hello Guys!
Ethereum looks like it’s setting up for a potential drop after forming a textbook Head & Shoulders pattern on the 4H chart.
This pattern (marked clearly with a left shoulder, head, and right shoulder) is often seen before a price reversal. Right now, ETH has already broken below the neckline (around $2,480), confirming the bearish pattern, and is currently retesting that level from below.
📉 What’s Next?
If the pattern plays out, we could see ETH drop toward the projected target zone around $2,200–$2,250, which is highlighted in blue on the chart. This zone also lines up with a previous area of interest and sits near a broken trendline, adding confluence to the setup.
✅ What I see:
Resistance: ~$2,500 (neckline retest)
Target: ~$2,200 support zone
Broken trendline adds downside pressure
Unless bulls reclaim the neckline quickly and push above the right shoulder (~$2,650), this looks like a bearish continuation setup.

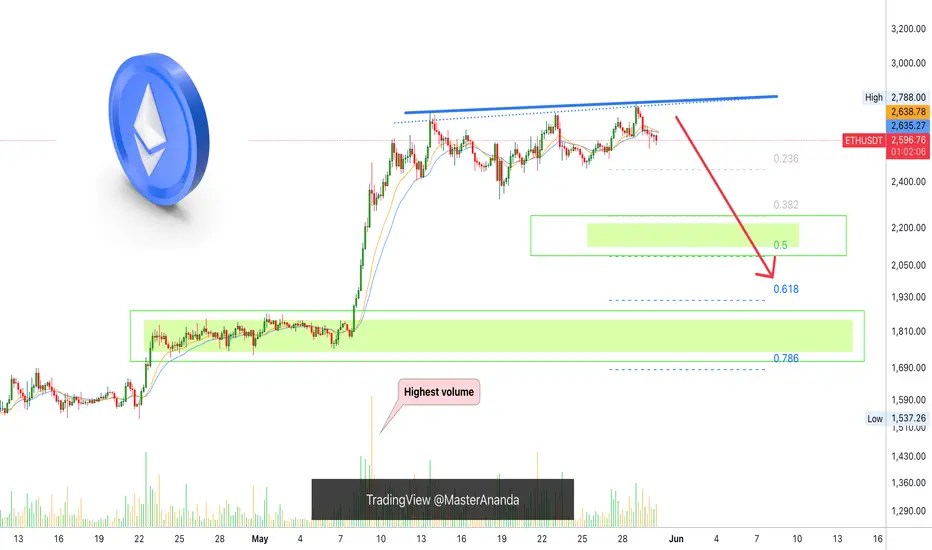
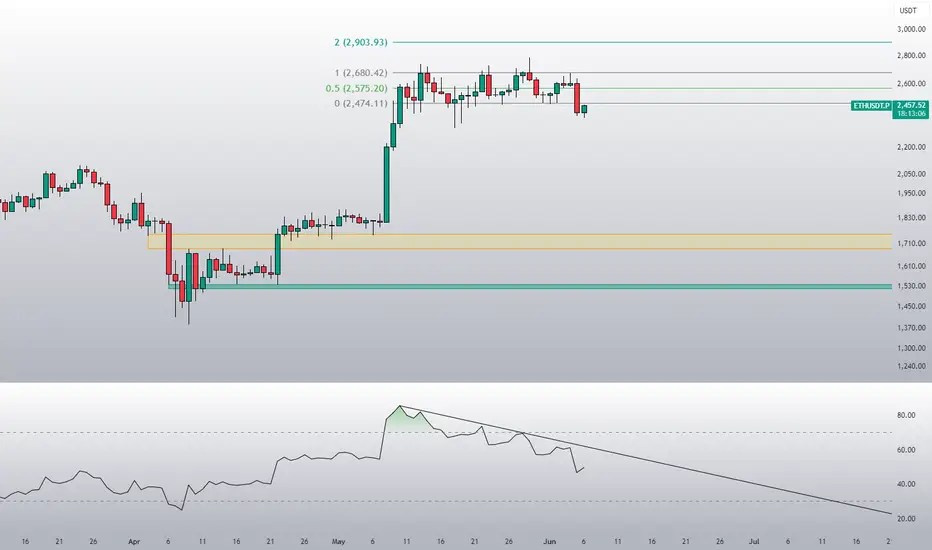
Ethereum Danger Zone —Protection, Correction or Continuation?Ethereum can be seen trading below EMA55 on the 4H timeframe. The biggest volume session happened 9-May and it was red. This tells us that there is correction potential after a very strong 101.1% bullish growth wave.
There are mainly three levels to consider for the correction potential after ~100% growth. 0.382, 0.618 & 0.786 Fib. retracement levels. After the test of these levels, whichever one comes last, we can read the chart again and see if Ethereum will continue lower or produce a bullish wave.
One thing is very certain though, after strong growth, there is always a correction/retrace. This is what you are seeing now in this chart. The start of the drop. Taking action is best.
The market moves in waves and will never stop this pattern, it fluctuates. To trade, one buy lows near support; sells high when resistance hit. 100% growth is very strong for the second biggest Cryptocurrency project, the #1 Altcoin.
After a strong bullish wave there is always a correction. After the correction there can be more correction but at some point the market turns. Each chart/pair needs to be considered individually on multiple timeframes to have a better understanding as to what will happen next.
In a single day, based on the news, market conditions can always change. Stay alert!
Namaste.
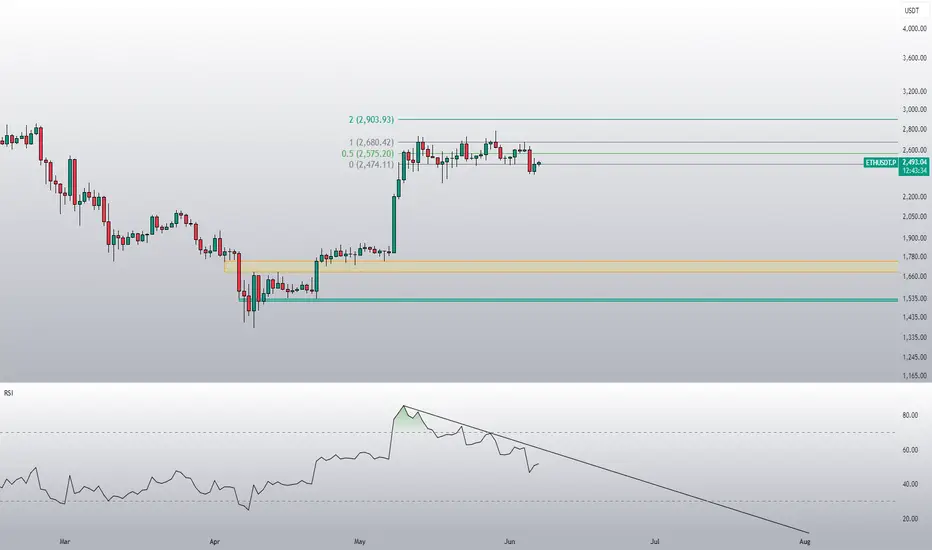
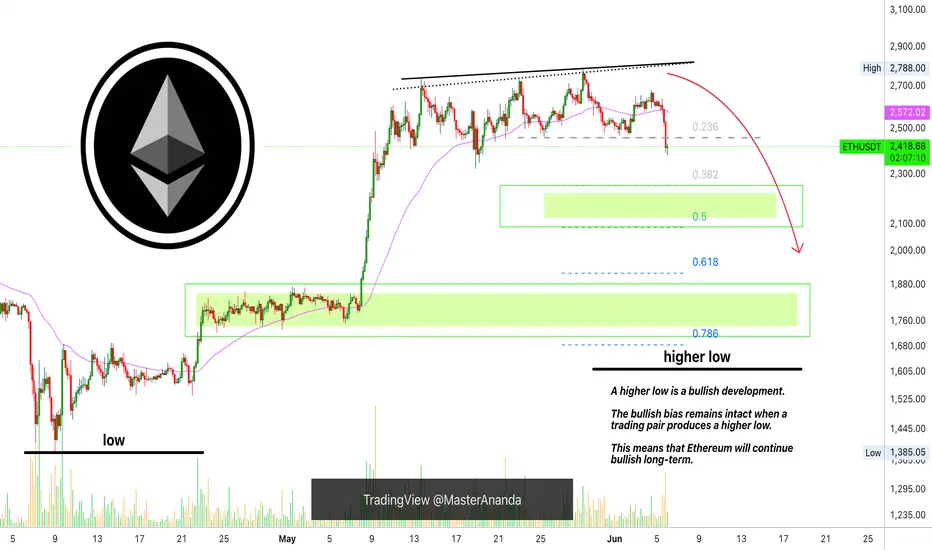
Ethereum, Guessing The Next Move ($1,500 or $2,000?)The million dollars question; What about Ethereum, lower or recovery?
And this is truly a million dollars question because knowing the answer can make you millions. It can either safe you lots of money or it can make you lots of money.
👉 Ethereum is going lower.
The 18-May low happened at $2,323, and this low wasn't challenged, the drop yesterday ended as a higher low. But, there is something... We lost some important support levels.
ETHUSDT lost the 0.236 Fib. retracement, when this happens, the action tends to move to the next lower-level which is below the 18-May low.
Looking at the 4H TF, ETHUSDT lost EMA55 and MA200, so these are also pointing lower.
Just a few days back I mentioned $2,000 entry LONG opportunity for Ethereum, this price might be possible but it is still really early.
The market has been sideways and this breakdown is new. It would be good to wait for the weekly session close to see what prices we will get, without this information, I can say that it is still too early to say, but I can still make my guess. My guess is that it is going lower.
Thank you for reading.
Namaste.
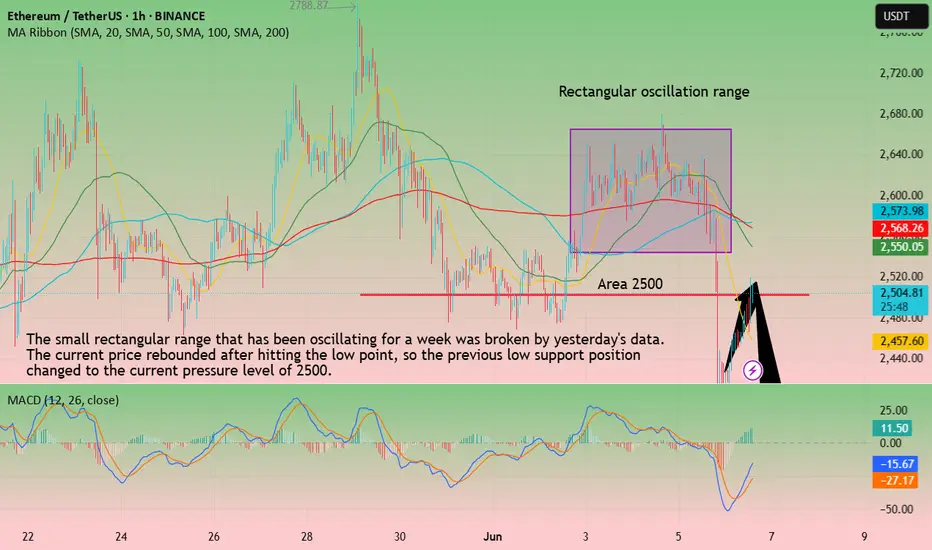
ETH-----Sell around 2500, target 2400 areaTechnical analysis of ETH contract on June 6:
Today, the large-cycle daily level closed with a large negative line yesterday, and the K-line pattern was still a single negative and single positive. The price was below the moving average. The attached indicator was dead cross. The bottom support position of the rectangle below was in the 2300 area. This is what we should focus on next week. Only when this position is broken, the overall downward trend will be formed and move downward; the short-cycle hourly chart maintained a range oscillation trend for a week. Under the stimulation of yesterday's data, it continued to break downward. It is necessary to pay attention to a top-bottom conversion pattern. The previous low support of 2500 has turned into the current pressure level.
ETH short-term contract trading strategy:
Short in the 2500 area, stop loss in the 2550 area, and the target is the 2400 area
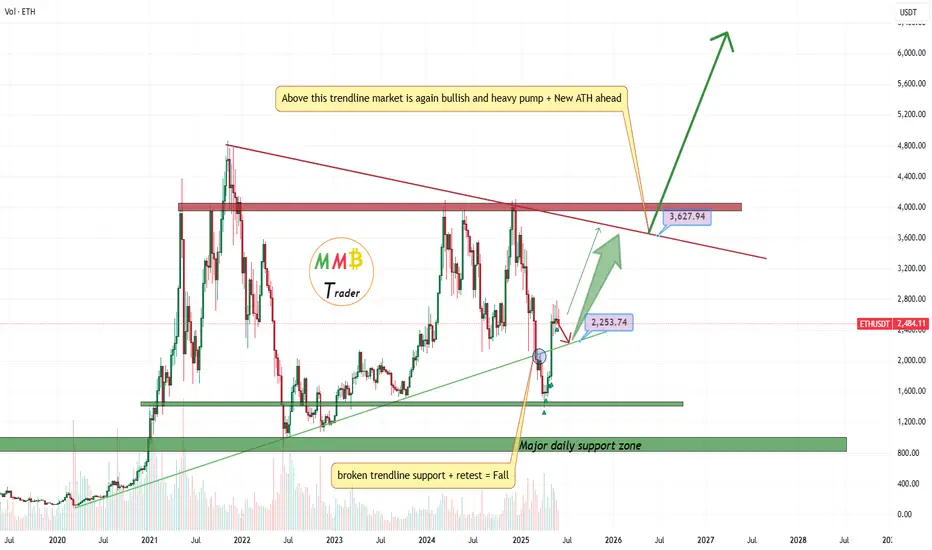
ETHUSDT still in range soon breakout to the upside and 7K$As we mentioned a lot this time ETH will also pump with BTC and soon we are looking for new high on this chart like the green arrows and what we need now is a little patience and let it cook.
DISCLAIMER: ((trade based on your own decision))
<<press like👍 if you enjoy💚
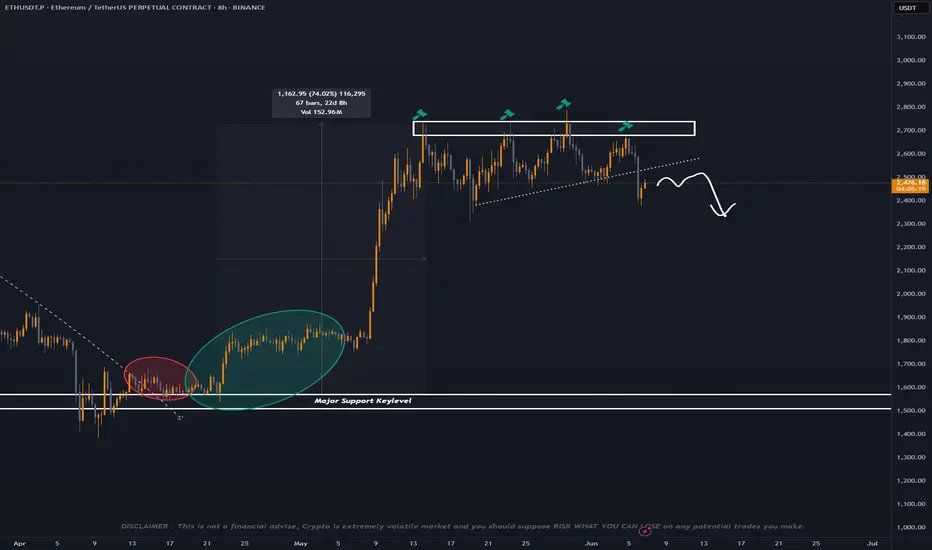
Ethereum Update
We know ETH made a good bounce at Major Support Keylevel and printed a +74% of good impulse up 🔥
But as of current structure and for my own opinion panda fam this structure is an obvious bearish and we already broke down below on trend support same time ETH made a multiple rejection at 2.6k resistance keylevel.
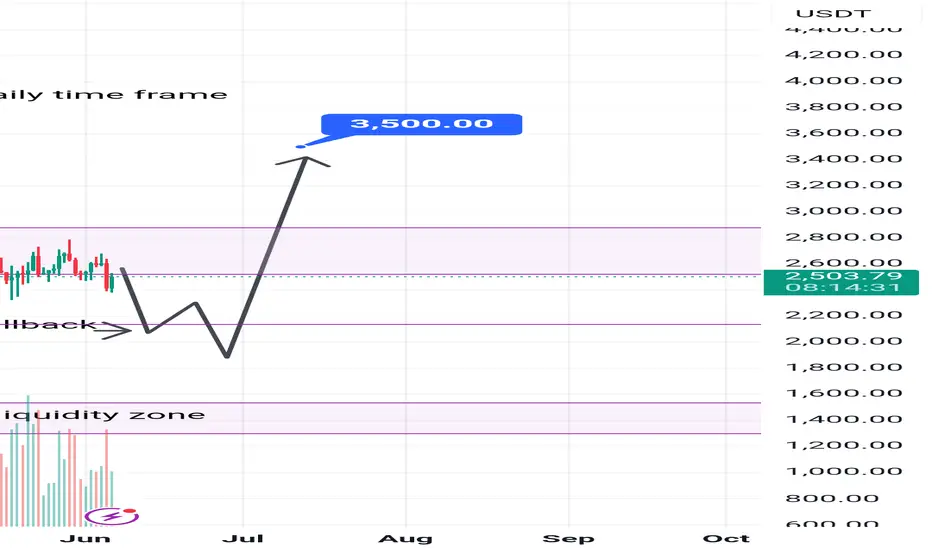
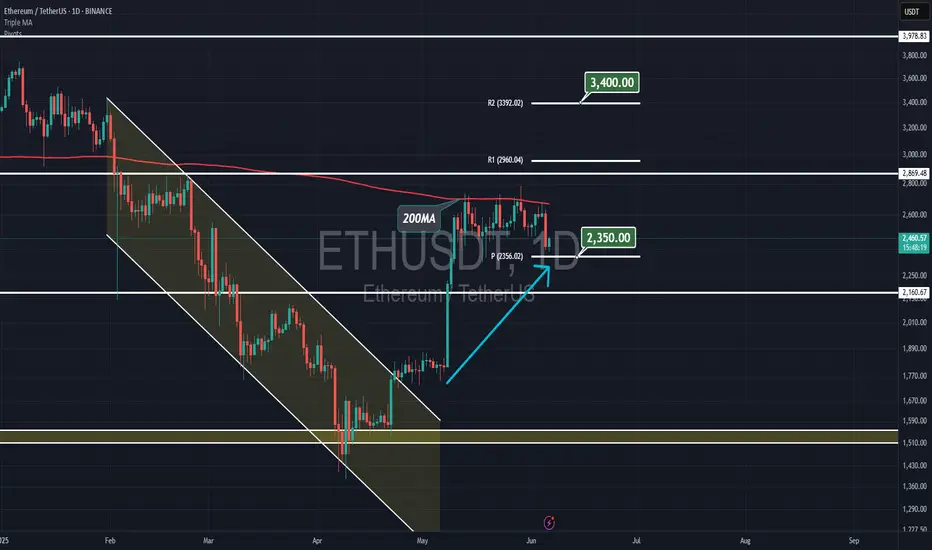
Ethereum & June's pivot supportEthereum price is now playing below the 200 daily MA, but the price about 2350 is the pivot and holding as a support, and I'm expecting to see upside movement in the coming days to about 3400 which is the resistance 2 for the pivot.
Ethusdt 4hr time frame forming Bullish Cup and Handle patternalmost eady for breakout.
If closes above 2730 in 4hr time frame, may activate the pattern.
2 invalidation areas, for conservative and for aggressive traders. 2600 and 2450.
Targets are 3400 and probably the previous ATH.
Ethereum is still on trackETH might've printed a spot-on "spring" below its daily range. If there's a breakout on the daily RSI, that'll probably be a confirmation.
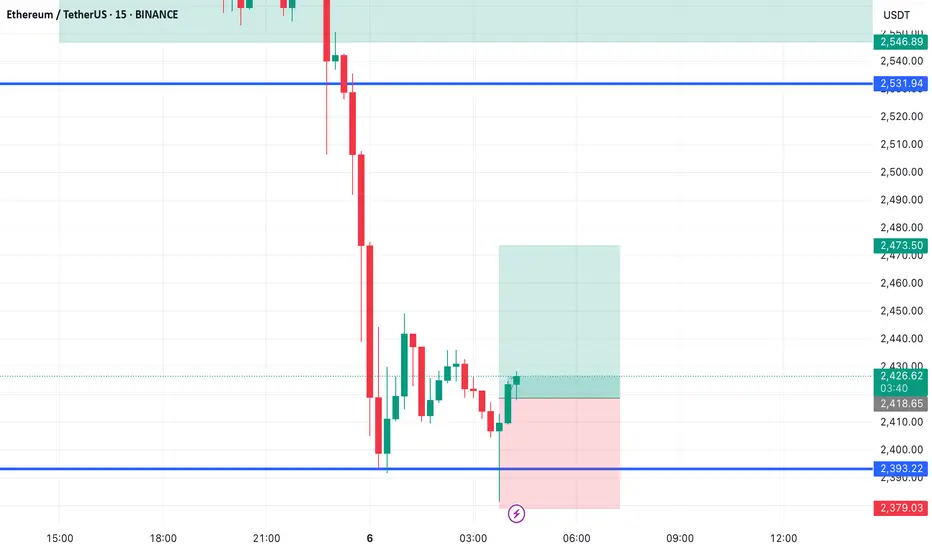
ETH/USDT – Short-Term Long Setup
ETH/USDT – Short-Term Long Setup
Ethereum is showing bullish momentum off support.
Looking for a long position with a short-term target at $2,473.
🟢 Clear structure, clean risk — watching for continuation.
🚀 Follow for more sharp entries and real-time setups!
#ETH Bearish Head and Shoulders📊#ETH Bearish Head and Shoulders📉
🧠From a structural perspective, we failed to break through the blue resistance zone yesterday, but fell below point 4, which means that the previous rise is over and the probability of continuing the bullish force is reduced. If it went straight up yesterday and reached the heavy resistance area of 2860-2911 that I want to focus on, then I would try to short trade, but the market did not give us such an opportunity.
➡️From a graphical perspective, we have built a bearish head and shoulders structure in the resistance area, and we have formed a rising wedge after this period of sideways consolidation. Both models are bearish expectations, so we need to be wary of the risk of a pullback.
Let's take a look👀
🤜If you like my analysis, please like💖 and share💬 BITGET:ETHUSDT.P

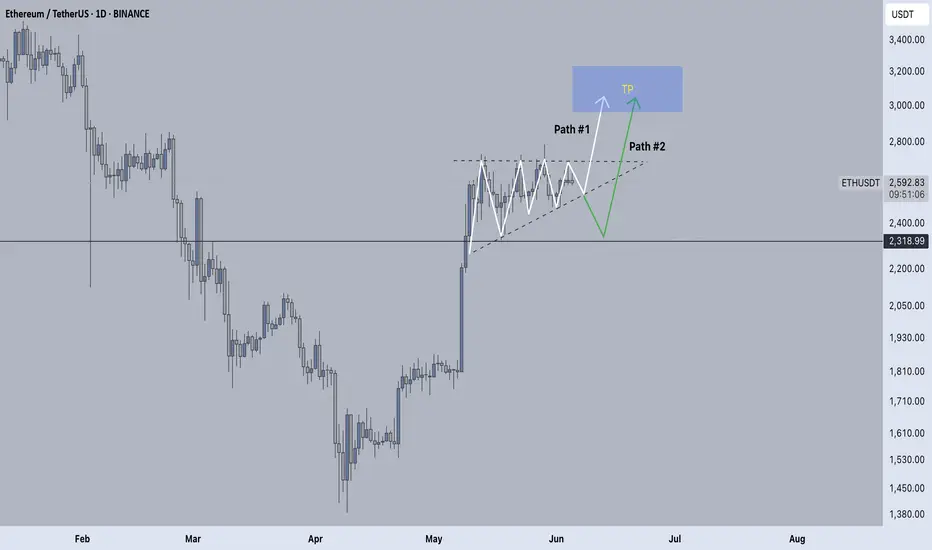
ETH Ascending TriangleETH has formed a clear ascending triangle pattern with a possibility of imminently breaking out to the upside. If rejected, we could see a breakdown to the ~2,300 support and subsequent rebound.
My bias is still bullish. We'll let the market tell us what happens and respond accordingly. Worst case scenario is more boring consolidation.
Stay patient.
Happy trading,
Melonfarmer
ETH/USDTStrong Accumulation can be seen on #ETH, BlackRock buying more than usual, as well as bigger wallets and whales are accumulating heavily in the last two weeks. Something is loading for ETH and I think our decision to swap all of our XRP into ETH will play out big. In the meantime. Since taking full profit on XRP, its down 7% since then, meanwhile our ETH position is at 6% in profit. This is the beginning