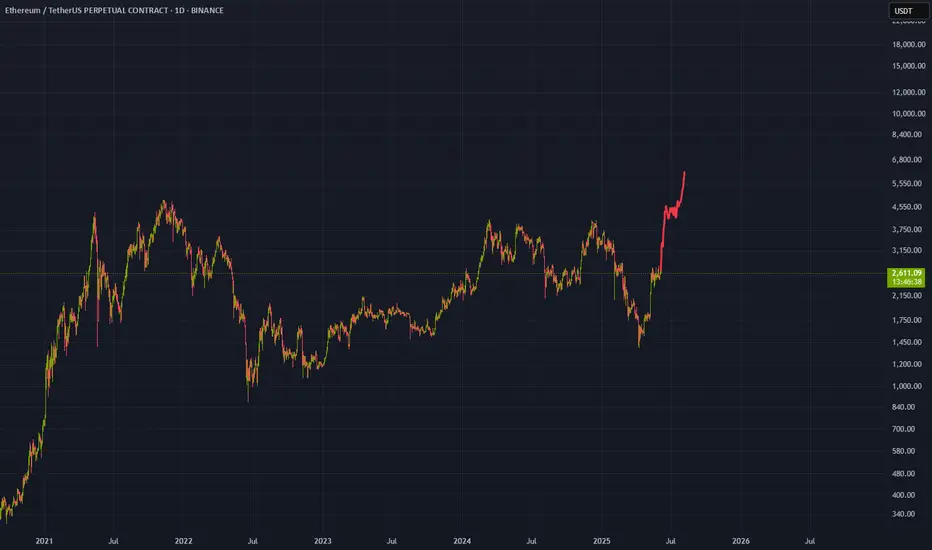
ETH Bullish | Inverse H&S | Cup and Handle PatternEthereum is still dragging its feet towards a new ATH, or at least, towards a high. But there are some positive signs showing up on the chart.
Make sure to check out yesterday's update on Bitcoin:
____________________________
BINANCE:ETHUSDT
ETHUSDT.3S trade ideas

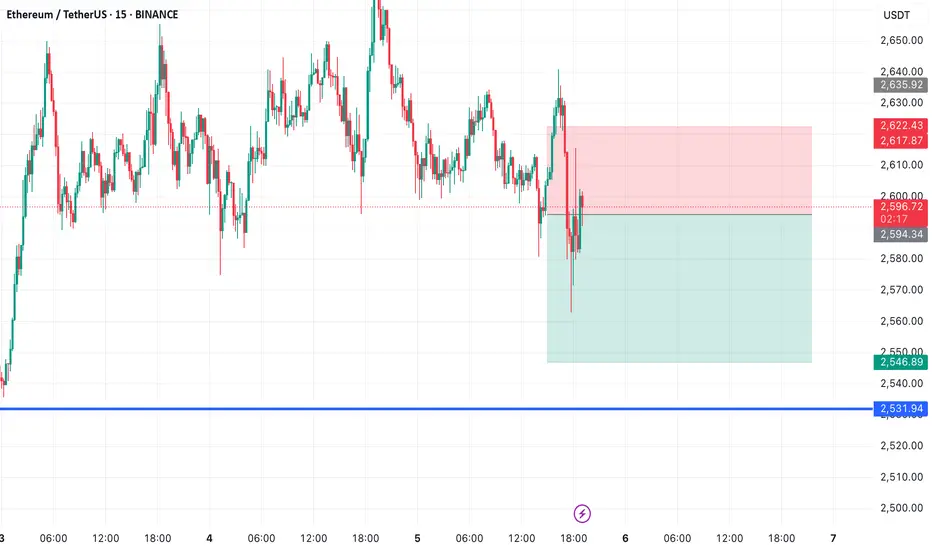
ETH/USDT – Short-Term Bearish SetupETH/USDT – Short-Term Bearish Setup
Ethereum is losing momentum near resistance.
I’m watching a short position with a near-term target at $2,546.
💡 Structure looks clean – waiting for confirmation to ride the move.
📉 Quick setup. Tight risk. Let’s trade it smart.
🔔 Follow for more real-time setups like this!
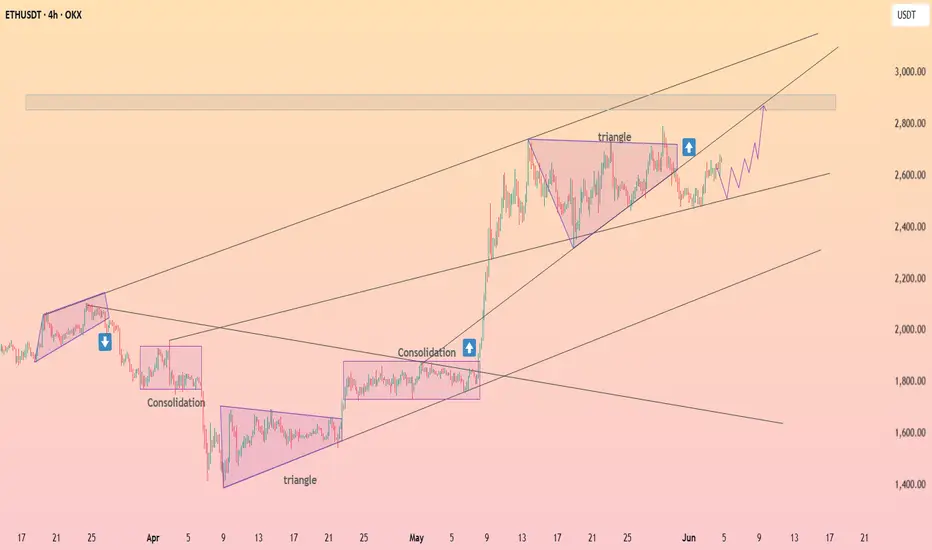
HolderStat┆ETHUSD channel climbCRYPTOCAP:ETH cruises within a steep four-hour rising channel; the latest triangle breakout paused near 2.6 k. Converging trendlines, former consolidation support and higher-low structure all aim for the 2.9 k liquidity zone. Bulls steer while the channel median holds.
ETH-----Buy around 2620, target 2675 areaTechnical analysis of ETH contract on June 5:
Today, the large-cycle daily level closed with a small positive line yesterday, the K-line pattern continued to rise, the price was above the moving average, the attached chart indicator dead cross shrank, and the overall trend fell into a small range of shocks, but it should be noted that the price continued to consolidate at a high level, and the retracement had no strength and continuation. After each retracement, it was accompanied by a rapid rise or even a break, so there is a high probability that it will rise after consolidation; in terms of the short-cycle hourly chart trend, the price continued to break the high, although the time point is wrong, but it can be seen that the low support of the retracement is moving up, the current K-line pattern is continuous, the attached chart indicator dead cross shrank, so there is still a demand for rising within the day.
ETH short-term contract trading strategy:
Buy at the current price of 2620 area, stop loss at 2590 area, and target at 2675 area;

Ethereum Long Setup – Chart Analysis (June 5, 2025)We are the SeoVereign Trading Team.
With sharp insight and precise analysis, we regularly share trading ideas on Bitcoin and other major assets—always guided by structure, sentiment, and momentum.
🔔 Follow us to never miss a market update.
--------------------------------------------------------------------------------------------------------
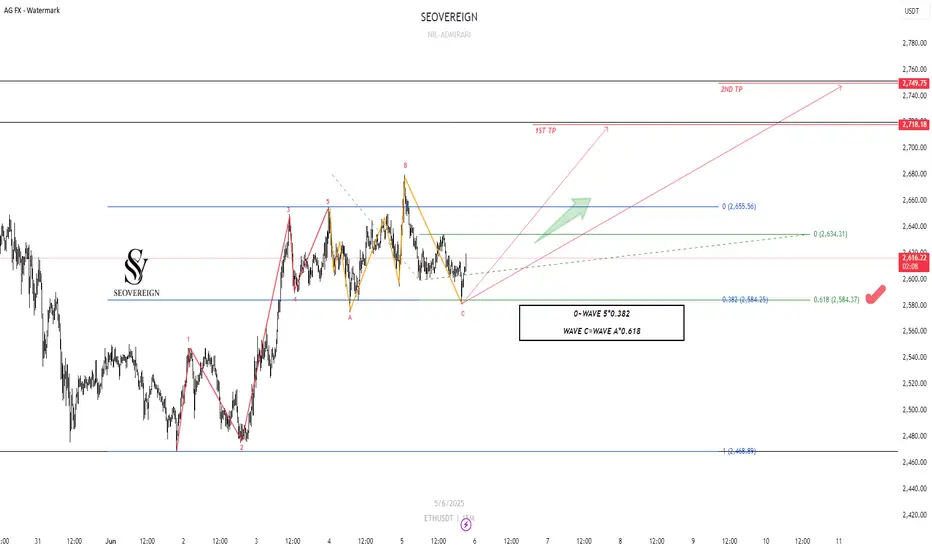
Here is a technical analysis of Ethereum.
The current wave structure is considered to be in the final stage of a corrective wave, with the following evidence based on length ratios.
First, the 5th wave of wave C forms a length that is 0.618 times that of waves 0 to 3.
Second, the fact that wave C ended at the 0.382 Fibonacci retracement level of waves 1 to 5 increases the possibility of technical support.
As these conditions are met, the current zone is considered a valid buying point for entering a long position.
Target Prices
1st target: 2,700
2nd target: 2,750
This zone overlaps with past resistance and technical retracement ratios, making it appropriate as a short-term liquidation zone.
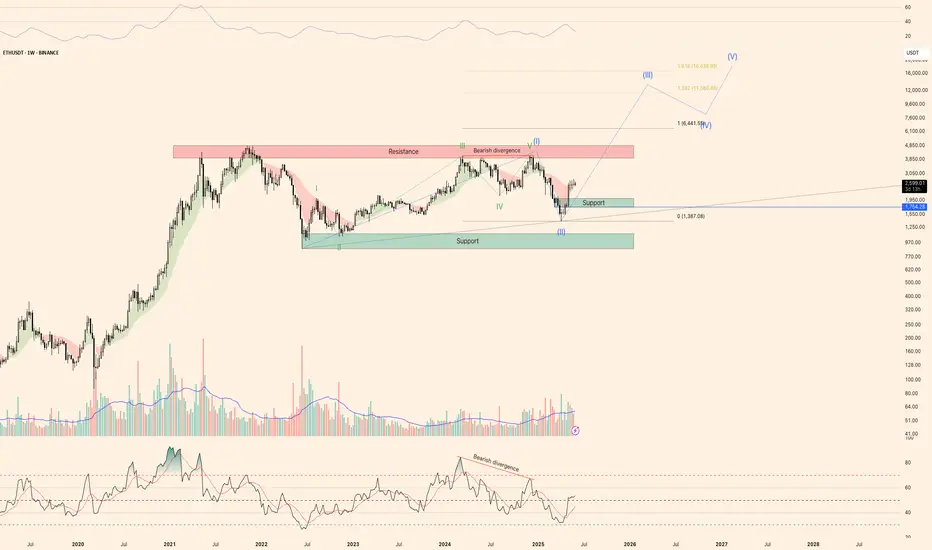
Global overview of the weekly TF on ETH In general, if we look at the weekly TF, we can see the Bearish divergence, which has already worked itself out and the price showed a strong bullish reversal, but for 4 weeks we have been observing a weak sideways trend.
We can draw a trend line along the two bottom points. It is important to note that the level of $1,754 is the key level and if it is broken, we can forget about the growth and wait for the fall to the support zone. The local support zone should be in the range of $2,023-$1,754, in case of correction this range should be protected before the subsequent growth.
If we interpret the movement from June 2022 to December 2024, we have 5 rising waves, the 3rd wave was really slow, but still the rules of 5 waves were not broken. So there is a chance that the price is now in the second wave and we are really waiting for the 3rd long wave in the form of bullrun on ETH, given the length of the first wave, we may see a rise above 10k on ETH.
Global resistance is in the $3,950-$4,860 range
Also, given that the top of wave 5 is only 0.4% higher than the top of wave 3, depending on the exchange, we can also suggest other options for the development of events
One alternative is the ABCDE triangle, this is a long triangle of 4 years. Wave B could end either at the peak on March 11, 2024 or at the peak on December 9, 2024.
In this case we have yet to see a decline before a sharp rise
ETHUSD: Buying opportunityWarning, this is highly speculative!
Ethereum faced a gruesome decline since the peak of around 4000 back in december, reaching a bottom of ~$1400
Then, in may, we had a huge rally, boasting a nearly 100% bounce from bottom to top.
Now, this fact alone has many people holding off on buying short term, as they feel a drop could be just around the corner, however, i think for this exact reason, aswell as an inbound risk-on environment, it will continue the rally, and much faster and for much longer than anticipated, creating that FOMO wave people seem so desperate to try and catch.
The whole reason you end up with the feeling of FOMO, is because your past decisions seem stupid in hindsight, and recent price action makes it seem obvious.
Well let me tell you, its NOT obvious, and that is precisely why it runs and creates that FOMO wave.
Price targets are irrelevant, focus on recognizing when greed runs amok, and take profits accordingly.
EOY Would be an obvious point at which selling heavy might be smart, but then again, its never obvious... Goodluck!
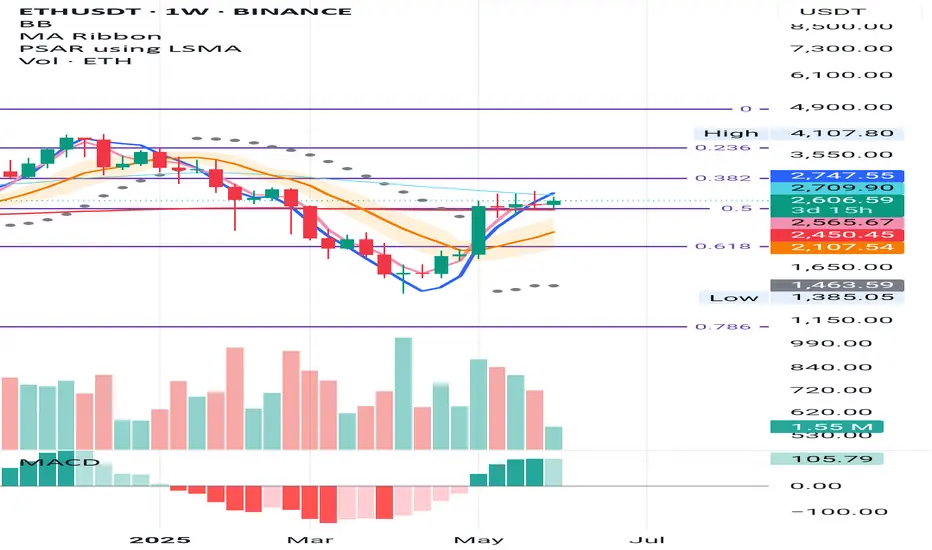
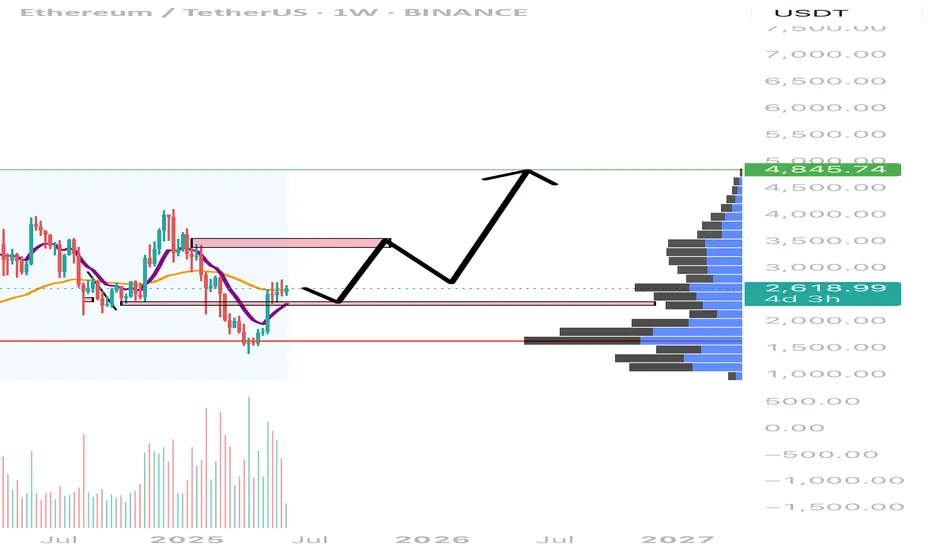
ETH Weekly – Signs Aligning for a Long Setup
ETH is forming subtle higher lows above the 0.5 Fibonacci level and the 200MA—both sitting near the same key support zone.
The 50MA is currently acting as resistance, but structurally we’re seeing MLR > SMA > BB center, and the PSAR flipped bullish since the week of May 12.
We now have all the signals needed for a valid long entry on this timeframe.
Feel free to drop your thoughts in the comments—good or bad, all engagement is appreciated.
Take profits. Manage risk. Stay sharp.
Eth is all set for a quick drop below 2480It's time to collect buyers' stops below the $2,480 per Ether level. Everything is clearly visible on the graph.

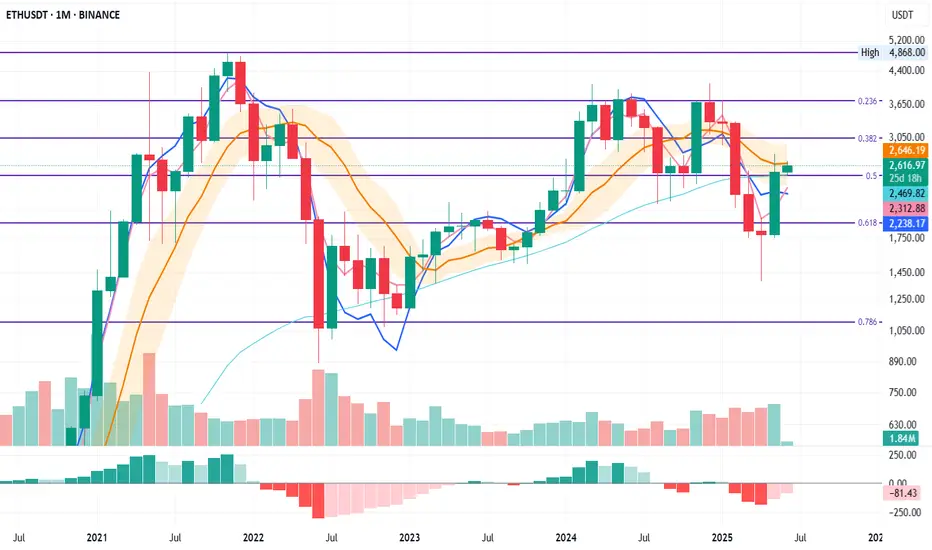
ETH Monthly – Fibonacci Structure in Play
ETH has been respecting the monthly Fibonacci levels with surprising precision.
There was a clear double top at the 0.236 Fib in May and November 2024, with a base forming at the 0.5 Fib. That same 0.5 Fib now acts as support, aligned with the 50MA.
The BB centre is currently stopping price, but for how long remains to be seen.
SMA is above MLR and rising, which supports a bullish bias.
If this structure holds, the next resistance zones may align with the higher Fib levels.
Feel free to drop your thoughts in the comments—good or bad, all engagement is appreciated.
Take profits. Manage risk. Stay sharp.
Technical Analysis – ETHUSDT (1h) – BITGET
1. Main Trend:
The short-term trend is currently sideways/slightly bullish. After a bearish phase, ETH has recovered above the 200-period moving average (green line), but struggles to decisively break the resistance around 2,620–2,640 USDT. The 50-period moving average (red) is close and often crossing the 200, indicating stability/uncertainty in the trend.
2. Key Levels:
Supports: 2,594 USDT (MA 200), 2,589 USDT (BB), 2,588 USDT
Resistances: 2,622 USDT (BB + recent local high), 2,655 USDT
Breakdown: A clear hourly close below 2,590 USDT could open the door to declines towards 2,550/2,520 USDT.
Breakout: Only a strong close above 2,622–2,655 USDT would confirm a new bullish momentum.
3. Technical Indicators:
RSI (45.73): Neutral, near oversold territory but without clear divergences (potential for rebound but risk of further weakness).
MACD: Still negative, indecisive signal with MACD line below Signal and both flat: no dominant momentum.
Bollinger Bands: Price is near the mid-band, typical of lateral phases. Bandwidth is low, suggesting the possibility of an imminent volatility spike.
Trading Signal
Asset: ETHUSDT Perpetual (1h)
Direction: Short
Entry: 2,592 USDT
(below the dynamic MA200 support and near the lower BB edge, confirming intra-hour weakness)
Stop-loss: 2,622 USDT
(above the central BB line and first resistance level)
Take-profit:
TP1: 2,555 USDT (previous lows and static support)
TP2: 2,520 USDT (next key historic level)
Confidence: Medium
Additional Notes:
Consolidation phase; volatility likely in the coming hours.
If price breaks and closes strongly above 2,622, bearish scenario is canceled; consider switching to long.
Macro: watch for BTC volatility and possible knock-on effects on ETH.
Pattern: no strong reversal pattern; situation dominated by uncertainty.
Reasoning:
The price action shows indecision and fluctuations within a tight range, but repeated tests of support without a strong rebound suggest underlying weakness. Failure to reclaim 2,622 strengthens the case for a short-term short, with a tight stop to protect against potential “fake breakouts.”

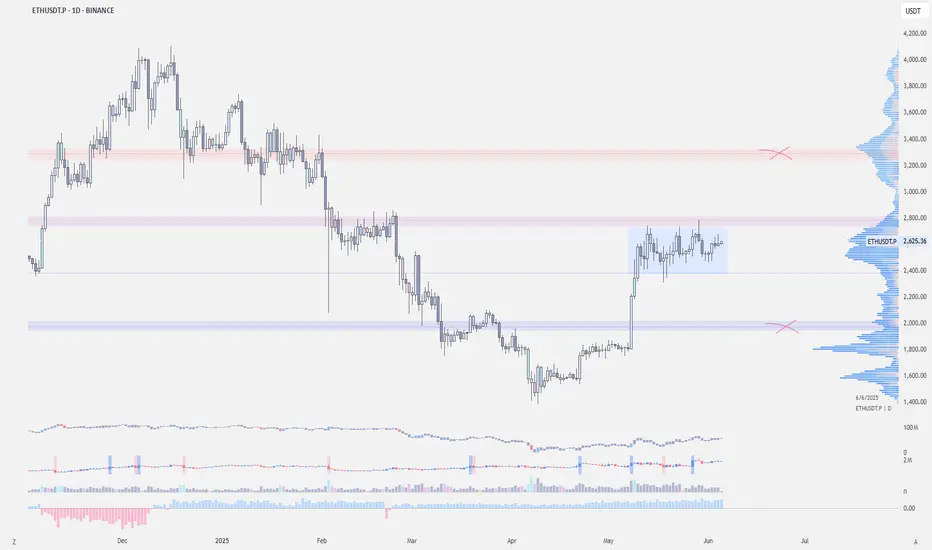
$ETH - Short-term Outlook Ethereum is stuck in a neutral zone. Unless it breaks above the $2.8k resistance, altcoins likely won't see much movement either.
It's consolidating below the resistance, in a high-volume node after strong impulse from $1.7k
No strong seller absorption yet at resistance → suggests indecision
We have to break above the mid-range for a bullish shift or possible retest of the supply zone at $3k to $3.4k
Ethereum Short-Term Prediction Hidden Bullish divergence on Ethereum spotted while reclaiming important Fibonacci level!

Ethereum Prediction update 7% PUMP and Targets HIT! Whats Next?Ethereum hit both of our targets, and pumped by 8% without any leverage!! What is going to happen next?

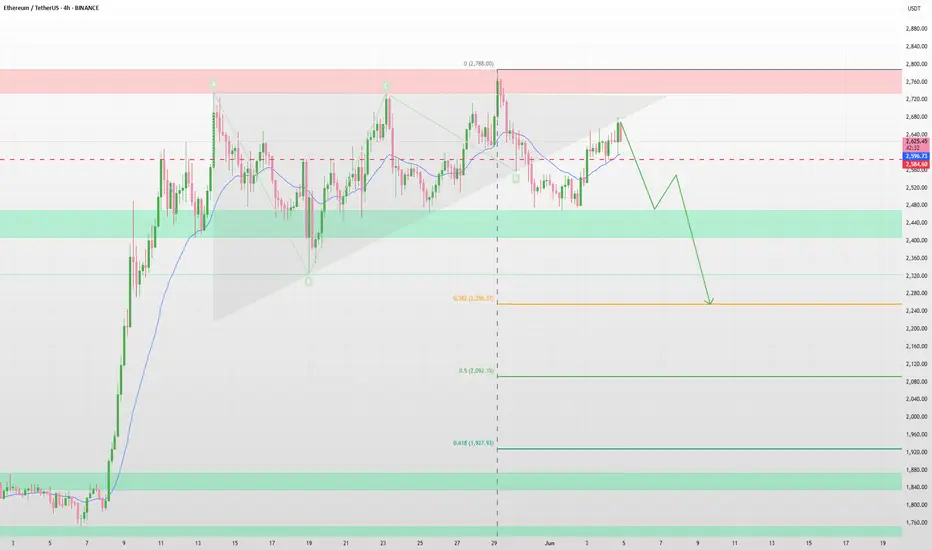
ETH Breakdown Retest in Progress — More Downside Ahead?🧱 Breakdown Retest Structure
The triangle/wedge was broken to the downside around May 28–30.
After the breakdown, price has rallied back and is now hovering around the lower boundary of the broken triangle—classic bearish retest behavior.
This structure often plays out as:
Breakdown → retest of support as resistance → continuation down.
🔴 Confluence for Bearish Outlook:
Lower Highs + Weak Momentum: Recent price spikes are showing rejection wicks near $2,700, indicating seller strength.
Volume Drop: Weak follow-through on the bounce suggests it's a corrective rally, not accumulation.
EMA Pressure: The price is struggling to hold above the 20 EMA, showing hesitation.
Bearish AB=CD Structure: The rally from the bottom might be forming a harmonic ABCD correction before the next leg down.
Major Resistance Zone ($2,720–$2,800) is being respected—multiple rejections are evident.
⚠️ Bearish price projections:
If ETH fails to reclaim $2,720–$2,750 and closes below $2,580 on the 4H chart, expect downside targets:
🎯 Target 1: $2,460 (recent support zone)
🎯 Target 2: $2,220 (origin of the last rally)
🛑 Invalidation: 4H close and hold above $2,800 would invalidate this bearish thesis.
🧠 Summary
You're spotting what looks like a bearish retest after a breakdown, which is a high-probability short setup in technical analysis. While bulls are attempting to push back, unless ETH breaks back into the triangle, the path of least resistance looks down.
📌 Conclusion: Wait for a 4H rejection near $2,700 with strong bearish candle for confirmation. Stop above $2,800. Profit targets: $2,460 and lower.
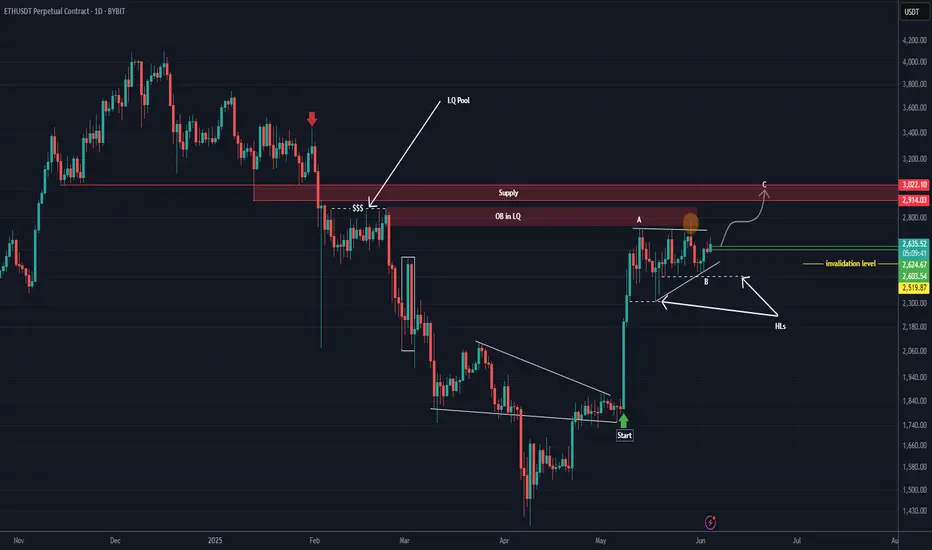
Ethereum is still bullish! (1D)First of all, read the text carefully to avoid any misunderstandings.you should know that the market is currently at a sensitive point, and Ethereum’s bullish move does not necessarily mean other coins will follow the same path.
As marked on the chart, the START of Ethereum’s bullish move began after a lengthy and deep correction. Observing ETH's current behavior, this wave is sharp and appears to be more of a time-based correction rather than price-based. Wave B moved sideways and took significantly more time than wave A, suggesting that wave C could very well begin without a deep pullback, pushing price toward higher levels.
There’s a liquidity pool in the upper area that we’ve highlighted. In order for this momentum to slow down, price likely needs to hunt a major liquidity level.
There was a fresh order block inside the liquidity pool, and although price touched it, there wasn’t a deep reaction | lows weren’t taken out, and all the lows during the correction have remained intact, which is a bullish signal.
It seems that price intends to at least reach the red zone we've marked.
For this scenario to play out, the two green lines near the current price candles must hold. A daily candle closing below the invalidation level would invalidate this outlook.
For risk management, please don't forget stop loss and capital management
Comment if you have any questions
Thank You
ETH Season already STARTS?!⚡️ Hello everyone! It's been quite a while since my last review of ETH, so it's time for an update.
ETH has followed my green path exactly (I repainted it beige on this chart for convenience).
While Bitcoin is stuck at the 106-104,000 level, ETH looks more confident. In addition, the asset is currently fueled by very bullish sentiment in X, as well as a large number of rumors about partnerships.
BUT! ETH currently has the most overheated funding rate, 3 times higher than BTC and even slightly higher than SOL, which is obviously more speculative.
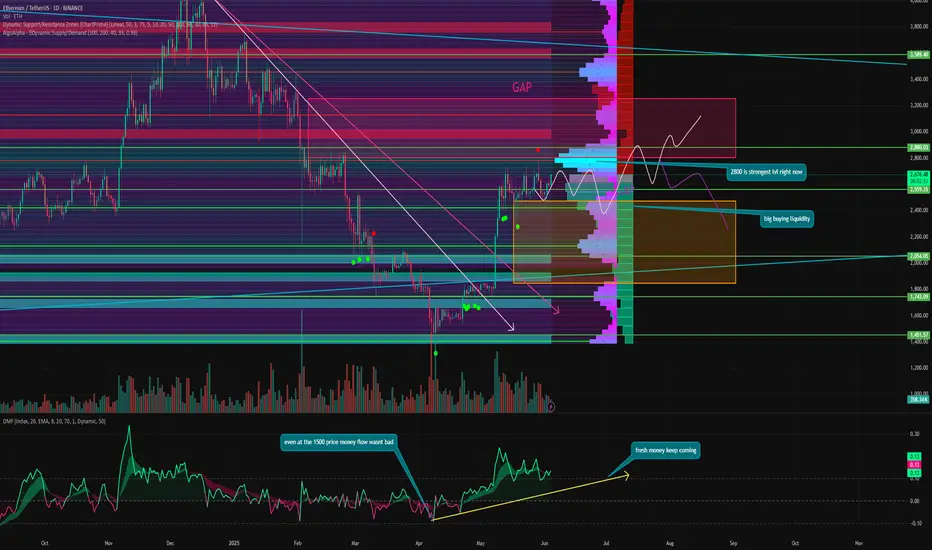
In addition, there is a huge GAP below us, leading all the way to 1,850!
Let's figure out what might await ETH in the near future and why:
⚙️ Metrics and indicators:
DSRZ - resistance at 2800 is currently the strongest level, and ETH is actively storming it, forming an ascending flag.
DSD - a large amount of buying liquidity is at the 2,600 - 2,400 levels. Therefore, we only see wicks from this range. The price almost instantly recovers when it falls below 2,500.
DMF - capital inflows into ETH continue to this day, albeit in smaller volumes, and divergence is observed.
But, surprisingly, even at a price of 1,500, the DMF indicator did not drop significantly, meaning that no one was disappointed in ETH as was suggested in the media. Liquidity practically did not leave the asset.
📌 Conclusion:
ETH now looks much more interesting than BTC. The first cryptocurrency has long since exhausted its momentum, and its small ATH update only confirmed this.
A lot of positivity around ETH is supporting the price and pushing it up. And let me remind you that Ethereum is now almost 50% below its ATH, so it is much easier for it to move.
And a couple more important facts: ETH recently broke SOL's dominance on the daily chart. This means that even in this pair, changes have begun and the less liquid SOL has started to lose ground.
In addition, while there are large outflows from BTC ETFs, there are inflows into ETH ETFs. This means that ETH may indeed be preparing for its momentum.
📊 I see two paths, both on the chart:
Beige - BTC remains in range and ETH begins its movement. Where the first goal is to close the GAP to 3,200.
Purple - the market begins a standard summer correction and ETH, having gathered short sellers' liquidity from 2,800 to 2,900, goes down to close the GAP.
🔥 Have a great summer, guys! Don't forget to take a break from the charts and get some fresh air sometimes!
Ethereum on the Edge?📉 Ethereum on the Edge?
ETH is showing weakness around key resistance, and the current price action suggests a potential move down to $2590 in the coming sessions.
Bearish divergence + low volume = 🚨 warning signs!
💬 What’s your take? Are you bullish or bearish on ETH?
📌 Follow for more real-time crypto insights and market updates!
#Ethereum #ETH #CryptoAnalysis #TradingView #CryptoSignals #ETHPricePrediction
If price doesn’t break you, it’s building you.ETH has been printing higher-timeframe indecision — but within that noise, the structure is crystal clear. We're trading between two OBs. That’s not chaos. That’s preparation.
Here’s the map:
Price has respected the lower OB multiple times — but has yet to displace from it
There’s a clean FVG below, untouched — it’s the draw if this OB fails
To the upside: upper OB is where the game flips — either distribution or continuation
Until then, this is a defined range between intent and indecision
Execution here isn’t about speed — it’s about patience.
How I’m positioning:
A break and close below the OB = short into the FVG at ~2469
If price instead consolidates here and pushes up, I’ll wait for rejection at the upper OB for a reversal short
Only if we displace through the top OB and hold it, do I flip bias back to longs
This isn’t the time to guess. It’s time to observe. Let price do the heavy lifting — your job is to interpret.
More like this — structure-driven setups with real intent — are detailed in the profile description.

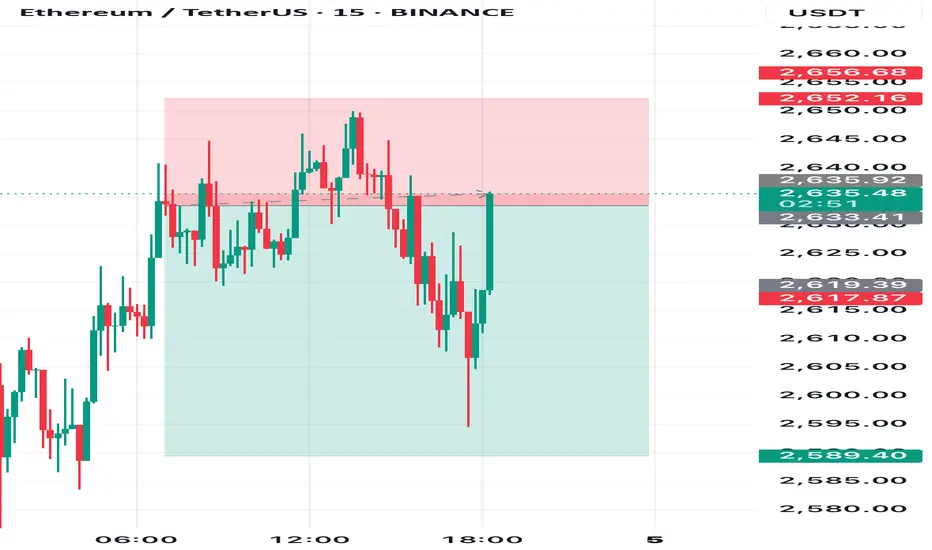
No impulse here is random. Each wick is a message.ETH has been rotating around inefficiency — not in confusion, but in setup.
This isn’t sideways. It’s structured accumulation just beneath premium OB.
Here’s the narrative:
Price swept the local low, then tapped the 2,619.06 level — a key reaction zone
Above us: a 15M OB at 2,639.07 — this is where early longs will either get paid or punished
Below: 2,592.78, the real demand block — if we break down, that’s the last hold before structure flips
The volume profile shows clear interest at mid-range — meaning Smart Money isn’t chasing price. It’s absorbing.
Expectations:
Hold above 2,619 → target 2,639 and reevaluate
Failure below 2,592 → rotation opens into inefficiency
Execution plan:
Clean long above 2,619, invalidation below 2,592
Short only if price flips 2,639 and fails to hold it on the retest
This is a reaction zone — I’m not chasing. I’m positioned.
Don’t confuse consolidation with indecision. Smart Money’s already placed.
More trades mapped like this — before they move — are in the profile description.

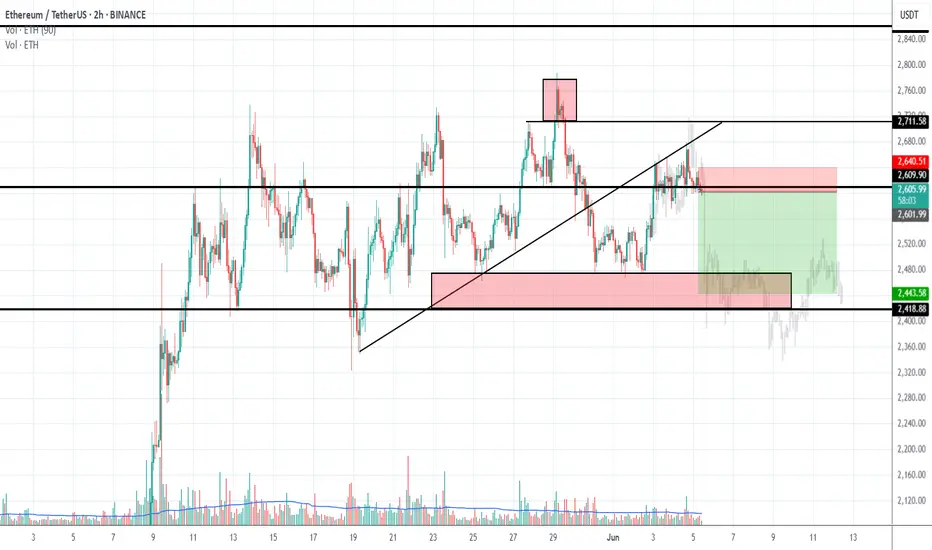
ETH/USDT – Bullish Reversal From Demand Zone | 1H SetupAfter a clean downtrend with lower highs and lower lows, ETH has just printed a clear local reversal from the previous demand zone around $2 480–$2 510 .
Price-action shows us a rounded bottom, that is holding above the 0.5 Fib from the previous pump.
We now see:
✅ Break of structure on the lower timeframes (check 15m)
✅ Price reclaiming 20/50 EMA with increasing volume
✅ Strong green engulfing candle, coming before momentum shift
✅ Stop hunter candle below support and quick recovery aka retest.
Trade Idea:
If ETH holds above $2510–$2520, we may see a strong move toward the next supply zone near $2750–$2780 .
Entry: $2520–$2530
Stop-loss: Below $2440 (or around $2400 for safer invalidation below Fib 0.5)
Targets:
• TP1: $2666
• TP2: $2720
• TP3: $2770
🟩 Watch for confirmation with a candle close above $2540 + volume spike.
🟥 Cancel if price loses $2480 local support zone.
