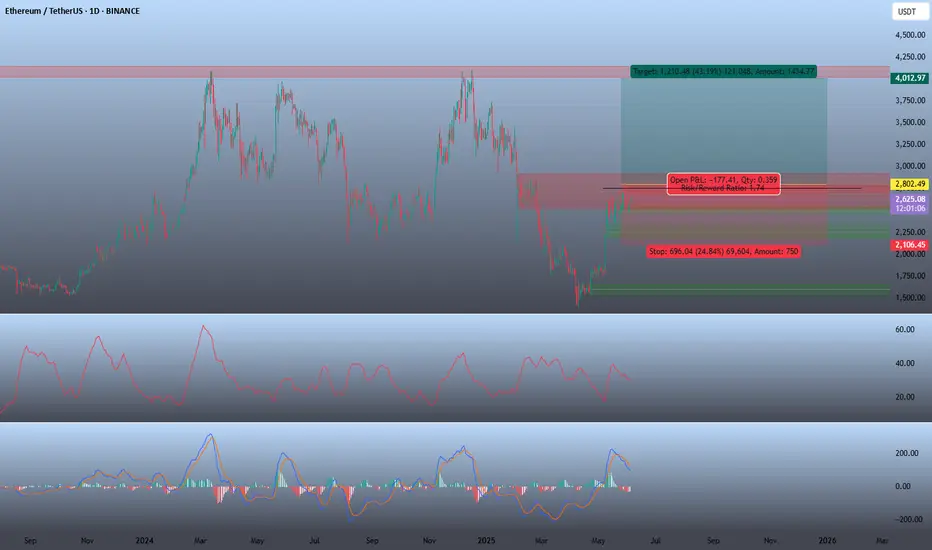
BUY Ethereum (ETH/USDT) Breakout strategy Long term.Instrument: Ethereum / USDT
Timeframe: 1-Day (D1)
Trade Type: Trend Continuation (Conditional Long)
Risk/Reward Ratio: 1.74
Duration: 2–6 months
📉 Trade Parameters (If Triggered)
Entry (Pending Trigger): 2,802.49
Target: 4,012.97
Stop Loss: 2,106.45
Risk: ~24.84%
Reward: ~43.19%
📌 Trade Thesis
This trade will be valid if ETH/USDT reclaims and holds above the 2,800 zone, confirming a bullish breakout continuation.
Currently, ETH is trading below the entry trigger, but the broader market structure and momentum suggest a potential move toward retesting the key breakout zone.
🧱 Structural Context
High-Volume Resistance: The 2,600–2,800 area is a historically significant resistance block, previously acting as supply during multiple failed attempts to break higher.
A clean break-and-hold above this region would confirm accumulation completion and mark a trend resumption.
📉 Momentum Signals
MACD: The MACD remains in bullish alignment, with positive histogram bars and a rising signal line. A renewed MACD surge on breakout would confirm trend continuation.
Stochastic RSI: Recently cooled from overbought and now resetting — this provides momentum room for a fresh leg upward if price breaks out.
🎯 Target Zone Rationale
4,000–4,100 is a macro swing high and psychological resistance area. It represents a natural magnet for bullish momentum once 2,800 is cleared and confirmed.
🧠 Strategy Notes
This is a conditional trade setup — do not enter unless price breaks and holds above 2,800 with supporting volume. The trade structure offers a healthy R:R of 1.74, but the wide stop reflects daily volatility and must be sized accordingly.
Keep watch for:
Bitcoin and NASDAQ correlation
Macro catalysts (e.g., inflation data, ETH ETF news)
Breakout confirmation via candle close above 2,800 on solid volume
ETHUSDT.3S trade ideas
They bought the dip. I anticipated the shift.This ETH setup didn’t require hopium — just structure, volume, and timing.
The chart respected every level I mapped days ago. And now? Price is setting the table again.
We swept liquidity below 2488.11 — textbook turtle soup into a bullish STB on the 1H.
Then price ripped clean into the 4H OB and tapped 2649.12 — the fib extension target. That’s not retail momentum. That’s interbank delivery at work.
Now we’re pulling back. And here’s where it gets clear:
The 0.5–0.618 zone sits between 2586.56–2571.80
It overlaps with the 1H STB zone — a demand pocket from the origin of the expansion
If price consolidates above 2550.78 (the 0.786) and flips 2564.83 again, I expect continuation back toward 2618.32 and 2648.46
If we sweep 2524.01 without reaction — then it’s a deeper rotation
This isn’t a “buy support” setup. This is a model-driven continuation based on structure and internal range logic.
Entry bias is valid above 2580. Below 2524 — it’s invalidated.
I don’t guess entries. I forecast structure.
More models and trades? Check the profile description. Precision lives there.

ETH/USDT Trading Signal🔥 ETH/USDT Trading Signal 🔥
Ethereum is looking strong!
📈 Trend is bullish
💡 Idea: Go LONG if price breaks
2,648🛑Stop−loss:2,592
🎯 Take-profit:
2,700and2,740
Why?
Trend is up
Indicators (RSI & MACD) confirm
Key resistance is about to break!
Like if you think ETH will pump! 🚀
#ETH #Crypto #Trading #Ethereum
Market Crashing? How to Profit from the Dips?Every time the market crashes, do you feel like it's over?
What if those red candles are exactly what pros are waiting for?
In this post, I’ll show you how fear can become profit.
Hello✌
Spend 3 minutes ⏰ reading this educational material.
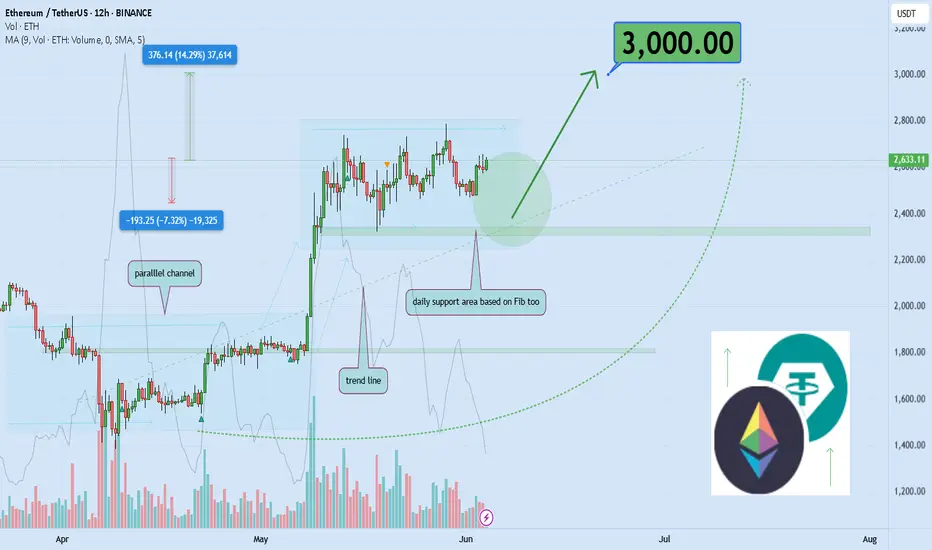
🎯 Analytical Insight on Ethereum :
After a strong recent surge, ETH maintains its bullish momentum, backed by solid trading volume and a well-defined upward structure. A crucial daily support zone—aligned with both a Fibonacci area and a rising trendline—continues to hold firm. My primary target is the psychological $3,000 mark, offering around 14% potential upside if the current momentum persists. 🔍
Now , let's dive into the educational section,
💥 Market Psychology: Why Traders Panic in Crashes
When red candles start stacking up, most traders go into “exit” mode. Emotions like fear of losing money, social pressure, and FUD override logic. The average trader sells at the worst possible moment. Why? Because no one taught them that corrections are part of a healthy market. Meanwhile, seasoned players understand that bear markets are not the end — they're prime territory for growth. Fear is not a warning; it's often a signal.
📊 TradingView Tools to Catch Gold in the Red
TradingView is more than just a charting platform — it's a full toolkit for reading the market’s emotional state. One of the most effective tools during dips is the Volume Profile . It reveals where big money is stacking up. When prices fall but volume spikes, it often signals accumulation by whales. Another useful resource is the Fear & Greed Index , which, while external, can be embedded in custom TradingView dashboards to gauge sentiment.
Then there's RSI on lower timeframes , which helps spot oversold conditions and potential reversals. MACD Divergences also offer golden entry signals when paired with price action. And here’s the real kicker: you can use Pine Script to create custom alerts for all these indicators — so you’re not just reacting to fear, you're stalking opportunity.
🧠 Flip the Script: Discount or Danger?
Perspective is everything. If you see dips as danger, your instincts will push you to run. But if you see them as discounts, you’ll start planning your moves. Simple price action tools work wonders here. Look for double bottoms on the 4H, or Pin Bars on strong support zones. But be patient — always wait for confirmation. The real difference between losing and winning traders? One waits. The other guesses.
🛠 Smart Entry Strategies During Bloody Markets
Let’s get practical. If the market has dropped 20%, consider using a DCA (Dollar Cost Averaging) strategy. Break your capital into 3–5 parts and enter at different key support levels. Another strong setup is the Breakout-Retest Entry: wait for a key level to break, then re-enter after a pullback. Stop losses? Use the ATR to calculate realistic SL zones — and yes, you can display this dynamically on TradingView. Alerts, backtests, and auto-calculations make your game clean, not lucky.
🧩 Recap & Final Suggestion
When fear floods the market, the smart see opportunity. With the right mindset and TradingView tools in hand, you can shift from panic-driven reactions to data-driven decisions. Discipline, proper tools, and a fresh perspective — that's your winning trio during a crash. Open your charts, prep your indicators, and get ready to do what the pros do: profit from fear.
always conduct your own research before making investment decisions. That being said, please take note of the disclaimer section at the bottom of each post for further details 📜✅.
Give me some energy !!
✨We invest countless hours researching opportunities and crafting valuable ideas. Your support means the world to us! If you have any questions, feel free to drop them in the comment box.
Cheers, Mad Whale. 🐋
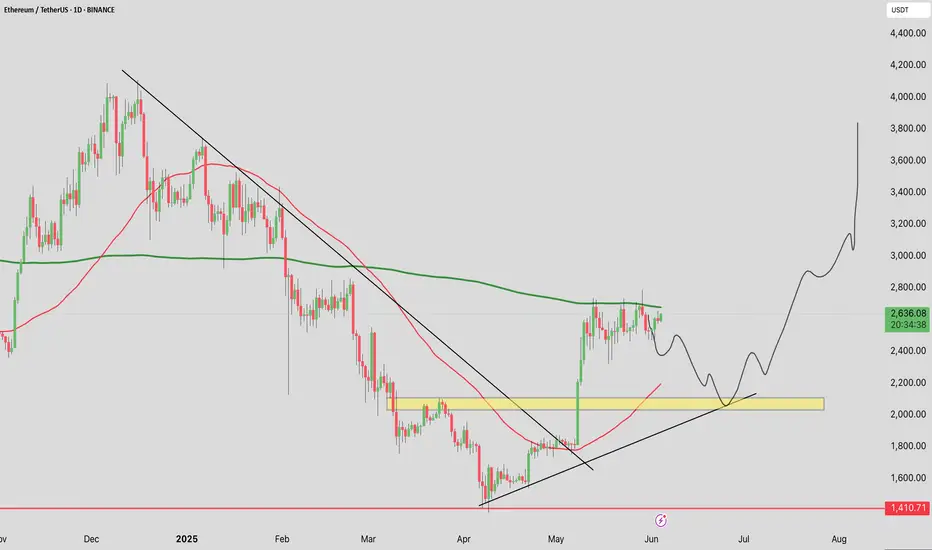
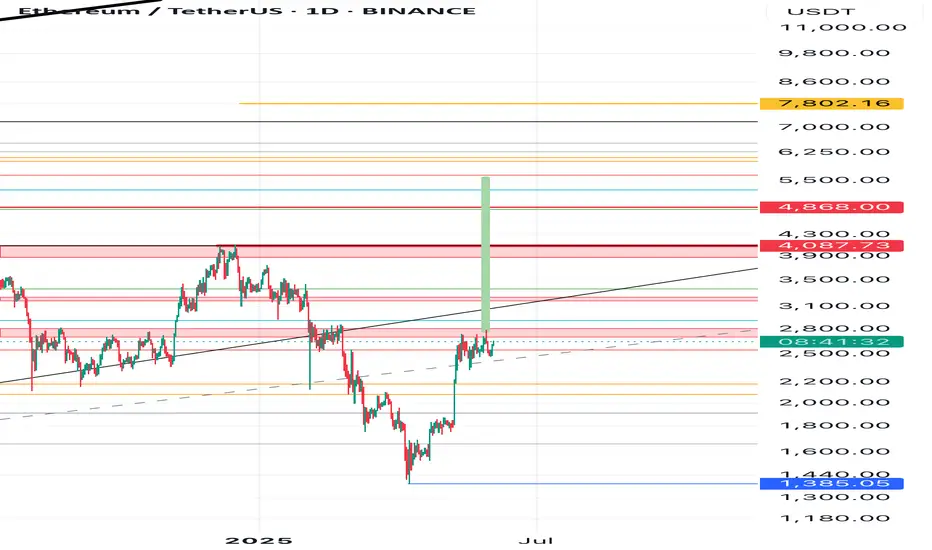
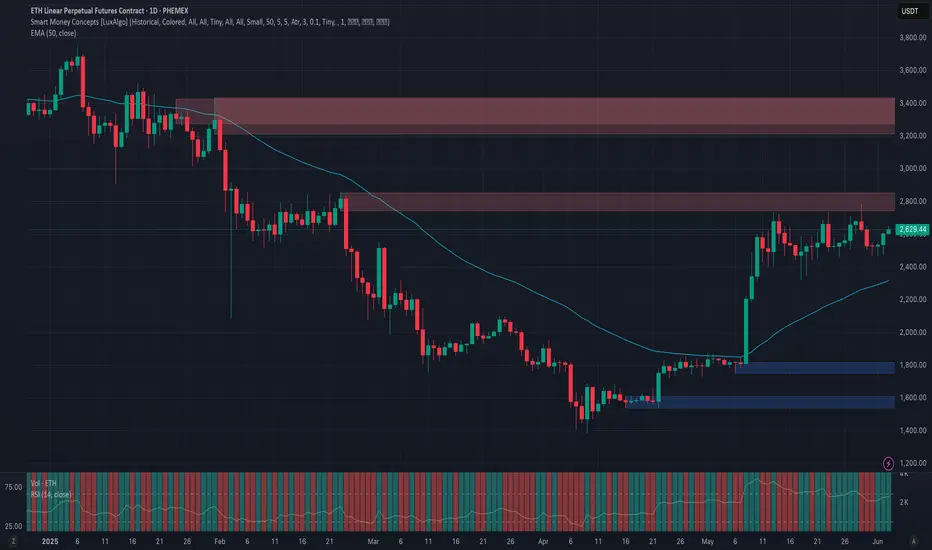
ETH/USDT 1DAY CHART UPDATE !!ETH has broken out of a long-term downtrend (black diagonal trendline) and is now in a consolidation phase below the $2,800–$2,850 resistance.
The price is currently $2,612, showing hesitation below the key horizontal resistance.
Resistance Zones:
$2,800–$2,850: Key horizontal resistance. Breaking above this confirms bullish continuation.
$3,200 and $3,600: Medium to long-term bullish targets.
Support Zones:
$2,000–$2,200: Strong horizontal support + ascending trendline + 50 EMA (red line)
$1,410: Key long-term support (unlikely to be tested soon unless the market reverses)
ETH breaks and closes above $2,850 ➝ $3,200 → $3,600 → $3,800+ likely to rise
The structure suggests that a higher low will likely form before the breakout.
If ETH rejects at $2,850, expect a retest of $2,000–$2,200 (golden zone)
This would create a bullish higher low setup and could be a strong buy-dip opportunity.
Thanks for your support!
DYOR. NFA
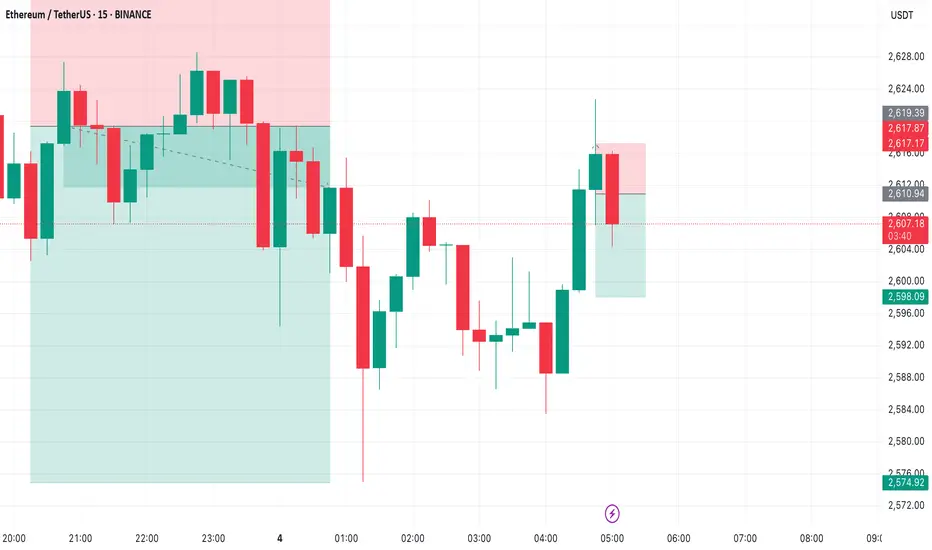
ETH/USDT – Short-Term OpportunityETH/USDT – Short-Term Opportunity
Ethereum is showing weakness below resistance, and sellers are stepping in.
Looking for a quick short play with a target at $2,598.
⚠️ Watching price action closely for confirmation — clean risk/reward.
📉 Follow for real-time setups, no noise — just sharp trades.
ETH/USDT – Short-Term Bearish SetupETH/USDT – Short-Term Bearish Setup
Ethereum is struggling to break through resistance and showing signs of exhaustion.
I'm watching a short opportunity with a near-term target at $2,575.
🧠 Clean structure – potential pullback on the table.
📉 Let’s see if the bears take control. Follow for live setups & smart trades.

Price doesn’t chase liquidity. It engineers it.ETH is mid-delivery — not in trend, not in reversal — but in execution. This is where most get faked out. I’m just reading the structure.
Here’s the play:
We’ve tapped into the FVG 4H, reacting from an inefficiency left by the last aggressive selloff
Above that, the BPR 4H marks a supply zone engineered for reaction, not breakout — that’s where early longs will get tested
Fib levels are clean: price is hovering around 0.5 (2,623.76), with clear tolerance for a dip into the 0.618–0.786 (2,584–2,528)
Two paths from here:
A clean push into 2,662.89 → 2,711.32, possibly even sweeping into 2,789.59, followed by rejection from premium imbalance
A deeper pull into OB 4H at 2,457.92 before any real mark-up begins
Execution mindset:
Intraday longs are valid as long as we hold above the 4H OB
HTF liquidity targets sit above 2,660 — but the smarter entries were already taken lower
If we reject the BPR without breaking 2,662, I expect a controlled drop back into discount
This isn’t a breakout. It’s a rebalancing. You don’t follow price. You align with its logic.
For more setups with structure, not noise — check the account description.

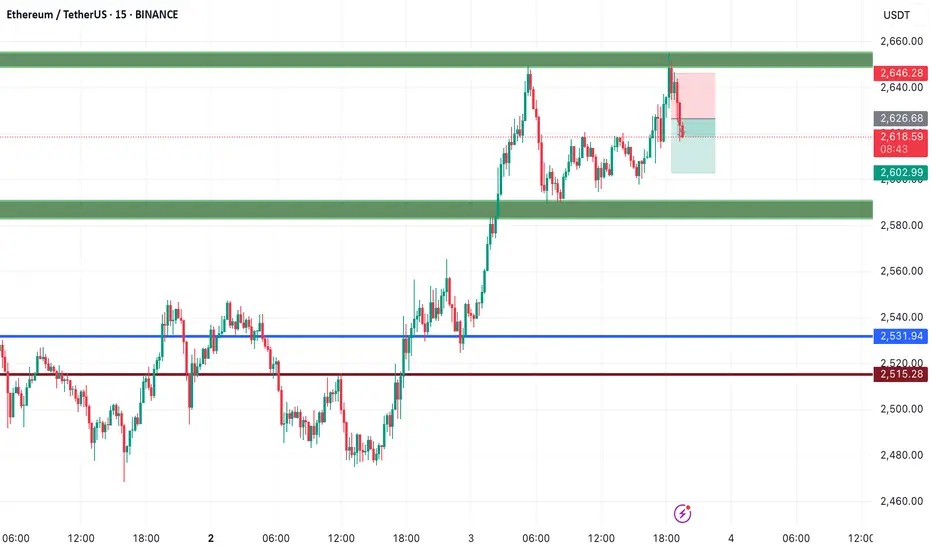
ETH/USDT – Short-Term SetupETH/USDT – Short-Term Setup
Ethereum is showing signs of weakness after hitting resistance.
If this structure holds, a short position targeting $2,602 looks promising in the short term.
🎯 Waiting for confirmation? Watch the 15–30min chart closely.
📉 Quick moves. Clean risk. Let’s trade smart.
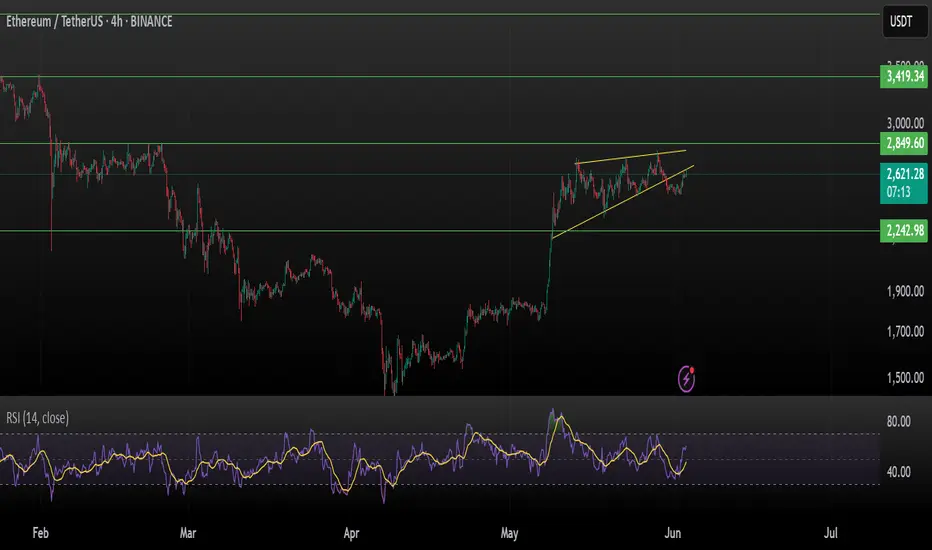
ETH/USDT – Breakout Brewing?Ethereum is currently consolidating within a bullish ascending triangle on the 4H chart. The price is coiling just below the key resistance, so a breakout could ignite the next leg up.
RSI hovering near 50 shows room for momentum buildup.
Setup Analysis:
Structure: Bullish ascending triangle
Momentum: Healthy consolidation after strong rally
RSI: Mid-range, potential to climb
Key Levels:
Resistance: $2,849
Support: $2,430 | $2,243
Breakout Target: ~$3,200 and possibly $3,420 if momentum sustains
Entry (Breakout Play):
Above $2,850 on strong volume
Target Zones:
$3,200, $3,420
Longer-term: $4,050
Stop-loss:
Below $2,430 (pattern invalidated)
Watch closely — breakout confirmation could present a solid bullish opportunity.
This is not financial advice, please do your research before investing, as we are not responsible for any of your losses or profits.
Please like, share, and comment on this idea if you liked it.
#Ethereum #ETH #CryptoTrading #TechnicalAnalysis #Altcoins #Breakout #ETHUSDT #BullishSetup
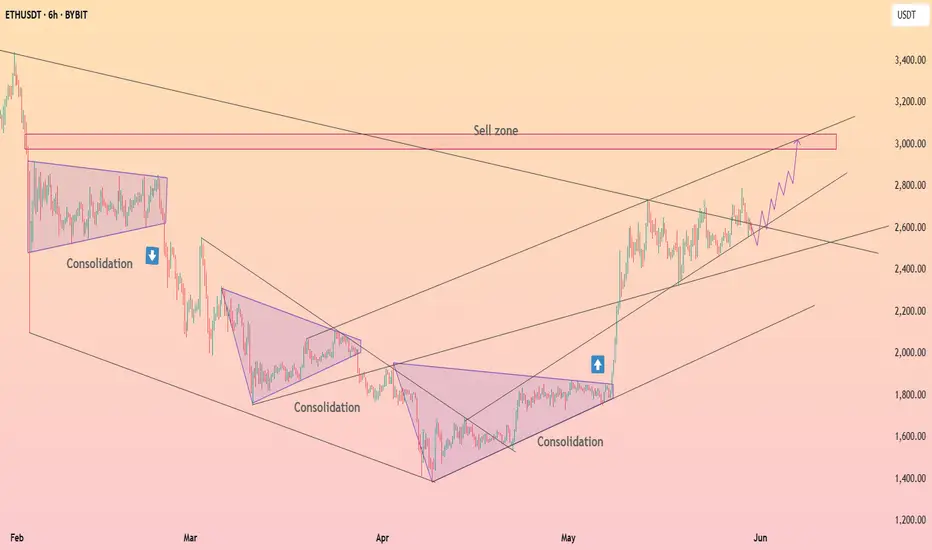
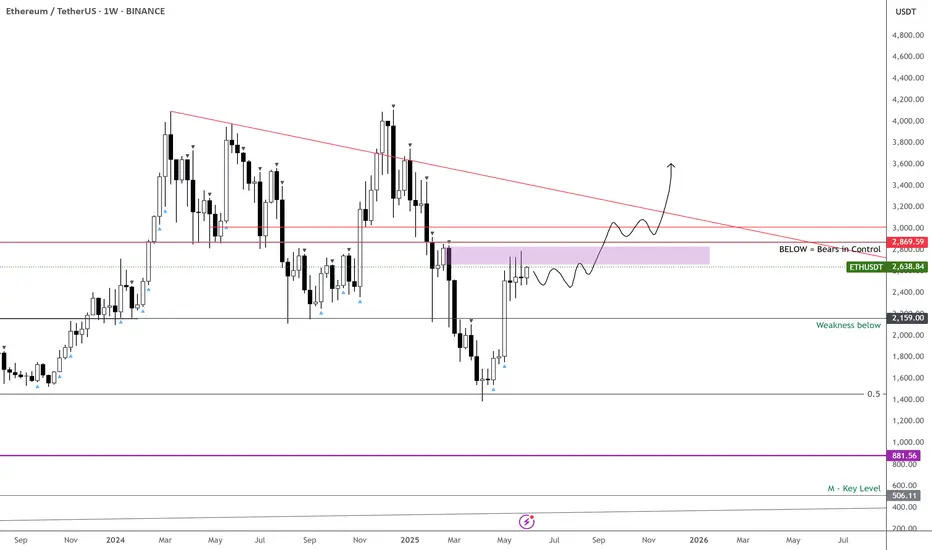
HolderStat┆ETHUSD road to the sell zoneCRYPTOCAP:ETH price ascends inside a neat channel after a trio of consolidations. The chart’s marked sell zone near 3 100 USDT aligns with upper resistance, yet current higher-low structure, breakout arrows and supportive trendline suggest bulls intend to test that ceiling soon.
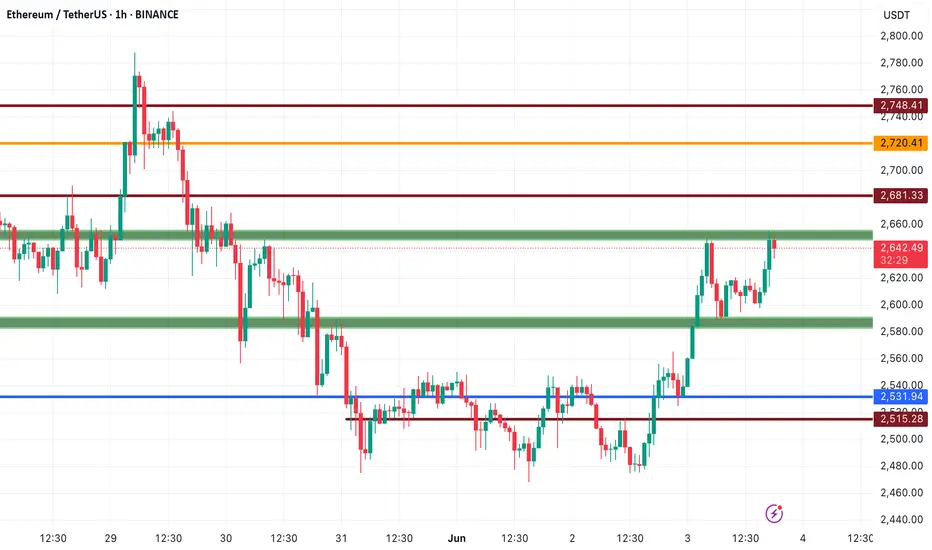
Ethereum (ETH/USDT) Technical Analysis | Breaking the Trend📈 Ethereum (ETH/USDT) Technical Analysis | Breaking the Trend – What's Next?
As shown in the chart, Ethereum has broken out of the descending trendline and is now moving upward with strength. However, price is currently facing a key resistance at $2,647, which has acted as a supply zone in previous sessions.
🟢 Bullish Scenario: Break and Rally
If ETH can successfully break above the $2,647 resistance, the next upside targets are:
$2,680 – mid-level resistance with past reactions
$2,720 – a strong psychological and technical resistance
A clean breakout above these levels could confirm a bullish continuation and bring more momentum to the market.
🔻 Bearish Scenario: Rejection and Pullback
If the price fails to break this resistance and shows signs of bearish rejection, we may see a short-term correction. Key support levels to watch:
$2,620 – minor support
$2,609 – key intraday support
$2,572 – a stronger demand zone if the correction deepens
📌 Conclusion
Ethereum is at a critical decision point. A breakout can fuel bullish momentum, while a rejection may trigger a pullback. Watch for candlestick confirmations and volume surges for better trade entries.
🚀 Like this clean & focused analysis?
📲 Hit follow for more real-time updates, actionable setups, and smart technical breakdowns. No noise – just charts that speak. Let's grow your trading edge together! 💡📊
ETH Price Action Explained – What the Charts Are Really Saying?🔍 Taking a look at Ethereum ETH right now across multiple timeframes…
On the lower timeframes ⏱️, we’re seeing a bullish break 💥 that might spark some enthusiasm 🚀, but when you zoom out and get that macro perspective 🌐, my outlook shifts from to one of caution ⚠️.
📊 ETH is currently trading into a key resistance level 🧱, and if we step back and view the bigger picture, we can clearly see that it’s been range-bound 🔁 for quite some time.
On the lower timeframes, there might be an opportunity to squeeze a bit out of the range 🎯 by trading between the highs and lows—but keep in mind, this approach is not for the feint hearted ⚡.
📹 This video is purely analysis 🧠, not a trade idea. I’m sharing my thoughts and market view 📈, and I hope you find it helpful and insightful 💡.
🚫 Not financial advice.

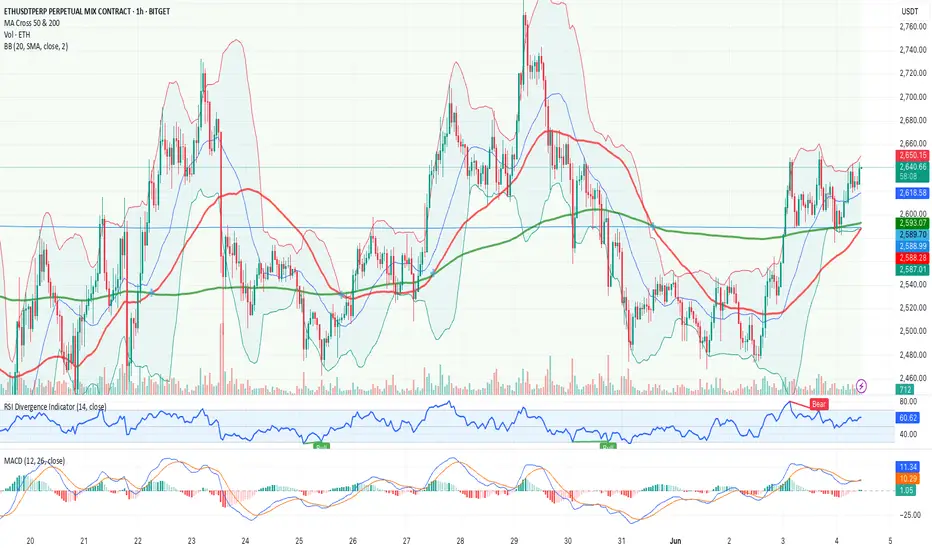
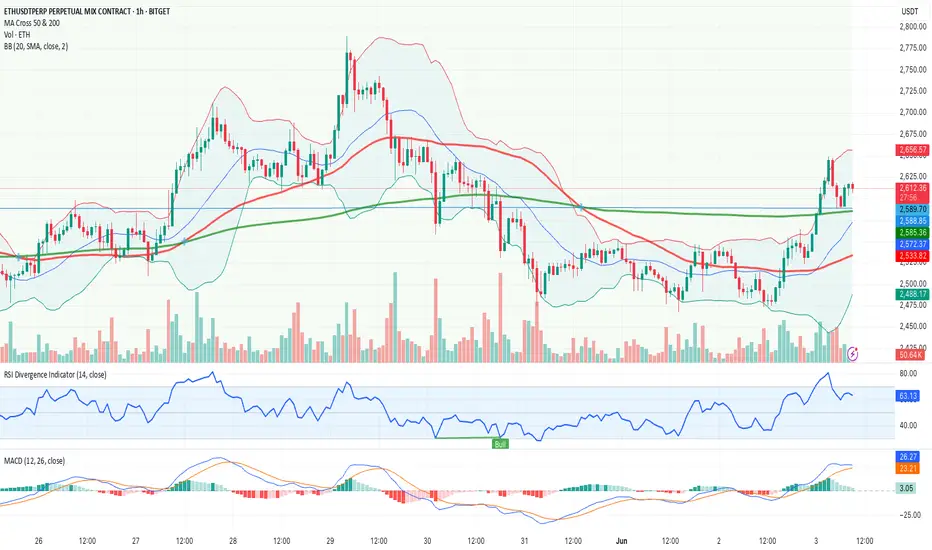
ETH/USDT Ready for a Bullish Rally? Key Breakout Levels to WatchHey Traders!
Ethereum just delivered a strong move on the 1H chart – let’s break down the setup:
📊 Trend:
Momentum has shifted bullish! ETH has smashed through both the 50 and 200 moving averages, and price is riding above the mid-Bollinger band.
⭐️ Key Levels:
Support:
2
,
589
(
M
A
200
)
,
2,589(MA200),2,572 (Bollinger Middle Band)
Resistance: 2,656 (upper band & recent high), next target 2,690
🔎 Technical Indicators:
RSI: 62 – showing healthy bullish momentum, not yet overbought
MACD: Bullish crossover and expanding, confirming strength
Volume: Notice the volume pick-up on the breakout, increasing conviction!
🎯 Trading Plan:
Direction: LONG
Entry: $2,605
Stop-loss: $2,572 (below recent cluster & MA200 for tight risk)
Take-Profit 1: $2,656
Take-Profit 2: $2,690
💡 Confidence: Medium – watch for follow-through above $2,656 for extra confirmation!
🔥 Extra Notes:
Breakout traders, this could be the push for a new leg up. No bearish divergence on indicators; momentum is with the bulls. Watch closely for any fake-outs – a tight stop keeps risk controlled.
Will ETH keep rallying or will the bears step back in?
Drop your thoughts below! 👇🚀
#ETH #Ethereum #Crypto #TradingSignal #Bullish #Breakout #TradingView
Let me know if you want to tweak it for an even punchier effect or add a custom hashtag!
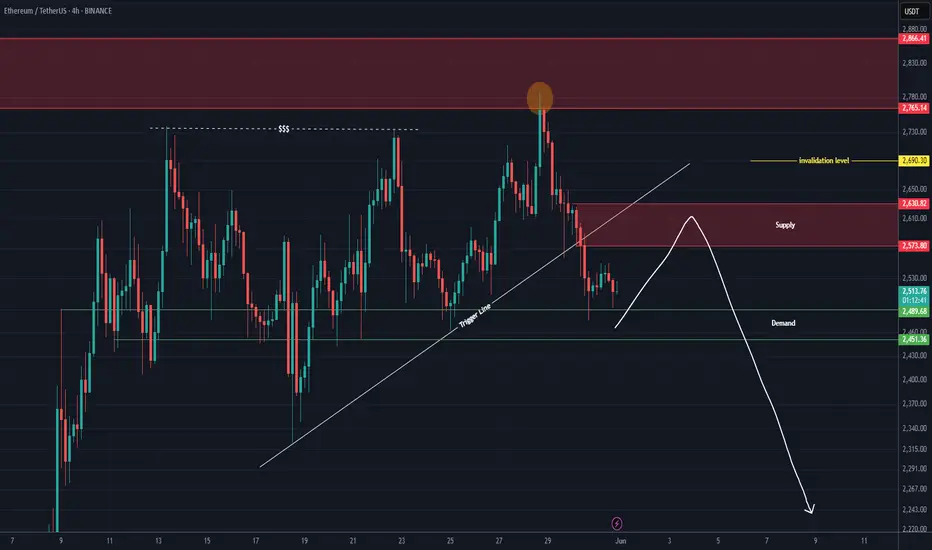
ETH is still bearish (4H)This analysis is an update of the analysis you see in the "Related publications" section
Ethereum has now reached a support zone after sweeping the liquidity pool and the supply area at the top of the chart, as marked in the previous analysis. It has lost the trendline, and a slight upward recovery is expected before potentially being rejected again toward lower levels.
A daily candle closing above the invalidation level would invalidate this analysis.
For risk management, please don't forget stop loss and capital management
Comment if you have any questions
Thank You
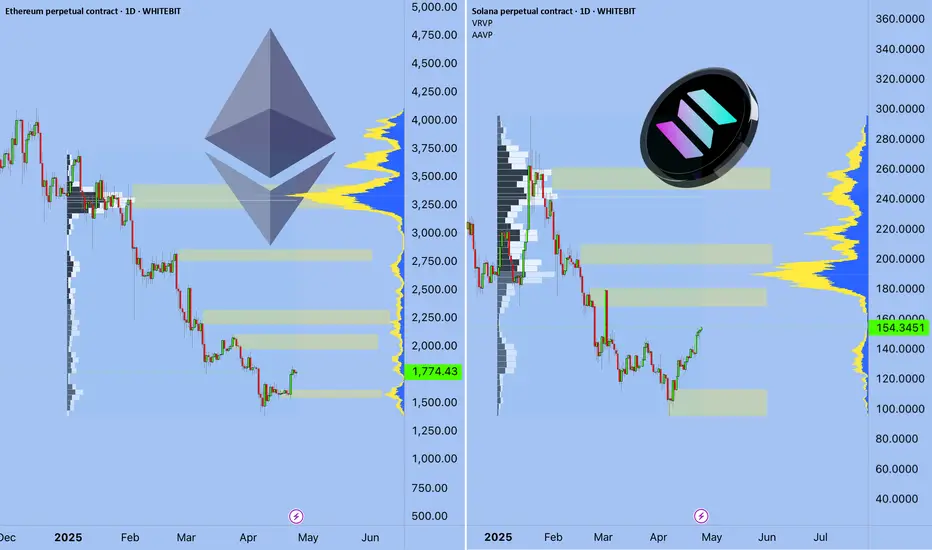
Ethereum vs SolanaIn 2025, the competition between Ethereum and Solana is no longer just a rivalry — it’s a pivotal chapter in blockchain evolution.
We are witnessing a clash of two philosophies:
Ethereum — maturity, security, and deep ecosystem
vs.
Solana — speed, efficiency, and adaptability.
📈 Price Resilience vs. Market Legacy
While Ethereum still holds the crown in market cap and institutional trust, Solana is rewriting the rules with superior transaction speed and cost-effectiveness.
The question is no longer "Who is better?"
It’s "Who is evolving faster?"
⚡ Key Drivers Shaping the Ethereum-Solana Rivalry
1️⃣ Scalability vs. Stability
Solana leads with up to 65,000 TPS, attracting high-frequency traders, NFT creators, and DeFi innovators.
Ethereum, relying on its Layer-2 solutions, tries to balance security with scalability.
2️⃣ Institutional Shifts
Funds like Galaxy Digital and Ark Invest are reallocating capital towards Solana, betting on efficiency and growth.
Ethereum, meanwhile, is waiting on ETF approvals to regain momentum.
3️⃣ Technological Innovation
Ethereum focuses on sharding and Layer-2 expansion.
Solana pushes aggressive ecosystem growth but pays the price with occasional network instability.
📊 Market Performance Snapshot — 2025
Ethereum: ▼ 56% YTD | ~$1,600
Solana: ▼ 40% YTD | ~$135
Solana’s DEX market share jumped to 39.6% in Q1, driven by meme coins and retail traders.
Ethereum’s dominance continues to erode under macro pressures and rising competition.
But don’t be fooled — Ethereum's foundation remains strong. Institutional adoption and infrastructure upgrades still offer potential for a rebound.
📉 ETH/BTC Looks Like a Meme
ETH/BTC:
SOL/BTC: Potential -50% in next 160 weeks ➡️
ETH/SOL:
⚡ Where Did the Liquidity Go?
The real question isn’t why ETH is dropping —
It’s why no one cares.
Layer 2 solutions — Arbitrum, Optimism, Base — have drained liquidity from Ethereum’s mainnet.
DeFi activity? → Migrated to L2
Users? → Choosing lower fees and speed
Ethereum L1? → A blockchain for whales and archives
No liquidity = No rally
No narrative = No attention
Funds are betting on Solana and L2, not Ethereum’s base layer.
🎯 When Could ETH Take Off?
Only if we see:
A strong “Liquidity Returns to L1” narrative (RWA could be a trigger)
Spot ETH ETFs launching with institutional accumulation
A new DeFi wave on L1 (unlikely with current gas fees)
Or simply — when the market decides to pump forgotten assets
For now, Ethereum is about patience.
Smart money is flowing into L2, Solana, and high-risk narratives.
🕒 But Time Will Tell...
Today, we debate ETH vs. SOL.
Tomorrow — the bull market ends, and we’ll be discussing entirely different narratives.
Are you SOL or ETH?
As always, stay one step ahead.
Best regards,
EXCAVO
______________________________
Disclosure: I am part of Trade Nation's Influencer program and receive a monthly fee for using their TradingView charts in my analysis.
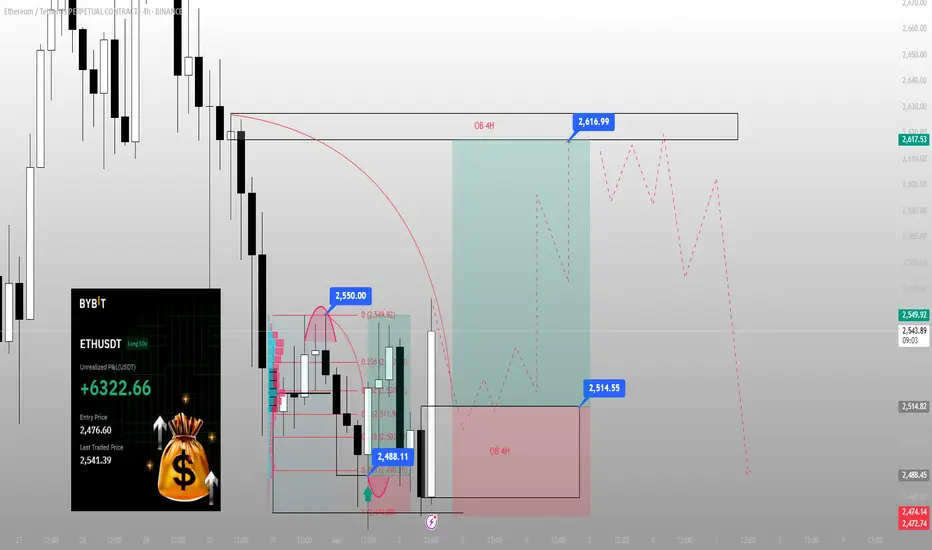
ETH/USDT 4H Chart Analysis – Bullish Continuation with Profit You're currently in a solid long position from 2,476.60, and with the price now at 2,537, your unrealized P&L shows strong gains (+$6,322.66). The technicals support your trade with the following highlights:
📊 Key Technical Insights:
Entry Zone: 2,476 – 2,488 (ideal long from OB + 0.786 fib retrace)
OB 4H Supply Target: 2,616.99 – potential area of resistance
Current Price Reaction Zone:
2,550 tapped and acting as interim resistance
Midterm pullback expected toward 2,514–2,490 before another leg up
🎯 Targets:
TP1: 2,550 (hit)
TP2: 2,616.99 (next key resistance/OB)
TP3: Trail to 2,660+ if momentum sustains
🛑 Stop-Loss Consideration:
Below 2,474 = invalidation of structure reclaim
🔁 Possible Scenarios:
Continuation to OB 4H
✔️ Breaks and holds above 2,550
✔️ Momentum push to 2,616
Retest Before Push
🔁 Pullback to 2,514 or 2,488 zone
🔁 Reaccumulation for next move
Failure Risk
❌ Rejection from 2,550–2,560
❌ Break below 2,474 = setup invalidated
📌 “Strong move off the lows with excellent risk-reward. Watch OB 4H at 2,616 closely for next decision zone.”
Phemex Analysis #86: Pro Tips for Trading Ethereum (ETH)Ethereum ( PHEMEX:ETHUSDT.P ) has captured traders’ attention after experiencing a notable 50% rise since early May. Currently, ETH has been consolidating between $2,800 and $2,300 for approximately three weeks. This sideways movement indicates that the market could be in a phase of accumulation, potentially preparing for a bullish breakout. However, traders should remain cautious, as consolidation can sometimes precede bearish trends as well. Let's carefully evaluate several possible scenarios to better understand Ethereum’s next potential move.
Possible Scenarios
1. Breakout Rise (Bullish Scenario)
If Ethereum successfully breaks the critical resistance at around $2,855, particularly with increased trading volume, this would strongly signal the onset of a bullish trend. Such a breakout could attract additional buyers, further fueling upward momentum.
Pro Tips:
Entry Strategy: Consider entering a long position only after ETH clearly surpasses $2,855 with substantial volume.
Risk Management: Place stop-loss orders below the recent resistance-turned-support area around $2,800 to safeguard against potential fake-outs or reversals.
2. Retesting Support Levels (Bearish Scenario)
Should Ethereum fail to surpass the $2,855 resistance zone convincingly, a pullback towards lower support levels becomes likely. Significant areas to monitor in such a scenario include support at $2,320, $1,750, and potentially as low as $1,536.
Pro Tips:
Buy the Dip Carefully: Watch closely for price stabilization at these support levels before initiating accumulation.
Risk Consideration: Avoid aggressively entering positions if price shows accelerated declines with increasing volume. Always wait for confirmed support and reversal signals.
3. Continued Consolidation (Range-bound Scenario)
Ethereum might extend its current consolidation, continually bouncing within the range of $2,300 to $2,800. This scenario presents unique opportunities for traders to capitalize on repeated price movements.
Pro Tips:
Grid Trading Bots: Implement a Grid Trading strategy to effectively capitalize on small but frequent price fluctuations. Start long grid positions near the $2,300 support area and short grid positions around the $2,800 resistance.
Caution and Risk Management: Always set clear stop-loss levels outside the trading range, specifically below support or above resistance, to protect against sudden trend reversals or breakouts.
Conclusion
Ethereum’s current price action presents traders with multiple strategic opportunities, whether through breakout trades, support-level retests, or consolidation strategies. By remaining vigilant, monitoring key levels, and employing disciplined risk management, traders can effectively navigate Ethereum’s evolving market conditions and enhance their trading outcomes.
Tips:
Elevate Your Trading Game with Phemex. Experience unparalleled flexibility with features like multiple watchlists, basket orders, and real-time adjustments to strategy orders. Our USDT-based scaled orders give you precise control over your risk, while iceberg orders provide stealthy execution.
Disclaimer: This is NOT financial or investment advice. Please conduct your own research (DYOR). Phemex is not responsible, directly or indirectly, for any damage or loss incurred or claimed to be caused by or in association with the use of or reliance on any content, goods, or services mentioned in this article.
ETH – Watching the $2,900 Trigger for ATHsJust need BINANCE:ETHUSDT to break above $2,900 for the next trigger.
Feeling confident it will chew through the current supply zone.
Plenty of other coins are already showing clear direction, and Ethereum should follow.
Be patient—I doubt ETH will challenge the #1 spot, but a move above $2,900 opens the door to a potential new ATH.
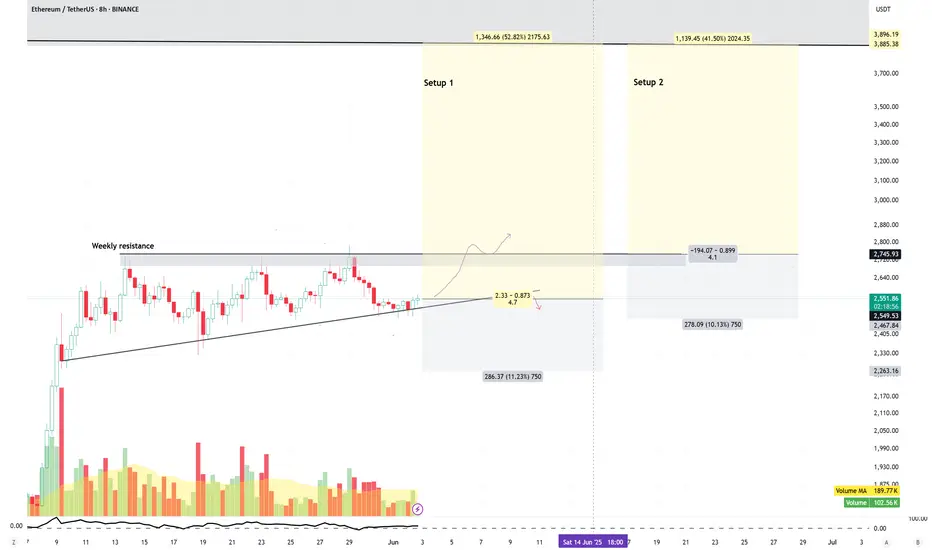
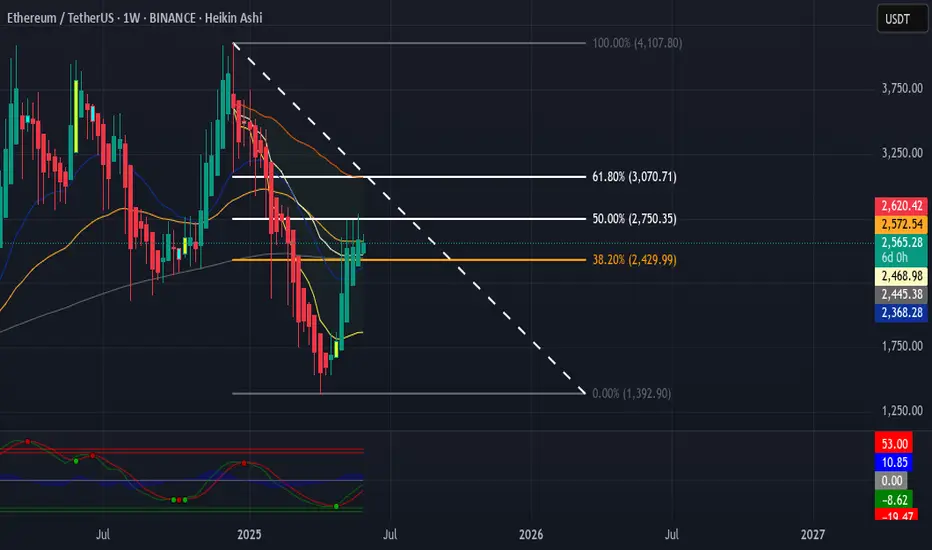
Eth is fallingEth falls perfectly in the golden zone for fib retracement on weekly. currently trending between 200ma on daily and vwap for weekly.
Long ETH
ETH has been consolidating below the weekly resistance for almost three weeks.
In 8H TF, ETH is forming an ascending triangle, a bullish price-action.
Two proposed setups are as in chart.
Disclaimer:
This analysis is based on my personnal views and is not a financial advice. Risk is under your control.