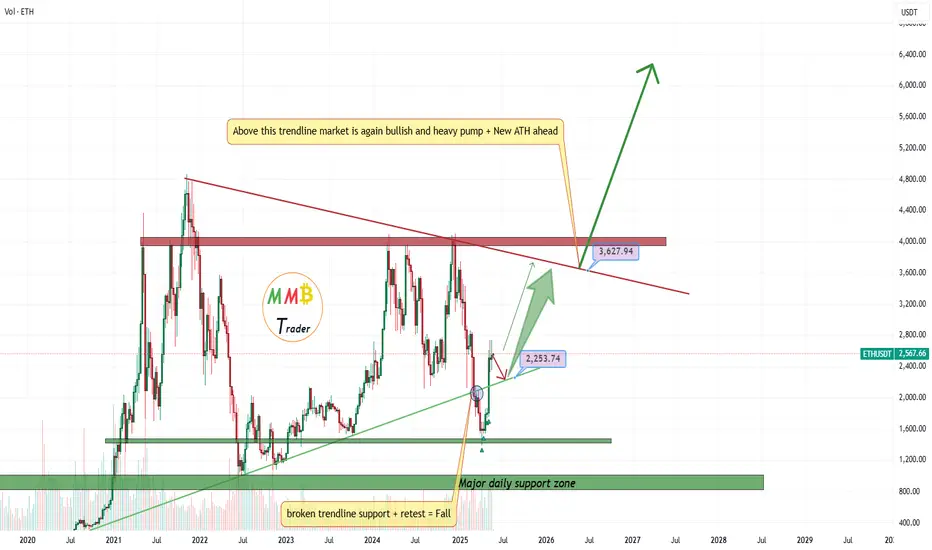
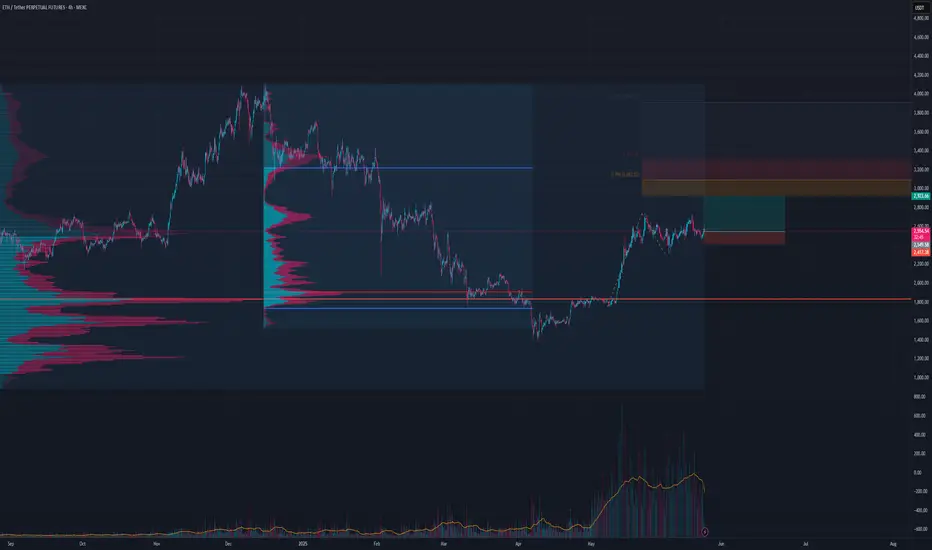
ETHUSDT still sleep but soon will break the NewsETHUSDT this time will touch new ATH with Bitcoin pump not like previous time sleep price is still weak but first resistance is broken and soon will pump above 3000$ and the journey will start there and huge pump will lead ASAP.
DISCLAIMER: ((trade based on your own decision))
<<press like👍 if you enjoy💚
ETHUSDT.3S trade ideas
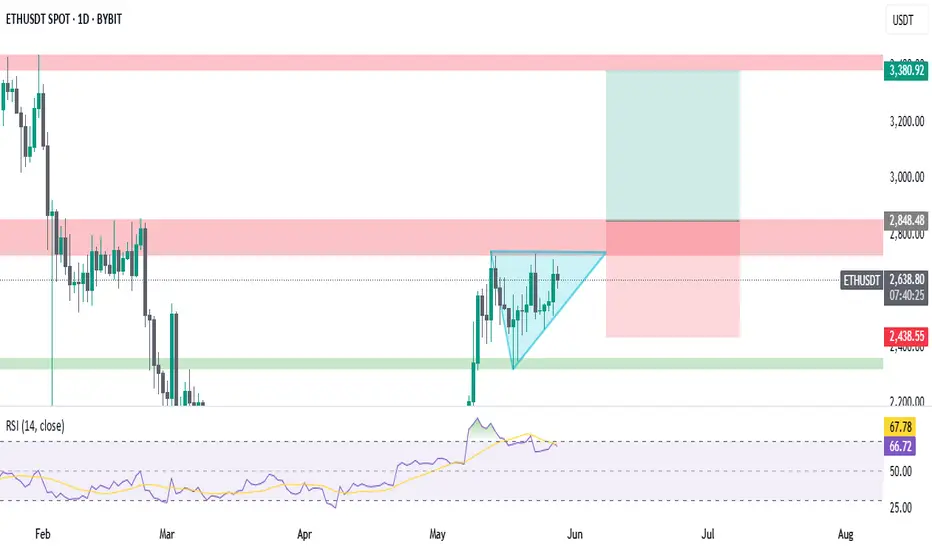
ETHEREUM - ETH - Crypto - Buy IdeaETH forms an ascending triangle near a key resistance zone, indicating potential bullish continuation. A breakout above this range could trigger a rally towards the next major resistance at $3380. The RSI is holding above 65, showing strong bullish momentum. A breakout from the triangle with strong volume may confirm the bullish setup.
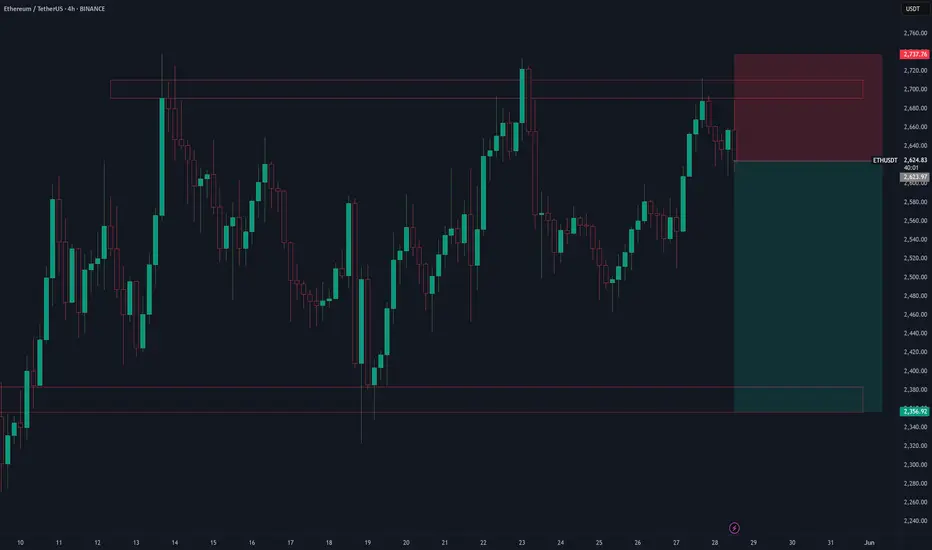
short ETHETH bounced off the resistance level. Bearish movement to support level at $2356 is expetced to happen
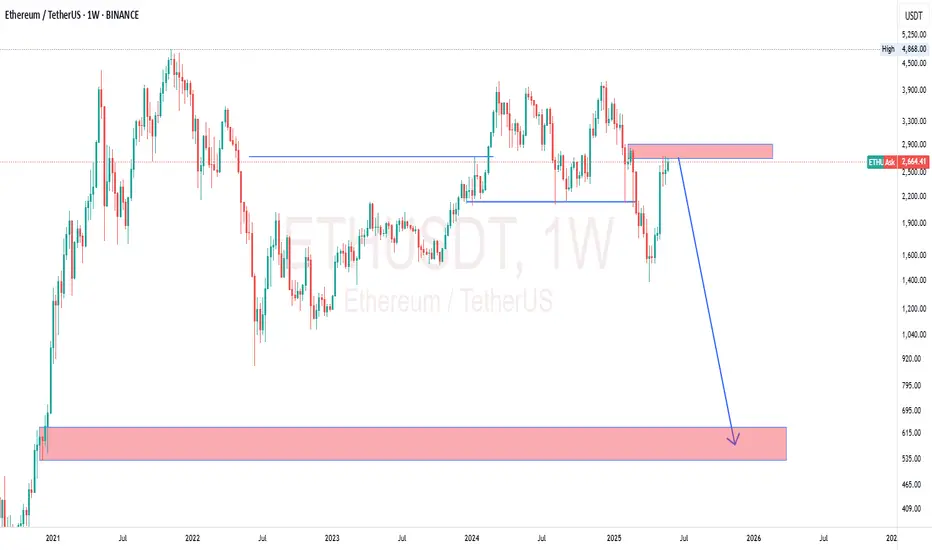
ETHUSDTEth on weekly chart.
i saw more selling coming than buying, though we are expecting alt coin to go bulish, but if eth failed to go bulish we shldnt exxpect any other coin to be bulish as well. the altcoin season is likely to happen may coming year

ETHusdtas we are expecting alt season, i always make use of eth as number one alt as case study, in which i dont see any clear sign that we are going to enter alt season any moment from now. this is weekly chart, i want to see price reaction around that zone . but i have sell bias instead of buy bias for now
Ethereum (ETH): Buyers Going For Second AttemptBuyers failed to form a proper breakout the first time on Ethereum, while currently we are seeing another buyside volume accumulation happening.
While we have a smaller long position open on ETH, we would suggest waiting for a proper breakout before going long here, as once we see a breakout, we might be seeing very good upward movement toward $3000.
Swallow Academy

$ETH Long Setup Loading📈 CRYPTOCAP:ETH Long Setup Loading 📈
#ETH swept liquidity and printed a CISD just below the 4H FVG 🎯
That level lines up with a POC + demand zone — prime spot to hunt a new long 🔍
Let it come to you, plan the entry 💼

$ETH Pressing Resistance – A Break Above Could Fly!CRYPTOCAP:ETH Update
Ethereum is looking strong right now.
The price is pushing against a key resistance zone near $2,725 and forming higher lows showing pressure is building for a breakout.
If it breaks above this zone clearly, ETH could rally toward $4,000 (that’s a 55% upside).
Support to watch on the downside is around $2,465 if price pulls back.
Keep an eye on ETH, this breakout could be big.
DYOR, NFA
#ETH #Ethereum

Next days eth?I think we are still in the compresion, Eth is nog waiting on btc but is making is own path
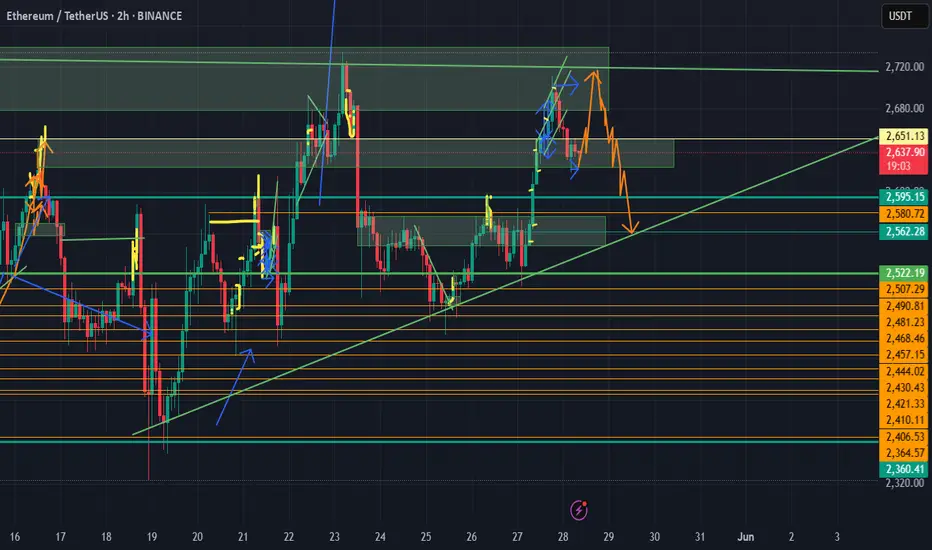
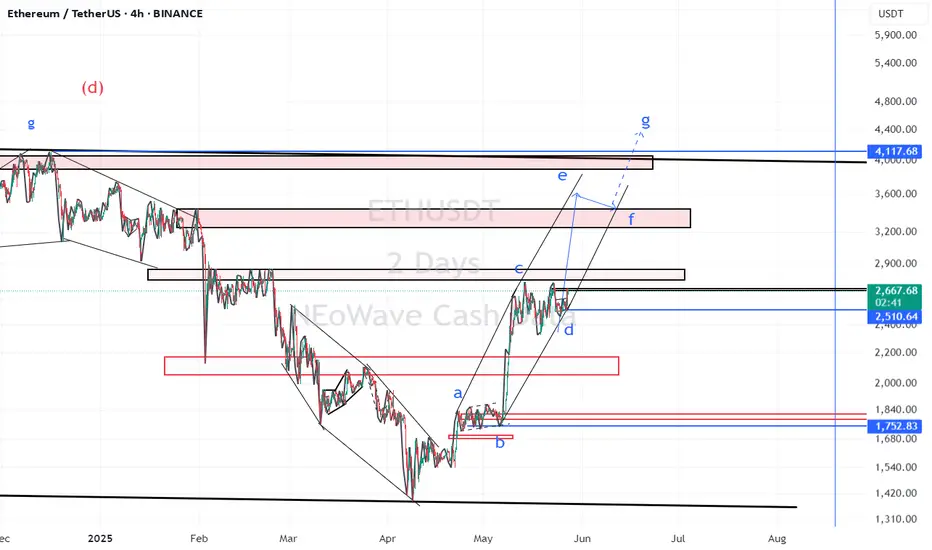
ETH/USDT – Structural Pattern Near Completion (4H)The current 4H chart of Ethereum is unfolding a 7-legged sideways corrective structure, with signs suggesting we are now in or entering the final leg of the pattern.
🔸 Wave Progression (Post-X Correction):
A → Initial push upward
B → Sharp pullback
C → Extended leg with strong momentum
D → Symmetrical pullback, 80% of B
E → Sharp upside move
F → Pulled back to D-level support
G → Potential final leg now developing
📌 Pattern Characteristics:
7-wave alternation forming within contracting boundaries
Price symmetry observed in B = F and A ≈ C ≈ E
Visual structure remains neutral and balanced
Each leg alternating in direction and behavior
📈 Expectations:
G is likely to be an upward wave, completing the structure
Target range for G: 2,660–2,700, possibly testing or briefly exceeding E
After G completes, a reversal or acceleration move is likely
🧭 What to Watch:
Reaction near upper boundary around 2,700
Any sharp rejection from that zone confirms the pattern is complete
Break of the D–F trendline post-G confirms structure termination
📊 Timeframe: 4H
Asset: ETH/USDT
Structure: Complex 7-leg correction
Outlook: Bullish short-term → Cautious after G
💬 Drop your thoughts below. Are we completing the final leg or mid-structure?
📍 Like and follow for more professional pattern analysis.
BINANCE:ETHUSDT BITSTAMP:ETHUSD BINANCE:ETHUSDT.P

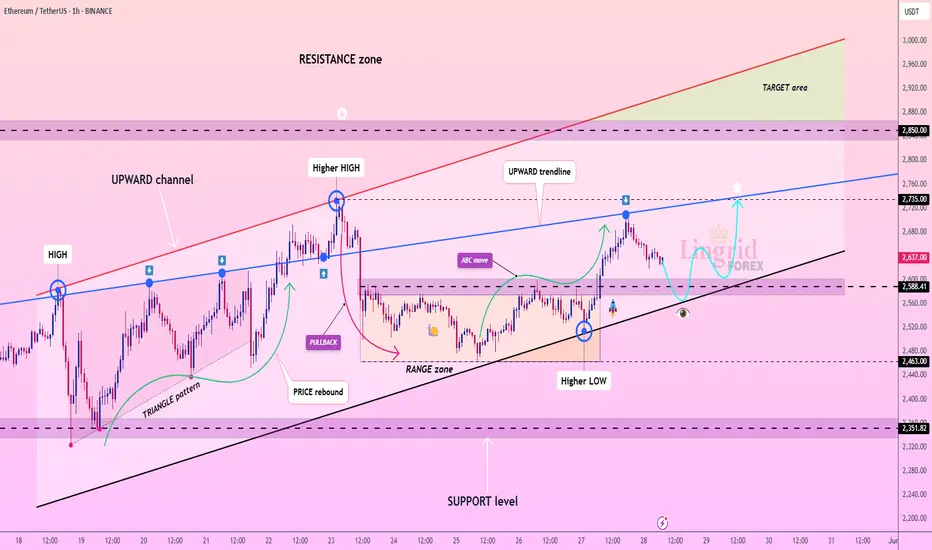
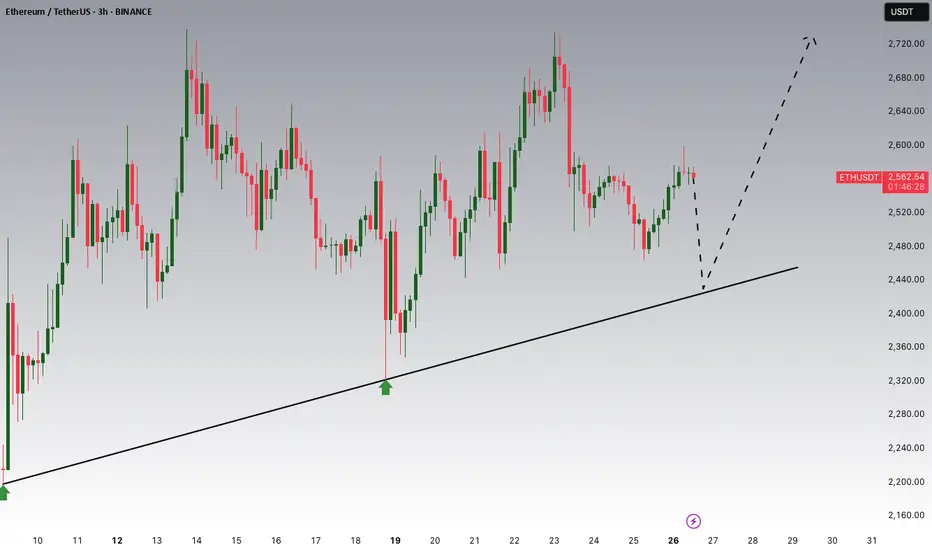
Lingrid | ETHUSDT potential Bullish Breakout ExtensionThe price perfectly fulfilled my last idea . BINANCE:ETHUSDT is pulling back from its recent high after tagging the blue trendline near 2735. Price is now approaching the 2588–2590 support confluence where the range low and the ascending channel intersect. A bounce from this zone would maintain the bullish structure and may trigger a new leg toward 2735 and higher. Trend continuation remains favored above the support trendline.
📈 Key Levels
Buy zone: 2588 – 2590
Buy trigger: bullish bounce with strong volume
Target: 2735
Sell trigger: break and close below 2580
💡 Risks
Break below 2588 could shift bias short
Resistance around 2735 may cause another rejection
Short-term volatility may increase before a clear breakout
Traders, if you liked this idea or if you have your own opinion about it, write in the comments. I will be glad 👩💻
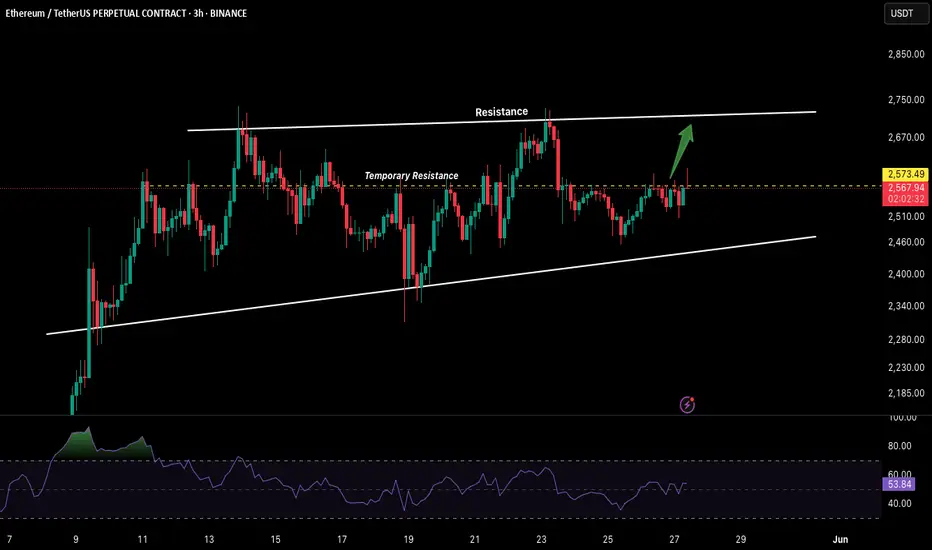
ETH in a 4-hour Timeframe!ETH, on the lower timeframe, is likely to hit the $2,700 mark. The price is steadily moving upward, with the RSI gaining momentum. It will be interesting to see if ETH breaks above the $2,700 resistance.
Strategy:
~ Long: $2500 to CMP.
~ DCA: $2450.
~ Leverage: 5x-10x.
~ Target: $2700+.
~ Stoploss: If ETH closes below the support line then we will close this position.
Note: DYOR before investing.
ETH/USDT At A Premium — What’s Next? Smart Entry Strategy!I'm currently analyzing ETH/USDT 🧠💹 — Ethereum has been in a strong bullish trend, recently pushing into all-time highs 🚀🔝. While the momentum remains intact, price is now trading at a premium 🏷️, and I’m cautious about entering long at these elevated levels ⚠️.
In the video, we break down the trend, market structure, and price action with precision 📊🧱. I also explore potential entry scenarios that align with low-risk, high-probability setups 🎯🔍 — ideal for those waiting for the right moment to engage without chasing the move.
You'll also get a deep dive into my Trend Continuation Strategy 🔄📈 — a powerful framework for identifying smart entries in trending markets.
🛑 This is not financial advice

ETH Long TradeLooks bullish here for continuation
Futures are higher on holiday
Order flow neutral to bullish
ETH local early double top formation - 25th of May, 2025.(c) First things first.
First Top: Around $2,860 on May 6.
Second Top: Around $2,830–2,850, recently.
Neckline is near marked by horizontal 0.5 Fibonacci level — current setup is very clean. I would say even too clean to be truth.
Price has pulled back after the second peak and is hovering near the neckline. No breakdown yet, but we are close to that.
_________________________________________
📉 Trade Setup (If Double Top Confirms)
1. Entry:
→ Short below the neckline , approx. @ $2 430 with confirmation (candle should close below this level).
2. Stop Loss (SL):**
→ Should be above second top, around $2 860.
→ High risk SL: Above recent candle high ~$2 620.
3. Take Profit (TP):**
→ We get it from height measure:
Top was at $2 850, neckline at $2 430 = ~$400 range
→ TP1: $2 430 − $420 = $2 010
→ TP2: Optional — 0.618 Fib zone near $1 860
_________________________________________
🔁 Retest Setup (If Break + Retest Happens)
If price breaks below the neckline and then comes back up to retest ~$2 430 as resistance, we are looking to:
1) Weak bullish candle or bearish engulfing on retest
2) Lower volume on retest
3) Enter short there with a tighter SL above retest wick.
⚠️ !! WARNING !!
DOUBLE TOP IS Not yet confirmed – price needs to break neckline and re-test it.
We are already in BULL's market, therefore FOLLOW THE GLOBAL TREND.
We are expecting volatility today because of Powells speech, thereofre this setup can be a TRAP, especially, If price closes back above ~$2 600 with strength — pattern is invalidated.
If you trade against the trend you should be ready for consequences. Good luck!

ETH- Etherium - Are we getting ready to Short?1. Resistance Level - Triple top (1st one not visible)
2. Abnormal SI at the top 17.8
3. Waiting for a Plutus Short Signal to Enter
Enjoy!

Ethereum Is Nearing an Important SupportHey Traders, in today's trading session we are monitoring ETH/USDT for a buying opportunity around 2,435 zone, Ethereum is trading in an uptrend and currently is in a correction phase in which it is approaching the trend at 2,435 support and resistance area.
Trade safe, Joe.
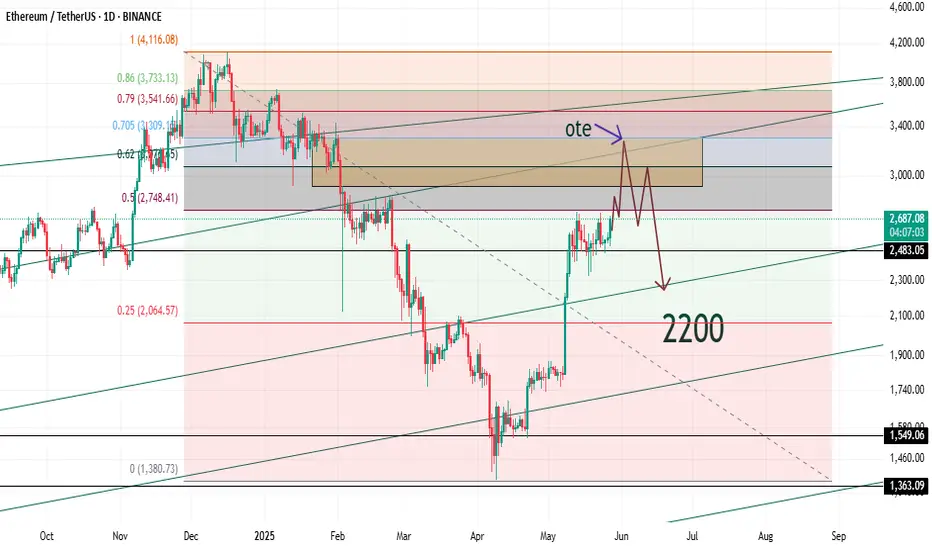
"Trap Ahead : Liquidity has a Price"Everyone’s screaming “bull market!” again…
Yeah, until the market humbles them—like always.
Let me walk you through what’s actually happening:
ETH is headed for a flashy detour to $3,300
—everyone’s gonna feel rich for a second.
Then?
Down she goes. Straight below $2,300.
Trust me, euphoria has a price.
Meanwhile, BTC is dressing up for above $113,500.
But don’t fall in love with the pump—it’s not here to stay.
That move? Just enough to get everyone trapped.
Next stop: sub-$93K.
Yup, the wolf said it.
This market doesn’t care about your hopes.
It rewards the patient, and devours the emotional.
Liquidity is the meal. You’re either the hunter… or the feast.
Follow Alpha Sigma Wolf
If you’re tired of hopium and want clarity instead.
Because I don’t do “maybe.”
I do moves.
Let the sheep cheer. We’ll be waiting.
#SMC #SmartMoney #CryptoAnalysis #ETH #BTC #AlphaSigmaWolf
Is ETH showing signs of bullish continuation?Ethereum (ETH) may be facing a range breakout, which could trigger the next leg up.

CHECK ETHUSD SIGNAL READ CAPTAIN(ethusd ) sell zone
( TRADE SATUP)
ENTRY POINT (2695) to (2700) 📊
FIRST TP (2675)
2ND TARGET (2645) 📊
LAST TARGET (2615) 📊
STOP LOOS (2730)❌

ETH(based on NEowave)I changed my analysis and I think Its better to consider eth in the middle of the running diamond diametrical.
stop loss of this analysis is 2400$.
ETH ANALYSIS🔴 #ETH Analysis : ❓❓
🔮There is a formation of "Bullish Pennant Pattern" in #ETH in 4HR time frame. We can expect around $2800 bullish move if the price break the pattern.📈
⚡️What to do ?
👀Keep an eye on #ETH price action. We can trade according to the chart and make some profits. ⚡️⚡️
#ETH #Cryptocurrency #Breakout #DYOR

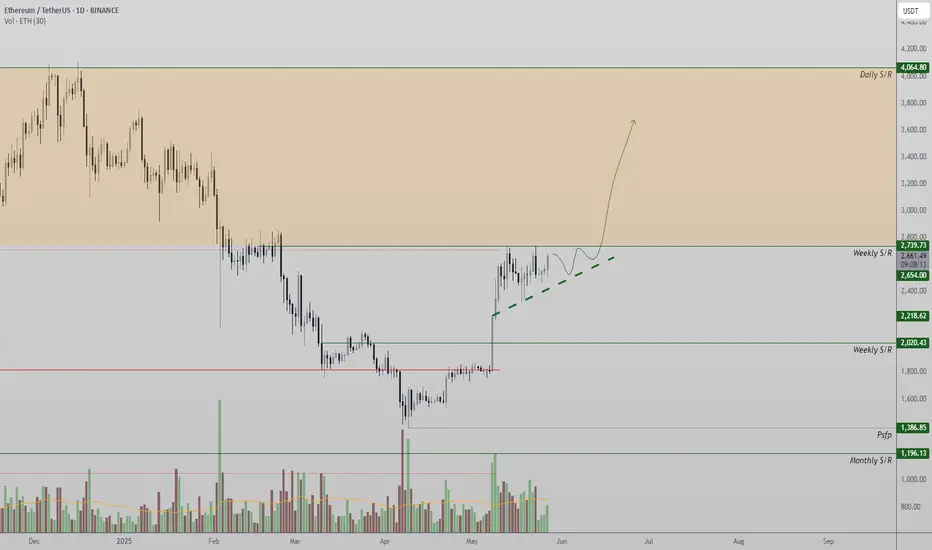
Ethereum Coiling Beneath Resistance — $4,000 Breakout?Ethereum’s price action is tightening beneath a key resistance level. With higher lows forming and market structure remaining bullish, ETH looks poised for a breakout that could send it toward $4,000.
Ethereum is currently trading in a consolidation phase just under a major resistance level at $2,700. This sideways price action may seem indecisive on the surface, but technically it’s forming a bullish continuation pattern. The structure shows consecutive higher lows compressing into a triangle beneath resistance—commonly seen before explosive moves.
This type of consolidation under resistance is typically interpreted as strength. Rather than breaking down or losing momentum, Ethereum is holding its ground and slowly building pressure. Each dip is being bought up sooner than the last, reflecting growing bullish interest and a reluctance among sellers to push price lower. From a market structure standpoint, ETH is still putting in higher highs and higher lows, indicating that the uptrend remains intact.
Key Technical Points
$2,700 Key Resistance: ETH is coiling just beneath this critical horizontal level, which has acted as a cap in recent weeks.
Ascending Triangle Formation: A bullish pattern marked by higher lows pushing price into overhead resistance, signaling potential breakout momentum.
Strong Market Structure: Higher highs and higher lows remain intact, supporting the current bullish bias.
If Ethereum breaks above $2,700 with a convincing bullish candle and volume influx, it could trigger an aggressive move upward. The next major level to watch is the $4,000 psychological mark, which stands as a natural magnet and round-number resistance. The impulsiveness of the breakout will be key—clean, high-volume price action above $2,700 could accelerate Ethereum into price discovery mode for 2025 highs.
Until that breakout occurs, ETH is still in a holding pattern. However, the bullish consolidation, pattern structure, and absence of lower lows suggest that any downside risk remains limited as long as ETH trades above its short-term trendline.
As long as Ethereum holds above its ascending trendline and continues printing higher lows, the bias remains bullish. A breakout above $2,700 could trigger a fast move toward $4,000. Traders should monitor volume closely and prepare for a possible expansion phase if resistance is breached.