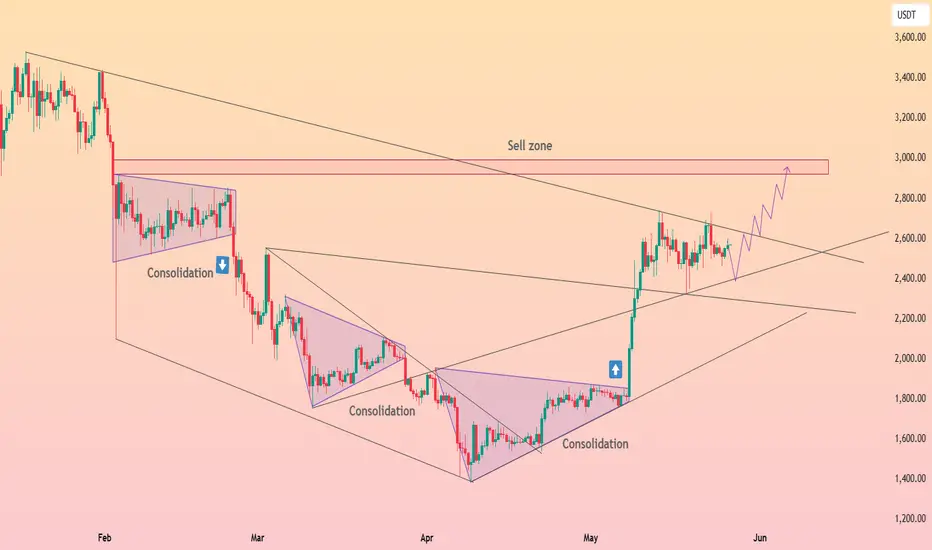
HolderStat┆ETHUSD wedge-breaker momentum runCRYPTOCAP:ETH — Monster breakout from a year-long falling wedge rocketed into a rising pennant; 2.55 k acts as dynamic trendline support. As long as bulls defend that level, upside extension toward the 2.95-3.1 k sell zone resistance looks probable. Lost support opens a dip to 2.25 k structural shelf before buyers regroup.
ETHUSDT.3S trade ideas
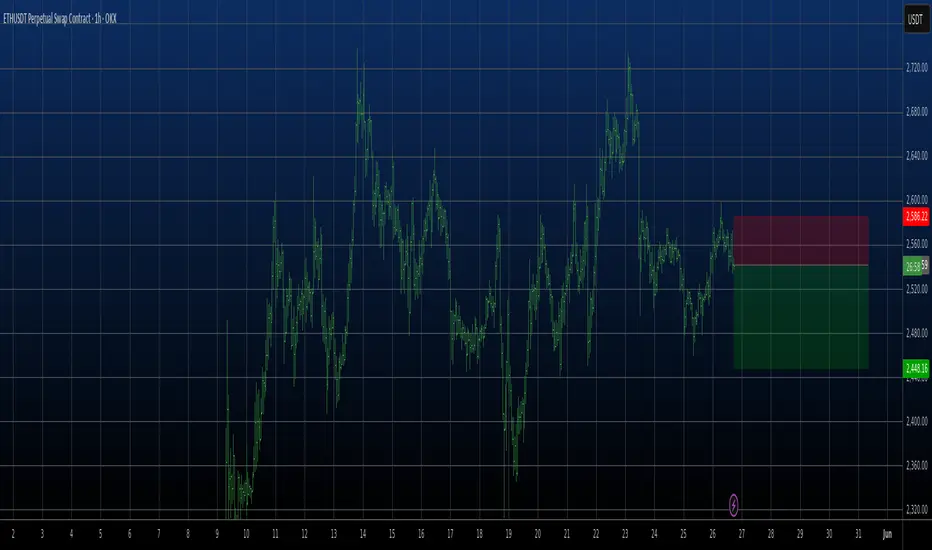
Good moment to try to Sell ETHGood moment to try to Sell ETHUSDT. We are in the flat channel and now around local up level of this channel. I think we should move to down and touch the low level and maybe create a local small down trend channel. Will see...
DeGRAM | ETHUSD kept the support📊 Technical Analysis
● ETH retested the old wedge roof (~2 450) and the new rising‑trendline in one touch, confirming them as support and printing a higher low.
● Price is climbing inside a fresh ascending channel; a mini bull‑flag above 2 600 targets the next horizontal resistance/supply at 2 886‑3 083.
💡 Fundamental Analysis
● CME Ether futures open‑interest topped $1.6 B while US spot‑ETH ETFs saw net inflows this week, signalling broader institutional accumulation as softer US CPI dents real yields.
✨ Summary
Confluent support at 2 450‑2 600 plus record futures/ETF demand back a tactical long: objectives 2 886 → 3 083; manage risk on a 16 h close below 2 450.
-------------------
Share your opinion in the comments and support the idea with like. Thanks for your support!

ETH Continues Bullish Momentum Above Broken TrendlineHello guys!
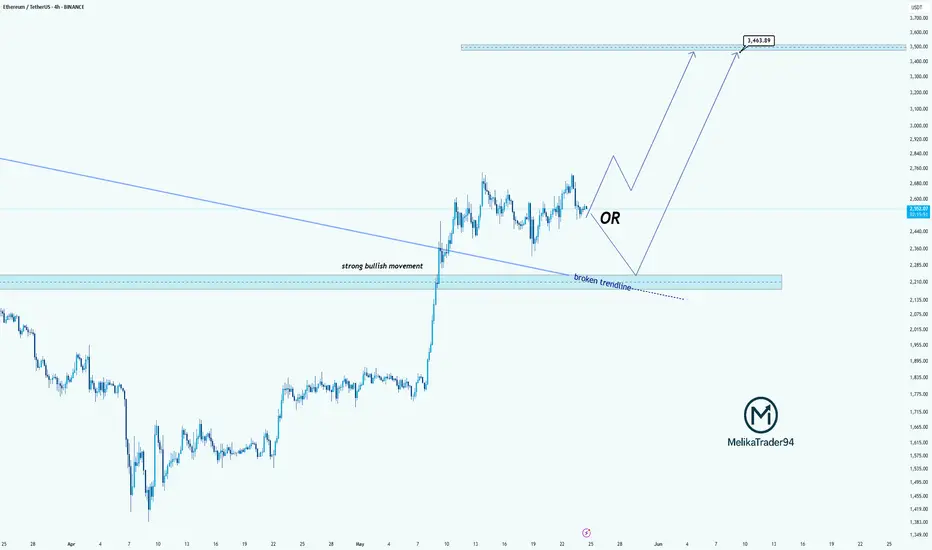
Ethereum has shown a strong bullish rally, breaking through a long-standing descending trendline with significant momentum. Currently, price action is consolidating above the broken trendline, which may now act as a support zone.
🔹 Scenario 1 (Bullish Continuation): If ETH holds above the current range and confirms the broken trendline as support, we could see a continuation toward higher resistance levels around $3,500 and beyond.
🔹 Scenario 2 (Deeper Retest): Alternatively, a pullback toward the $2,200–$2,300 area (highlighted zone) could offer a better accumulation point before the next bullish leg resumes.
This setup suggests that as long as ETH remains above the key support levels, the bullish structure remains intact.
Ethereum (ETH): Buyers Going For Breakout | Eyes Wide OpenEthereum is heading towards the local high area, where we are expecting to see a breakout from. As soon as we see the price reach local high we will be expecting some sort of resistance from sellers but if we keep similar momentum then upon seeing breakout we will be looking for a long.
Swallow Academy

Bullisch on ETHWait for the breakout of the bullish pennant and then we can play 2 scenarios, either we overshoot or we make a retest see for yourself what the conformations are at the moment of a breakout. Good luck everyone. tradingview.sweetlogin.com
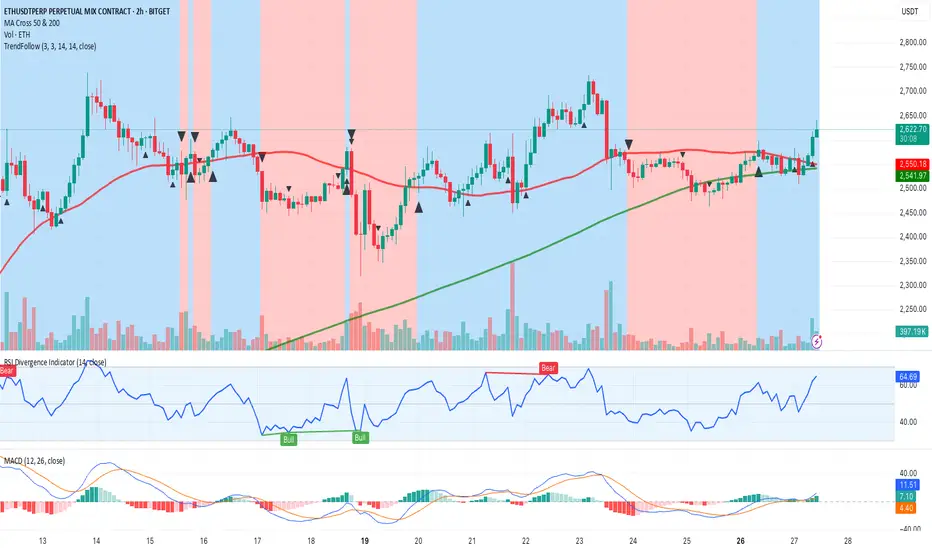
Asset: ETHUSDT (Ethereum Perpetual on Bitget)
1. Main Trend:
Price is breaking upwards after a sideways phase.
The 200-period moving average (green) is holding as long-term support, while the 50-period (red) has just been crossed decisively to the upside, confirming a potential bullish reversal in the short/medium term.
2. Key Levels:
Main support: 2,550 USDT (at 50 MA, just broken to the upside).
Immediate resistance: 2,660–2,700 USDT (previous high). A breakout above this range would confirm a trend continuation.
Breakout: The move is confirmed by increasing volume on the latest green candle.
3. Technical Indicators:
RSI: Currently at 65.82, close to overbought (70), but still has room to rise. No bearish divergences.
MACD: MACD line is above the signal line, and the histogram is increasing—bullish signal.
Volume: Rising during the breakout, indicating genuine participation.
4. Risk/Opportunity — Suggested Trading Signal:
Direction: Long (bullish)
Entry: 2,630 USDT (current price or slight retracement to 2,600–2,615 USDT)
Stop-loss: 2,545 USDT (below the 50 MA and last support, to avoid false breakouts)
Take profit 1: 2,700 USDT (first key resistance)
Take profit 2: 2,780 USDT (previous highs on the chart)
Confidence: Medium–High
Both the technical breakout and confirmation from the main indicators support the signal. Watch for RSI approaching overbought.
Additional notes:
Basic pattern: Bullish breakout from sideways consolidation.
No bearish short-term formation.
Macro factors: Monitor crypto market volatility; risk of retracement if traditional markets weaken.
Summary (required format):
Asset: ETHUSDT
Direction: Long
Entry: 2,630 USDT (or minor pullback to 2,615 USDT)
Stop-loss: 2,545 USDT
Take-profit: 2,700 USDT (TP1), 2,780 USDT (TP2)
Confidence: Medium–High
Additional notes: Breakout confirmed by high volume, bullish MACD, watch for short-term RSI overbought. For a more conservative strategy, wait for a confirmation above 2,660 USDT before entering.
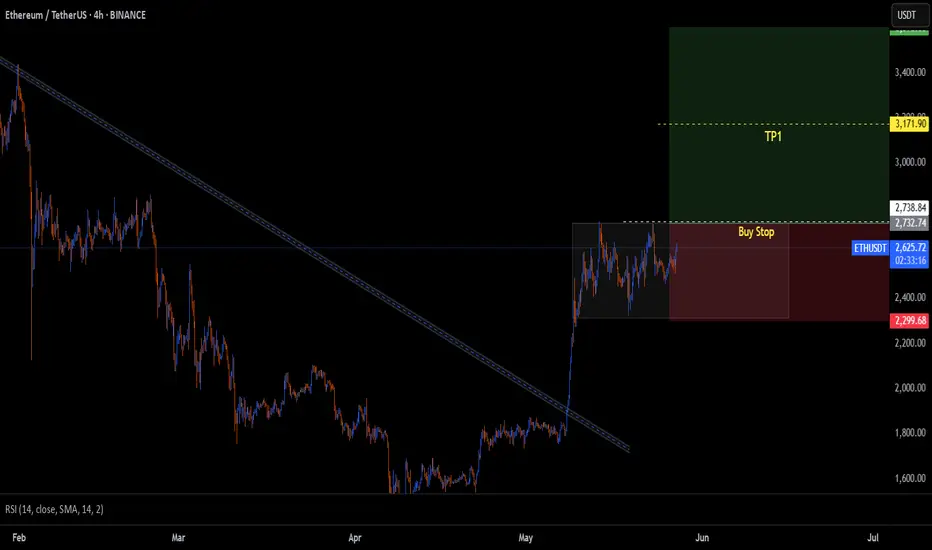
ETHUSDTHigher Highs (HH) & Higher Lows (HL): The pattern of higher highs and higher lows is an indication of an uptrend, showing that the buying momentum is strong.
Entry: Place a buy stop order just above the recent higher high (HH). This allows you to enter the trade if the price continues moving upward, confirming the bullish momentum.
ETH/USDT – Symmetrical Diametric in Progress (4H Analysis) Here’s a TradingView post designed for your ETH/USDT 4H chart analysis using NeoWave – Symmetrical Diametric structure:
---
A rare and clean Symmetrical Diametric seems to be unfolding on the 4H ETH/USDT chart, following Glenn Neely’s advanced NeoWave principles.
Current Structure:
Waves A, B, C, D, and E have completed
All legs are nearly equal in time with clear directional alternation
Wave E retraced exactly 61.8% of Wave D, confirming symmetry
What's Next?
Wave F is likely starting now — expect an upward move
If correct, Higher High (HH) will be formed above Wave E
After that, Wave G will complete the 7-legged diametric with a Higher Low (HL) structure
Key Observations:
Time symmetry = strong confirmation for a Symmetrical Diametric
Current range: $2,500–2,610
Break above $2,590 will reinforce bullish Wave F development
Trading Outlook:
Watch for bullish confirmation near $2,540–2,550 zone
Wave F may target the $2,590–2,610 resistance zone
Final Wave G could offer a buy-the-dip opportunity if it respects symmetry
Pattern: Symmetrical Diametric
Current Wave: Likely beginning of Wave F
Bias: Short-term bullish, mid-term neutral (until Wave G ends)
DYOR – This is not financial advice.
Share your thoughts below — Do you also see the Diametric?
BINANCE:ETHUSDT BINANCE:BTCUSDT BINANCE:ETHUSDT.P BINANCE:ETHBTC BYBIT:ETHUSDT.P

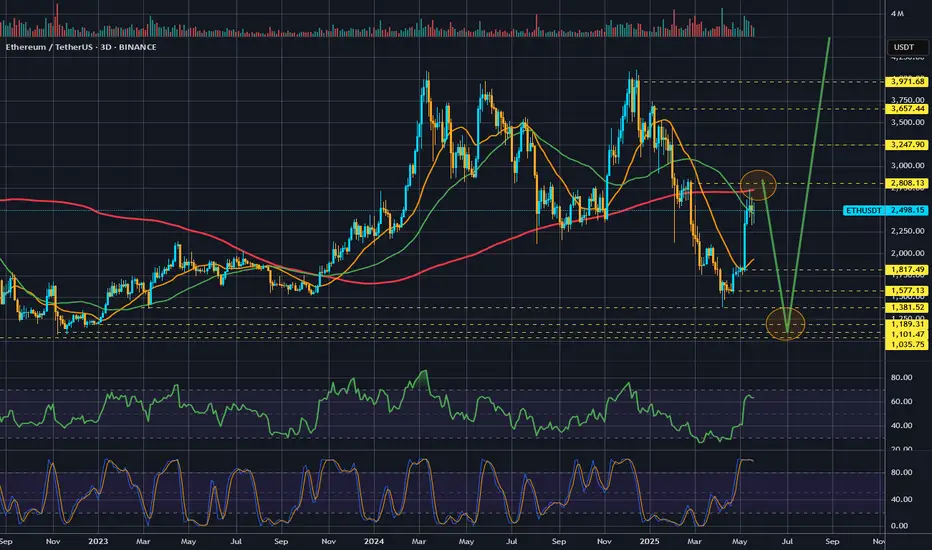
Short term next target for ETH - 1100$; Market crash in JuneEthereum will be reaching 2808$ in coming days before month May is closed.
ETH almost reached main liquidity zone for this rally and also 200MA. As soon this level is done - expect another market crash in June.
Next crash will be super fast and most of altcoins will drop even lower.
Target for ETH in month of June is between 1100$ and 1300$.
After this crash we will see altcoin season and ETH will lead it.
We are entering last phase of a bull run. There are about 3 months left before we enter a bear market officially.
Here is previous idea from 1300$ to 2808$
Ethereum flagging out gives us a setup with good RRETH is forming a nice structure that looks like a nice flag on higher timeframes. Structures allow you to create setups that include valid risk management. There is a clear volume gap below that can present some weakness.
Full TA: Link in the BIO

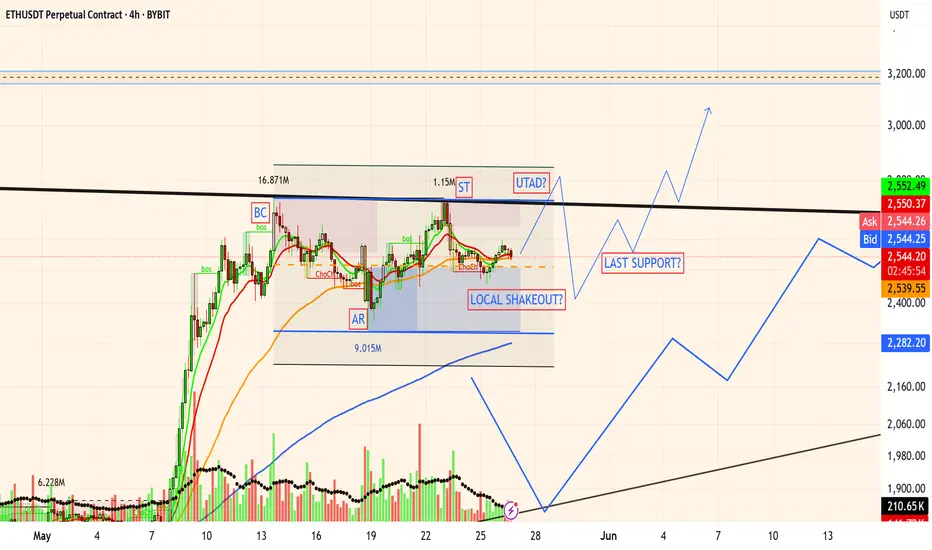
Ethereum 4H - Wyckoff?It is always very difficult to understand the dynamics with fragmented volumes, where peaks almost always coincide with an abrupt move.
This is Ethereum on 4H, a position I am following, although I prefer larger timeframes.
I am not currently trading, but rather holding pending better times.
Remember to be careful, these are delicate and dangerous times, especially for those who are not so experienced.
You can copy the setup and follow it by yourself.
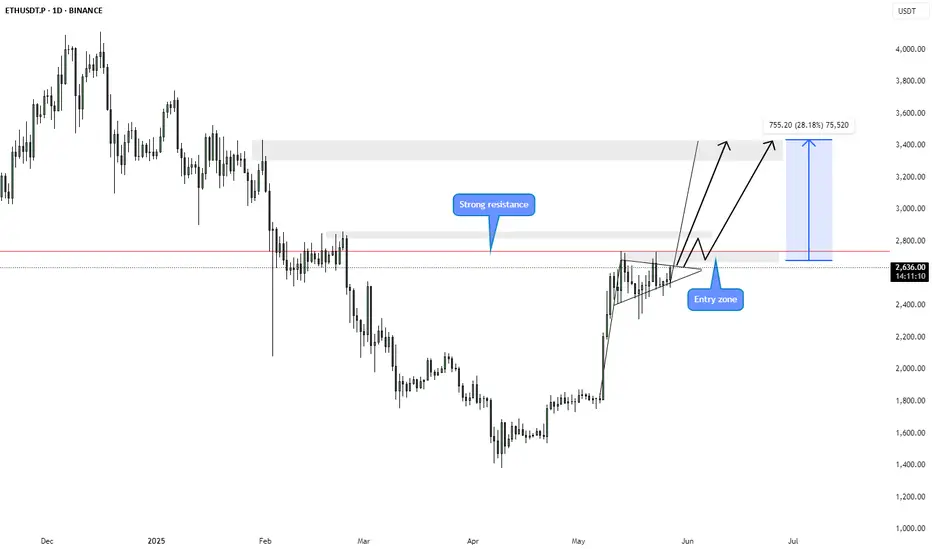
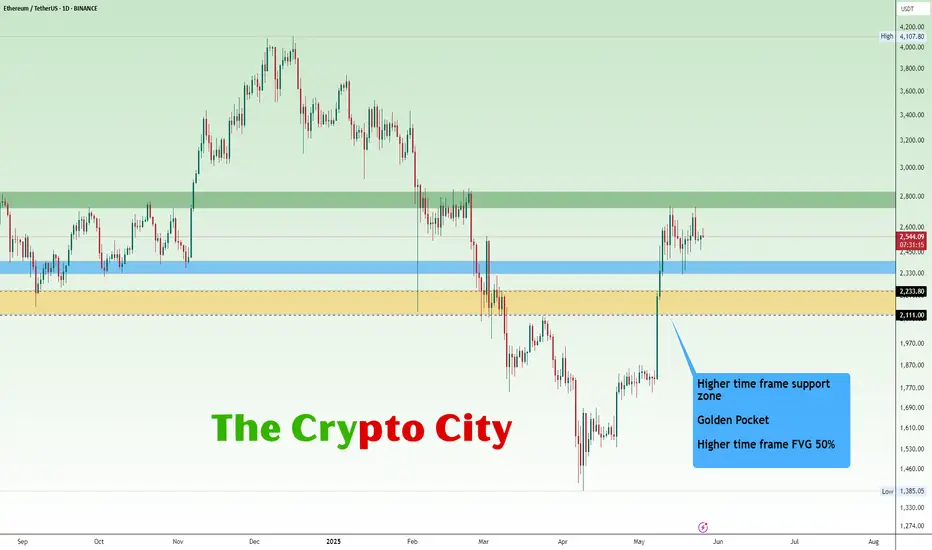
ETH USDTEthereum’s $2,328–$2,400 blue support zone was an excellent buy range. If the price breaks below this zone, the last opportunity to buy may be at the yellow support zone.
In the coming weeks, if Ethereum breaks above the green resistance zone at $2,727–$2,833, we could see new highs. I believe this breakout would signal the beginning of a new bull run.
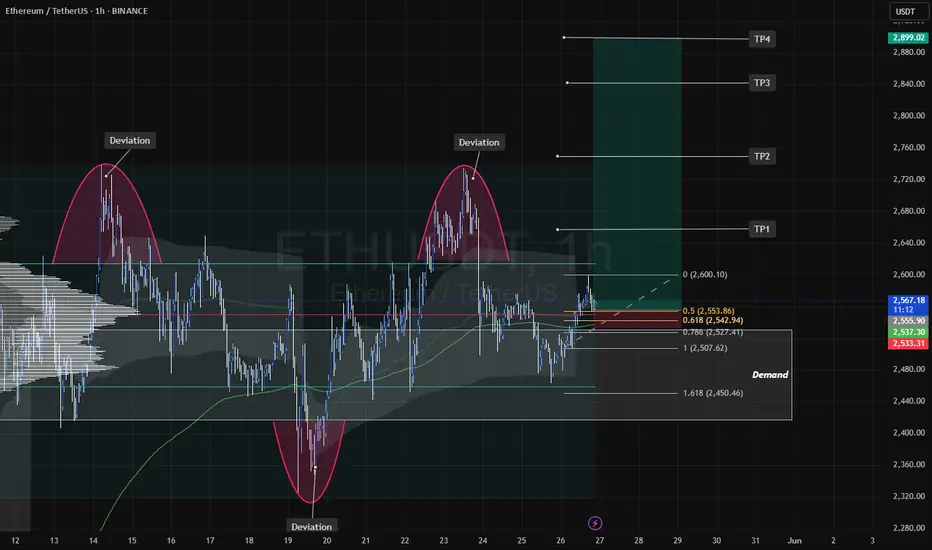
Strategic Rebound from Fibonacci 50%-61.8% Within Bullish ChanlThis trade is based on a confirmed bullish structure following a Break of Structure (BOS) and multiple Change of Character (CHoCH) signals, indicating a potential trend reversal. Price is currently trading within a rising channel, pulling back into the key Fibonacci 50%-61.8% retracement zone (2,551 – 2,539 USDT).
This area aligns with a possible institutional order block, increasing the likelihood of a bullish reaction. The trade targets a move back toward the local high around 2,598 USDT, with potential extension to the liquidity zone near 2,670 USDT. A protective stop-loss is placed below structure at 2,527 USDT, ensuring a favorable risk-to-reward ratio.

Ethereum Breaks Above MA200, Long-Term Bullish Cycle ConfirmedThe 5-May week marked not only a major advance and recovery above the August/September 2024 low prices, but it also signals a recovery for Ethereum above MA200 long-term, weekly timeframe.
This simple signal confirms that the bulls are in. But there is more.
After breaking above this level, Ethereum closed two additional weeks green above it, both times wicking lower but recovering. So this level has been conquered, retested and continues to hold. This means that we have at least 6 months of bullish action confirmed based on the chart, technical analysis.
There are also some great signals based on the long-term.
» RSI: The weekly RSI has a strong reading (bullish) and produced a major higher low compared to June 2022. This signal matches what happened at the end of the previous bearish cycle.
» MACD: The weekly MACD also produced a long-term higher low compared to July 2022 coupled with a bullish cross. This indicator is trending full-upwards and leaves no room for doubt. Ethereum is set to grow long-term. Let me show you the MACD...
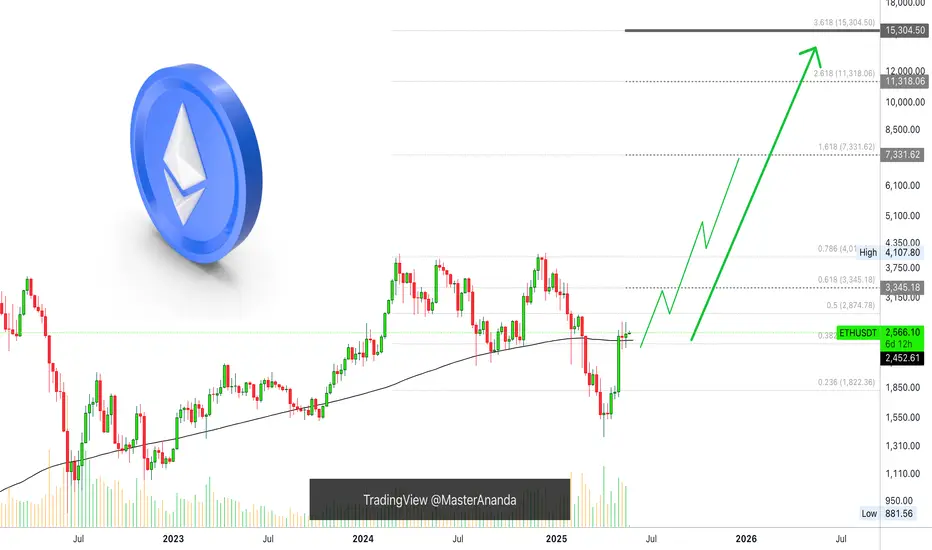
What would you do if you knew, with a high level of certainty, that Ethereum will trade at $7,000 or higher this same year? How would you take action? How best to profit from this knowledge/information?
Namaste.
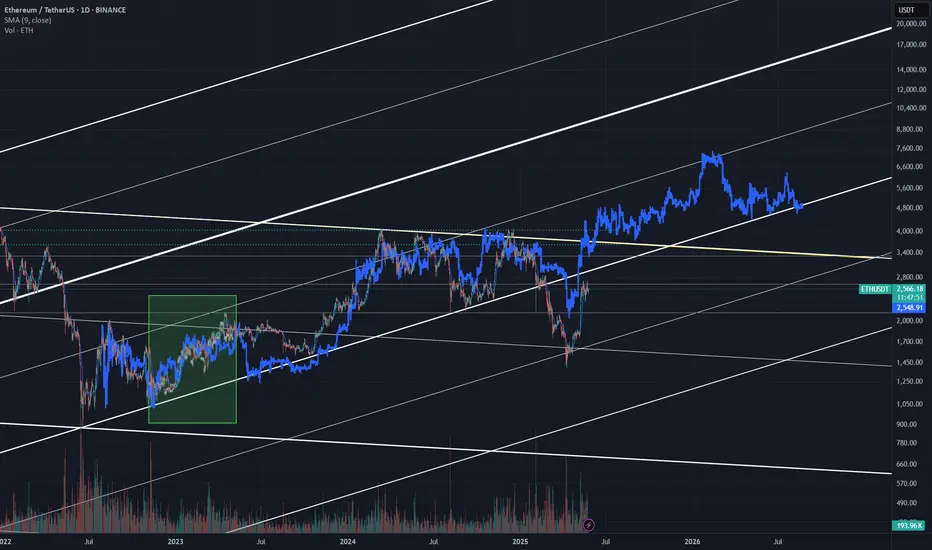
Eth bull market movement, potential ATM in few monthsEth bull market movement, potential ATM in few month based on previous pattern
Ethereum (ETH): Buyers Secured EMAs, Possible Breakout IncomingEthereum has recently secured the branch of EMAs, and now that we see the dominance that buyers have shown multiple we are expecting to see a break of the local highs area, which would then send the price to $3,000 and then $4,000.
As of now it is a little early to tell about the certainty of that movement, so we have to wait for Monday to pass, as Mondays are tricky days and can sometimes just be a fakeout movement.
Swallow Academy

Ethereum (ETH): Buyers Secured The EMAs, Another Push Incoming!Ethereum has recently secured the branch of EMAs, where now it seems that buyers are going for the break of structure, which then would result in a movement towards our other target zones.
So with that being said, our game plan has not changed; we are looking for further movement to upper zones, and so far we are in good profits (thanks to the entry that we caught on lower zones).
Swallow Academy

ETH-USDTUpdate: Expanding Diametric Reaching Final StageEthereum is unfolding a textbook 7-legged Expanding Diametric on the 3H chart — one of the cleanest emotional and structural patterns in corrective formations per Glenn Neely’s NeoWave theory.
Here’s the breakdown so far:
🔷 Wave A: Initiated with strong emotion — longest leg so far
🔷 Wave B: Quick contraction
🔷 Wave C: Moderate bounce — smaller than A, larger than B
🔷 Wave D: Contracting correction, smaller than B
🔷 Wave E: Sharp upward push, but still less than A
🔷 Wave F: Deep and emotional drop — aligns with the rhythm
Now we are preparing for the final Wave G, which must:
🔹 Expand beyond Wave E (and possibly near A)
🔹 Remain corrective, not impulsive
🔹 Appear emotional — many mistake G for the start of a new trend
🔹 Likely hit the 2737–2742 USDT zone
🔹 Possibly begin after one last minor drop (trap) to maintain deception and rhythm
⚠️ If Wave G forms as expected, this pattern completes a full Expanding Diametric, meaning the next significant structure afterward may be either a complex correction or a trend resumption.
📌 Keep an eye on short-term rejections, but the larger wave psychology points toward one final emotional spike before pattern conclusion.
BINANCE:ETHUSDT BINANCE:BTCUSDT COINBASE:ETHUSD INDEX:BTCUSD BYBIT:BTCUSDT.P

ETH mignt be preparing for the breakoutETHUSD is aligning with the overall cryptocurrency trend, led by Bitcoin. Compared with the latter, ETH has an MVRV indicator positioned at approximately 1.3, which makes the trend for ETH a relatively young trend, thus having a potential for continuation.
Bitcoin is positioned at peak, which makes it relatively difficult for traders to join: stop-loss should be wider, and the extended liquidation risk still can easily wipe traders out of positions with the regular volatility.
With ETHUSD, the situation might be more interesting as it’s located in the trading range, and the potential move up may be more aggressive and straightforward, if and when it will break the current resistance of area of $2600.
Don't forget - this is just the idea, always do your own research and never forget to manage your risk!

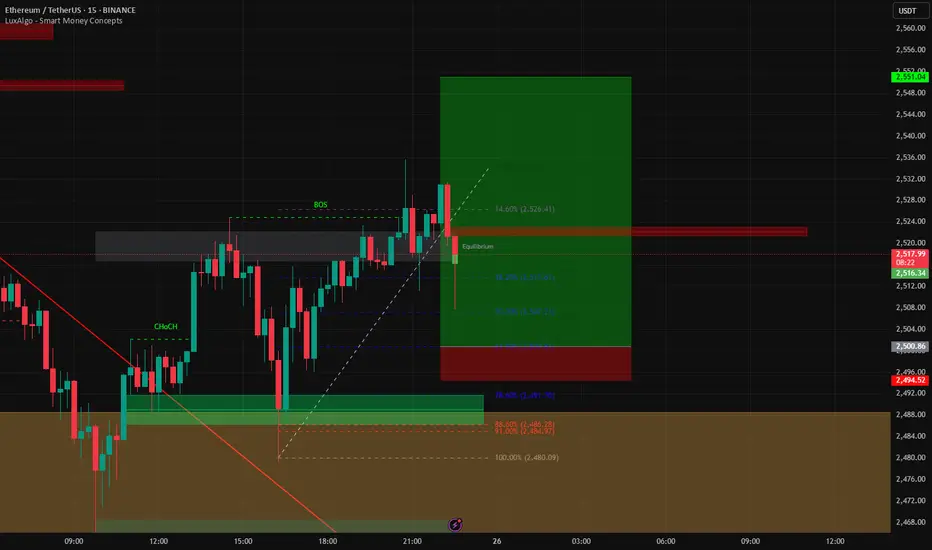
ETH/USDT – Rejection from Equilibrium Zone After BOS, Bullish I'm watching a bullish setup on ETH/USDT (15-minute chart) based on Smart Money Concepts.
After a confirmed Change of Character (ChoCH) and a Break of Structure (BOS) to the upside, price retraced into the equilibrium zone and tapped a key support level near 2500 USDT — a psychologically and technically significant level. This area also aligns with the 50%-61.8% Fibonacci retracement and sits just below a bullish Order Block.
I’m positioning a Buy Limit at 2500 USDT, anticipating a continuation move back toward recent highs.
Entry: 2500 USDT
Stop Loss: 2,480 USDT (below previous low)
Take Profit: 2,534 USDT (recent swing high)
Risk: 20 USDT
Reward: 34 USDT
Risk:Reward Ratio ≈ 1:1.7
The wick into the zone suggests a liquidity sweep and potential bullish reversal. A strong bullish candle or a new BOS would confirm the continuation bias.
ETH next move (maybe)The price has tapped into a Fair Value Gap and the price respected the trendline which maybe indicates a reversal
