ETH cheaper than $1,500 already this SUMMER? Hi! While many are already predicting an alt-season and hundreds of X's, let's see if it's really so? 🤔
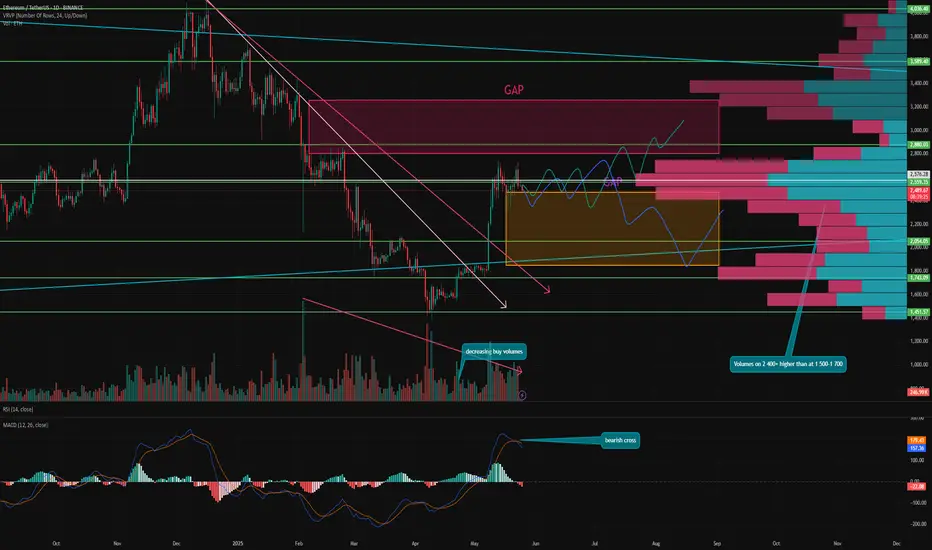
While bitcoin is updating ATH day by day. ETH is still trading almost 40% cheaper than its peak in this cycle . And on the low time frame it is already forming a double top pattern, signaling a downside risk in the near future.
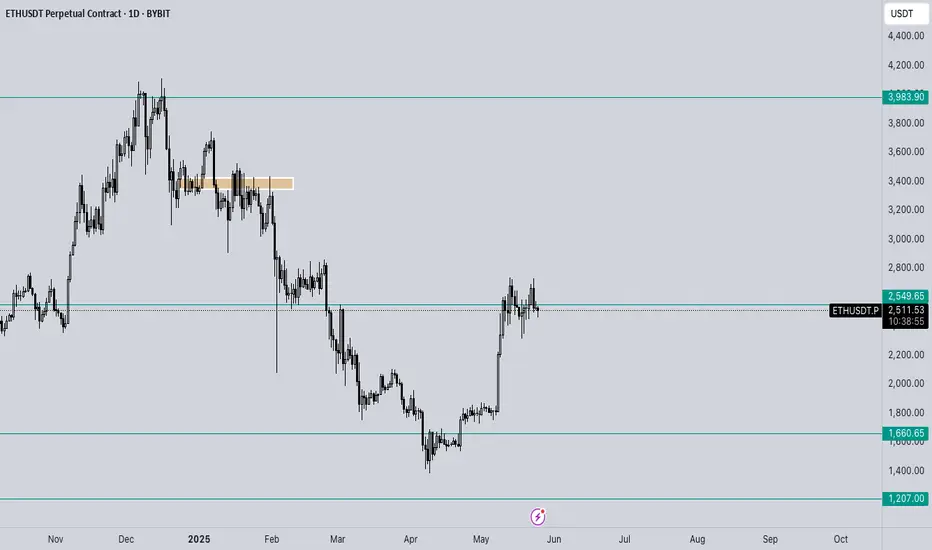
With the current growth we have closed a small GAP at the level of 2,250 - 2,650. But there is still a GAP above us in the zone of 2,800 - 3,250. In addition, below us there is now a GAP formed in the range of 1,850 - 2,450. And as we know, 99% of GAPs tend to close sooner or later.
❓ But here's the question - which one will close sooner? Let's get to the bottom of it!
⚙️ Indicators and metrics:
MACD - has already given a bearish section, signaling a potential trend change.
Volume - since February 3, all further declines, the volume of ETH purchases has only declined, signaling a decline in interest in the asset. Even at 1400 and below, buying volumes were still disastrously low . Showing the lack of interest in the asset even at such prices.
VRVP - shows buying and selling volumes at price levels in relation to each other. It is noticeable that at the levels of 2,400 - 2,750 the trading volumes increase significantly , and in both directions. Showing that this level is still a strong resistance , and the mood in ETH is extremely speculative and few people are interested in it at 1,400, but at 2,500 it is good choice! 😁
📌 Conclusion:
In my opinion, this was a purely technical rebound for ETH after a long decline . As well as for the altcoin market as a whole. Those altcoins that were simply declining more rapidly than others are the ones that are growing fastest now.
Besides, I remind you that summer is coming soon and there will be less liquidity on the market. So unless the current market conditions push ETH to 3,000 and above . We can definitely not expect it in summer and the most probable scenario in my opinion is blue. I don't think we will see ETH at 1,500 and below (unless Trump does something weird), but it is possible to close GAP and go to 1,800.
ETHUSDT.3S trade ideas
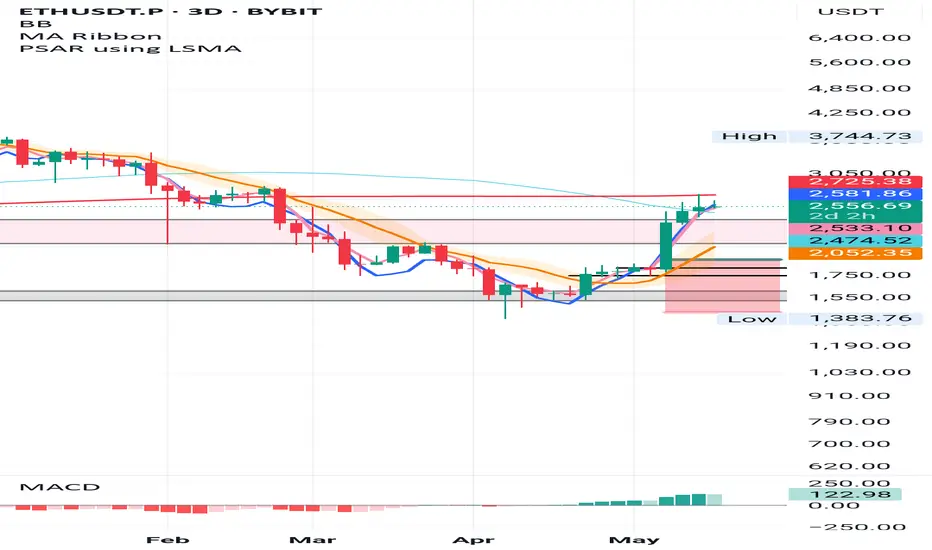
ETH 3D – System Trigger, 200MA Test & Death Cross Insight
This was the actual trigger for my ETH long.
The system gave the green light on 3D:
✅ PSAR flip
✅ MLR > SMA > BB center
Now ETH is testing the 200MA from below, which lines up with the 50/200 death cross — often seen as bearish, but here it likely confirms the bottom already built through March–April.
MACD is pushing up strong.
The signal came from this chart — and I'm still in the move.
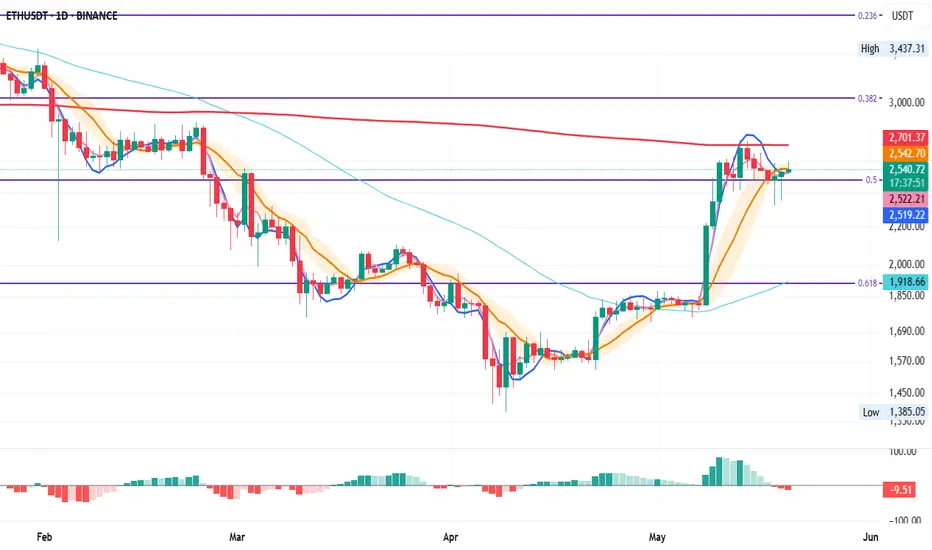
ETH Update: Pressed Between Key Levels on the Daily
ETH is currently pressed between the 200MA and the 50% Fibonacci level—two major areas of interest.
On May 14th, we saw a clear rejection at the 200MA, followed by solid support at the 50% Fib on May 18th-19th. 📉
MLR < SMA < BB Center isn't ideal, so we need to play it safe and let price do its thing. If we close above the BB Center and macro conditions support the move, we could see upside. 🌱
⚠️ Keep safe, follow for unbiased TA, and always manage risk! 📊
ETH - Ranges overview Let's have a look at how ETH is trading alongside BTC setting a new all time high.
Not much has happened on the side of ETH since our last chart analysis. ETH is lagging in comparison to BTC and is yet to show us a willingness to aggressively push higher.
The plan remains straightforward and the exact same as previously.
IF we reclaim 2.5K and hold it, expect us to aggressively trade towards the 3.4K-4K range.
IF we fail to hold 2.5K (clean break and hold below) expect ETH to trade back toward 1.8K.
Stay safe and never risk more than 1-5% of your capital per trade. The following analysis is merely a price action based analysis and does not constitute financial advice in any form.
ETHUSDT UpdateThe best reversal point for ETH, and now is time to close part of the trade...
Hope to see ETH in next reversal zone to trade with higher risk...
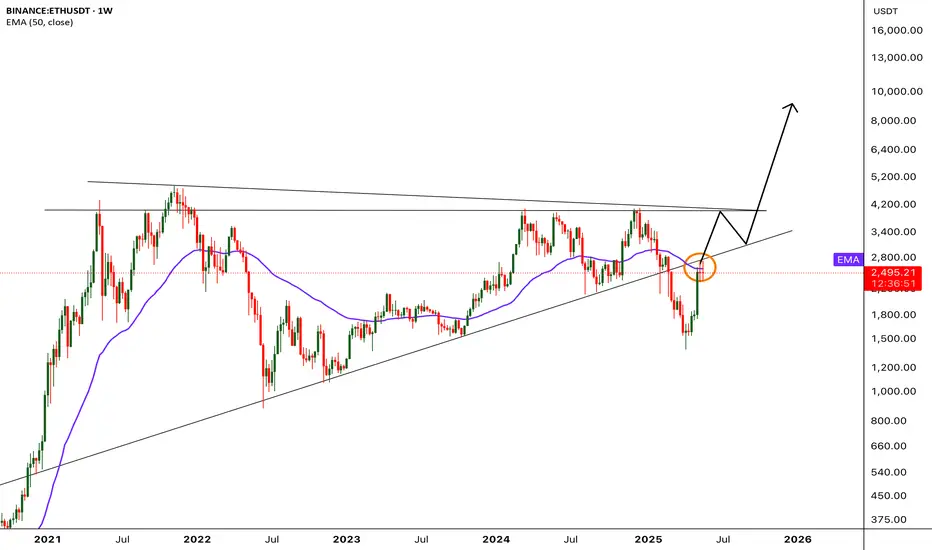
ETH - Trading at crucial resistance levelBINANCE:ETHUSDT (1W CHART) Technical Analysis Update
ETH is currently trading at $2500 range and the price is at crucial resistance zone, previously ETH had one if its largest crash after this support line was broken, now the same support line is acting as resistance.
50 EMA is also acting as a strong resistance in this are.
ETH needs to breaks this resistance to reach the next resistance around 4k USDT. if ETH cross 3K then 4k is an easy target.
Im expecting this resistance to break in next couple of weeks.
Short term target 3100
Mid Term Target 4000
Long Term Target 7000-9000a
a
aRemember to set your stop loss.
Follow our TradingView account for more technical analysis updates. | Like, share, and comment your thoughts.
Cheers
GreenCrypto
ETHEREUMKey Determinants of Ethereum Price Movement
Ethereum’s price is influenced by a combination of technological, market, regulatory, and macroeconomic factors:
1. Technological Developments and Upgrades
Ethereum 2.0 and The Merge: Transition to a proof-of-stake consensus has improved energy efficiency and scalability, enhancing Ethereum’s appeal.
Layer 2 Solutions: Technologies like Optimism and Arbitrum reduce transaction costs and increase throughput, encouraging broader adoption.
Upcoming Updates (e.g., Pectra Update): Simplify smart contract transactions and allow fees to be paid in tokens other than ETH, improving competitiveness against other blockchains.
2. Institutional Adoption and Investment
Growing interest from institutional investors, including the approval of Ethereum ETFs, increases capital inflows and market confidence.
Tokenization of real-world assets on Ethereum by financial firms supports long-term demand.
3. Decentralized Finance (DeFi) and dApps Growth
Ethereum remains the leading platform for DeFi protocols, NFTs, and decentralized applications, driving network activity and demand for ETH.
Expansion of use cases strengthens Ethereum’s fundamental value.
4. Competition from Other Blockchains
Faster and cheaper alternatives like Solana and Sui pose competitive risks, potentially limiting Ethereum’s market share and price growth.
5. Regulatory Environment
Regulatory clarity or uncertainty significantly impacts investor sentiment and price volatility. Positive regulatory developments tend to boost prices, while crackdowns can depress them.
6. Market Sentiment and Macro Factors
Broader crypto market trends, investor risk appetite, and macroeconomic conditions (inflation, interest rates, USD strength) influence ETH price movements.
Volatility in traditional markets and geopolitical events can drive safe-haven demand or risk-off selling.

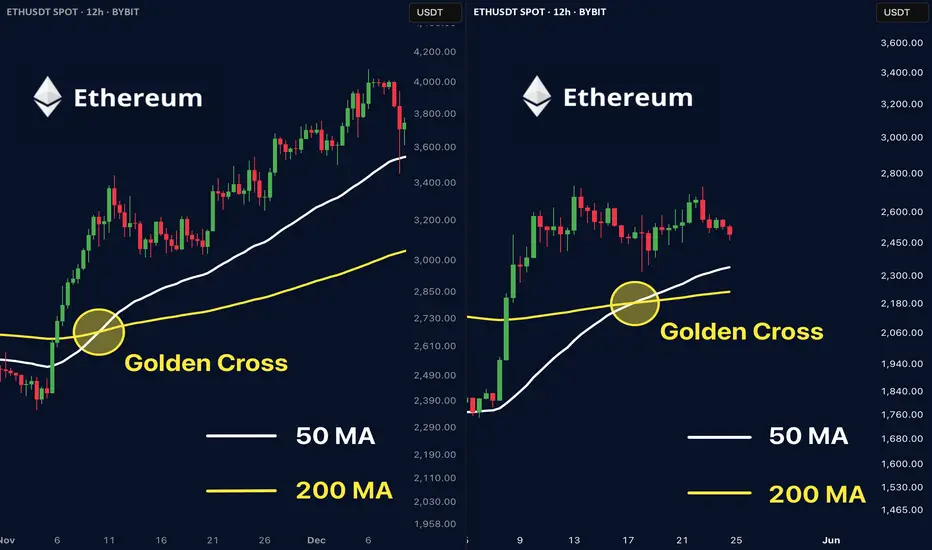
Ethereum Golden Cross ETHEREUM GOLDEN CROSS JUST FLASHED 🚨
LAST TIME THIS HAPPENED:
➡️Small Dip
➡️Day 11: Explosive Pump
We're now at Day 7.
You've got 4 Days before history repeats.
ARE YOU READY?
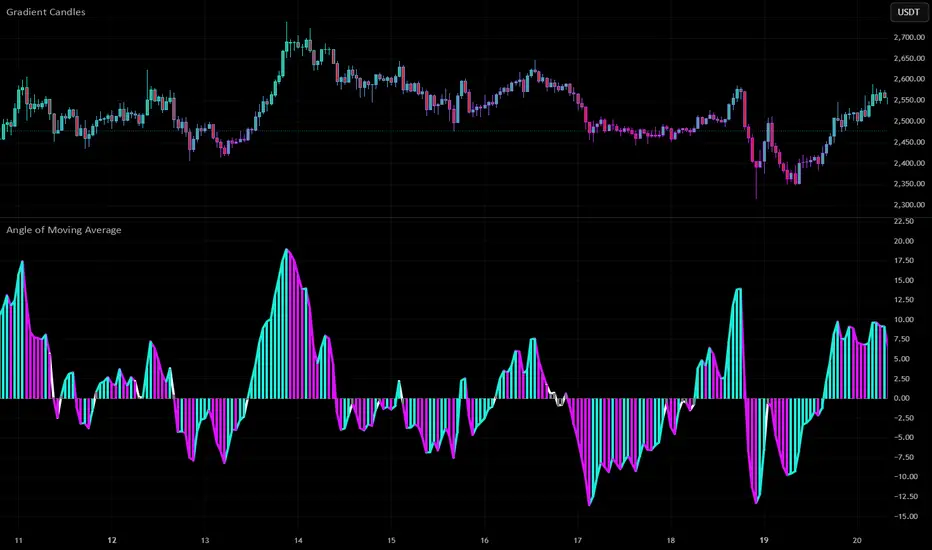
Trade the Angle, Not the Chop: Angle of MA ExplainedNot all moving averages are created equal. While most traders rely on the slope of a moving average to gauge trend direction, the Angle of Moving Average script by Mango2Juice takes it a step further—literally measuring the angle of the MA to help filter out sideways markets and highlight trending conditions.
Let’s explore how this tool works, how we use it at Xuantify, and how it can sharpen your trend-following strategy.
🔍 What Is the Angle of Moving Average?
This indicator calculates the angle of a moving average (default: EMA 20) to determine whether the market is trending or ranging. It introduces a No Trade Zone , visually marked in gray, to signal when the angle is too flat—suggesting the market is consolidating.
Key Features:
Measures the slope of the moving average
Highlights ranging zones with a gray color
Helps filter out low-momentum conditions
Customizable MA type and length
🧠 How We Use It at Xuantify
We use the Angle of Moving Average as a trend filter —not a signal generator.
1. Trend Confirmation
We only take trades in the direction of a steep enough angle. If the MA is flat or in the gray zone, we stay out.
2. Entry Timing
We combine this with structure tools (like BOS/CHOCH) to time entries after the angle confirms a trend is underway.
🎨 Visual Cues That Matter
The script uses color to show when the market is:
Trending : Clear slope, colored line
Ranging : Flat slope, gray line (No Trade Zone)
This makes it easy to:
Avoid choppy markets
Focus on momentum-driven setups
Stay aligned with the dominant trend
⚙️ Settings That Matter
You can customize:
MA Type : EMA, SMA, etc.
MA Length : Default is 20
Angle Sensitivity : Adjust to define what counts as “flat”
⚙️ Higher timeframe alignment
You can look at HTFs for better and stronger entry and exit points.
Below a 1H and 4H chart where the 4H clearly adds strong buying power for a good long entry point.
🔗 Best Combinations with This Indicator
We pair the Angle of MA with:
Structure Tools – BOS/CHOCH for trend context
MACD 4C – For momentum confirmation
Volume Profile – To validate breakout strength
Fair Value Gaps (FVGs) – For sniper entries
⚠️ What to Watch Out For
This is a filter , not a signal. It won’t tell you when to enter or exit—it tells you when not to trade . Use it with price action and structure for best results.
🚀 Final Thoughts
If you’re tired of getting chopped up in sideways markets, the Angle of Moving Average is a simple but powerful filter. It helps you stay out of low-probability trades and focus on trending opportunities.
Try it, tweak it, and see how it fits into your system.
See if it can find support near 2521.05 and go up
Hello, traders.
If you "Follow" me, you can always get the latest information quickly.
Have a nice day today.
-------------------------------------
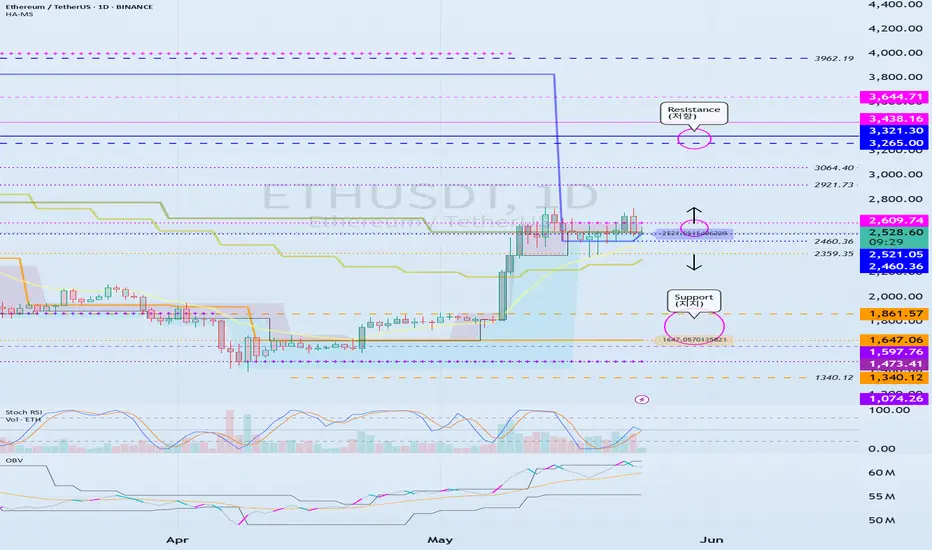
(ETHUSDT 1D chart)
The two charts above are charts that use the HA-MS indicator to mark support and resistance points on the 1M, 1W, and 1D charts.
The chart below is just a chart with the HA-MS indicator hidden.
If you look closely at the drawn support and resistance points, you can see that the points drawn with the HA-Low and HA-High indicators are important support and resistance points.
The HA-Low indicator is marked in orange (#ff9800), and the HA-High indicator is marked in blue (#0000ff).
It is impossible to explain all the thoughts of a chart analyst in writing.
That is why it is necessary to provide objective information to the readers.
Then, it will be very helpful for you to look at the chart.
If you think that my idea has too many indicators, you can disable the indicators by clicking "Grab this chart" in the idea article.
If you look at the chart with the indicators disabled, you may think that something looks better, but since you don't know why these support and resistance points were drawn, you may not be able to properly utilize the support and resistance points drawn on the chart when actually trading.
Even the support and resistance points you drew yourself often become unreliable due to the movement of the chart over time, and you will be even less reliable when it comes to support and resistance points drawn by others.
In order to reduce this phenomenon, objective information is necessary.
For that objective information, I use the HA-MS indicator.
For the trend perspective, there is the M-Signal indicator, and for the trading perspective, there are the HA-Low and HA-High indicators.
To understand the detailed movement, we use the DOM(60), DOM(-60), StochRSI 50, StochRSI 80, and StochRSI 20 indicators.
Therefore, you can basically interpret the chart by activating only the HA-Low, HA-High, and M-Signal indicators.
-
Therefore, if we interpret the chart, if it rises from the current price position, the resistance zone is around 3265.0-3321.30, and if it falls, the support zone is around 1647.06-1861.57.
You can see that the HA-High indicator is newly created at the current price position, and the M-Signal indicator on the 1M, 1W, and 1D charts is passing, so we can see that it is at an important turning point.
Therefore, the key question is whether the price can be maintained above 2609.74 or whether it will fall below 2359.35.
However, since the HA-High indicator is newly created, it is more likely to fall.
Since the OBV indicator showed that the OBV fell below the High Line, we need to check whether it can touch the OBV EMA again and rise above the High Line.
If the StochRSI indicator falls below 50, we need to focus on finding a time to buy, and if it rises above 50, we need to focus on finding a time to sell.
Since the OBV is currently on an upward trend, if this trend continues, the price is expected to eventually rise.
-
Thank you for reading to the end.
I hope you have a successful transaction.
--------------------------------------------------
- This is an explanation of the big picture.
(3-year bull market, 1-year bear market pattern)
I will explain more details when the bear market starts.
------------------------------------------------------
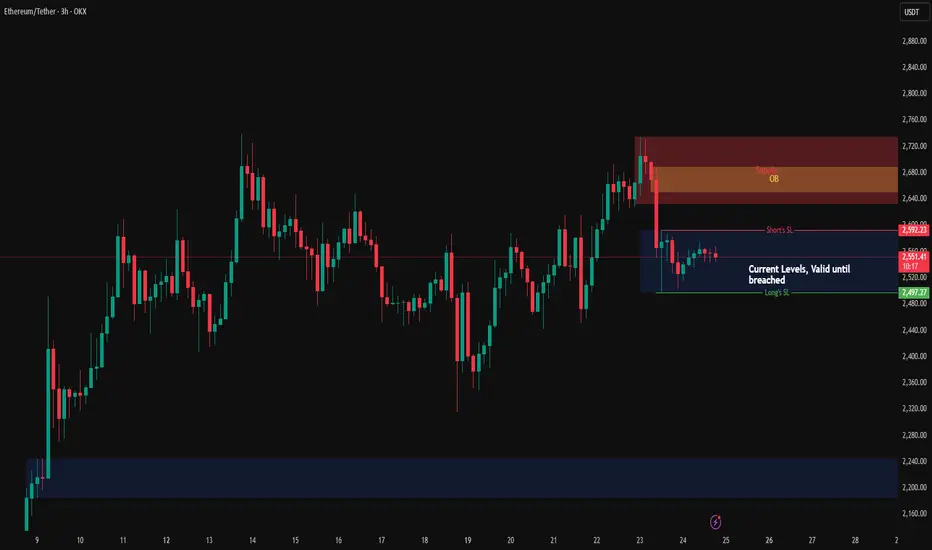
ETH Weekend/next week levelsETH plan for the weekend (24-05-2025 to 25-05-2025) and following week with focus on FOMC minutes on 28th May.
Current zone marked offers long/short SL's if anyone wants to trade within current zone on LTF.
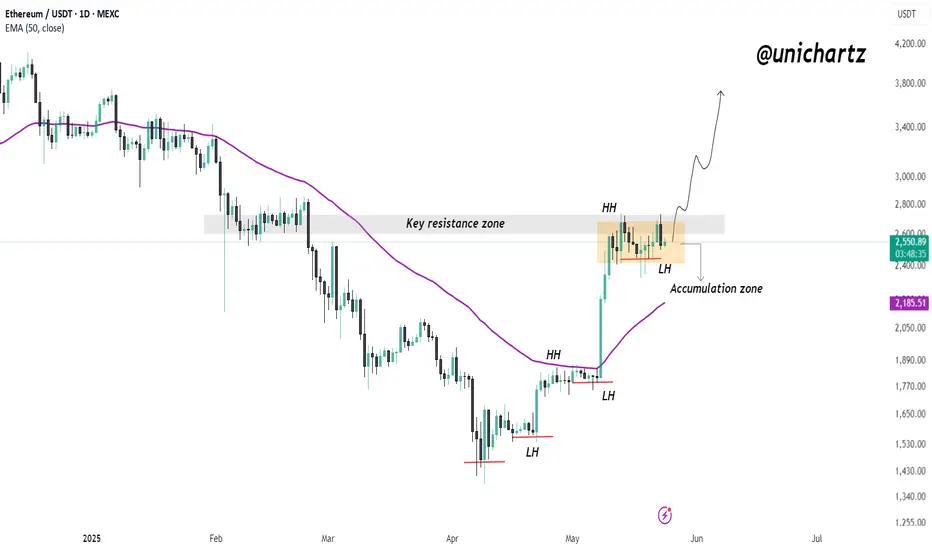
ETH Staying Bullish – Break Above Could Target $3K+$ETH/USDT Update
ETH is moving strong, forming clear higher highs and higher lows. Right now, it’s ranging in an accumulation zone just below key resistance.
As long as it holds above the 50 EMA and recent low, the trend looks bullish. A breakout here could send it flying toward $3,000+.
Still healthy, still in play.
DYOR, NFA
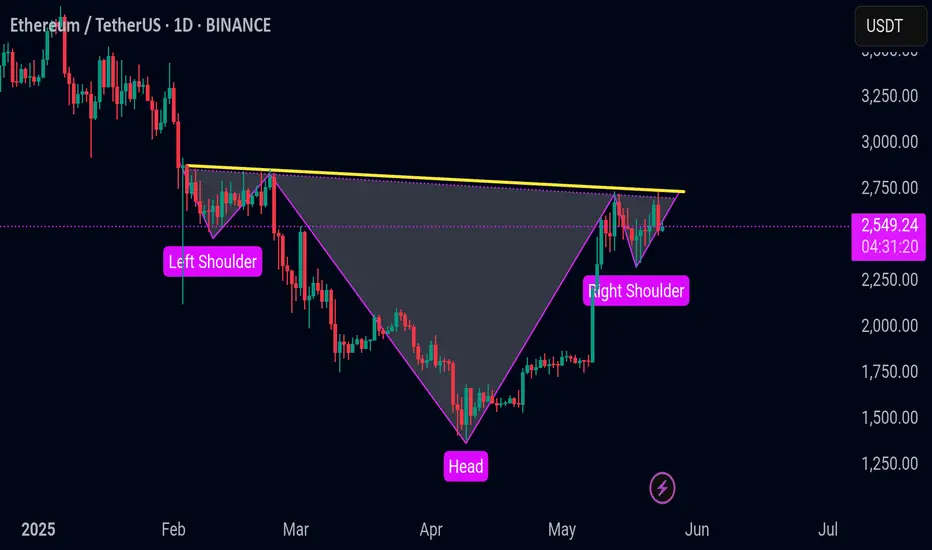
ETHUSDT UPDATE ETHUSDT
Ethereum is currently trading around the \$2550 level and is forming an inverse head and shoulders pattern on the daily timeframe. This is typically seen as a bullish reversal pattern, especially after a sustained downtrend.
If the price breaks above the neckline and closes with strong volume, it could confirm the pattern and signal a potential move to the upside. This breakout would likely invite bullish momentum and lead to higher price targets in the short to mid term. On the other hand, if Ethereum fails to break the neckline and gets rejected, it may continue to consolidate or revisit lower support areas.
Keep a close watch on the neckline level, price action, and volume — these will be key in validating the potential breakout.
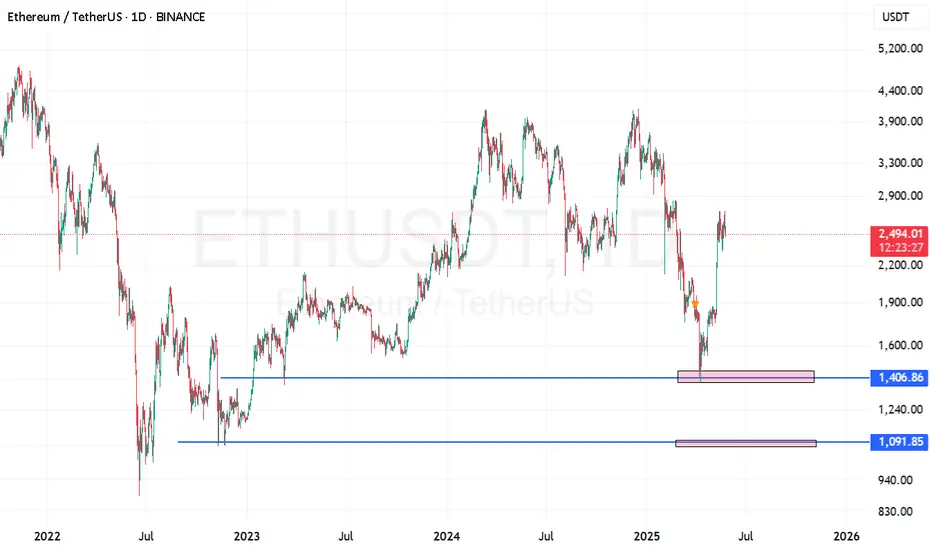
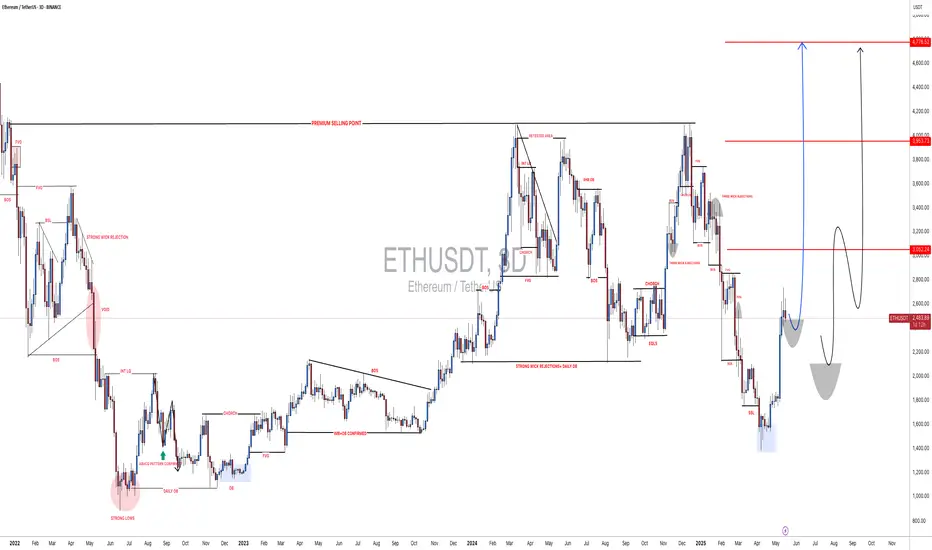
ETHUSDT: Possible Minor to Major Corrections May HappenETHUSDT has a higher chance of experiencing a minor or major correction in the coming days, although we haven’t confirmed this yet. We need more confirmation before we can be certain about the future of ETH. However, if the price decides to undergo a major correction, it’s likely to drop to our second area, where it’s expected to fill the liquidity gap and then reverse, continuing towards our three targets.
Please use this analysis as secondary bias only or even only for educational purposes. Always conduct your own analysis and risk management before trading or investing in cryptocurrencies, as they carry significant financial risk. Good luck and trade safely.
If you want to support us, you can do so by liking the idea, commenting with your views, or sharing it.
Much love ❤️
Have a great weekend
Team Setupsfx_
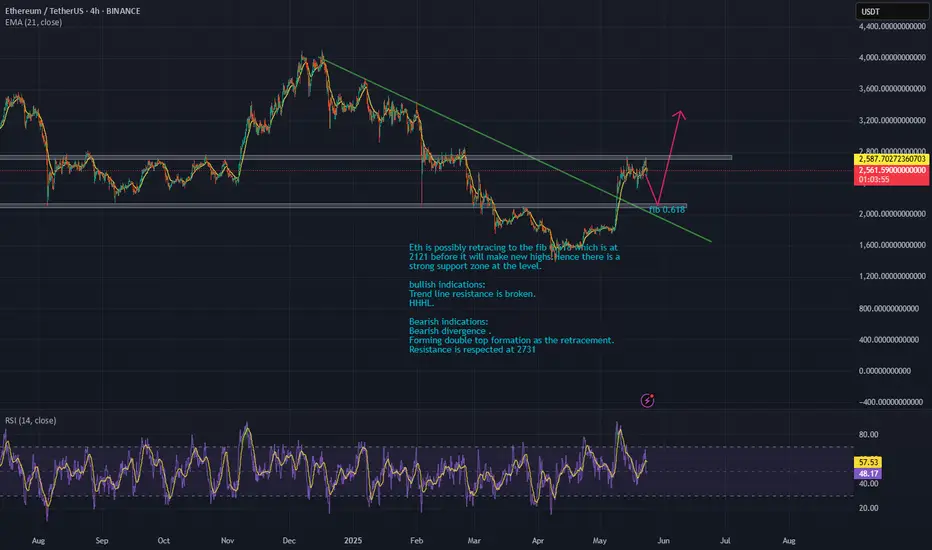
ETH-bias long once retracesEth is possibly retracing to the fib 0.618 which is at 2121 before it will make new highs. Hence there is a strong support zone at the level.
bullish indications:
Trend line resistance is broken.
HHHL.
Bearish indications:
Bearish divergence .
Forming double top formation as the retracement.
Resistance is respected at 2731
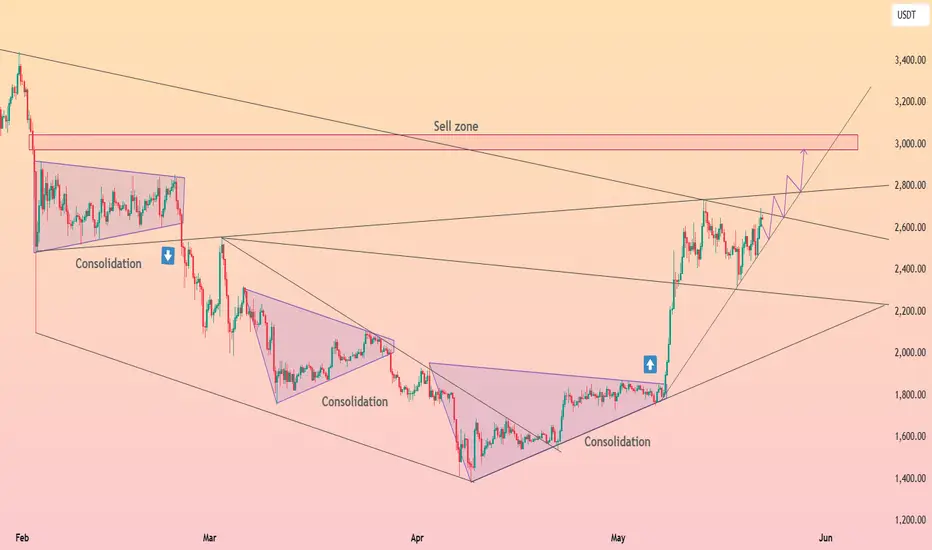
HolderStat┆ETHUSD pressing trend resistanceCRYPTOCAP:ETH blasted out of a mega-triangle, topping at 2.80 k, and keeps pressing along an aggressive rising trendline. Candles are marching through overlapping consolidations, each one springboarding higher; sustain footing above 2.55 k and the route to the 3.0-3.1 k sell zone stays paved. Slip back under 2.40 k and a broad retest of the prior wedge roof near 2.25 k awaits.

ETH long signalETH looks great for short term trade.
*Depends on how the market will behave during this week*
ETH-USDT // 15 Min // Technical analysis // Short SetupI’m looking at a clean short opportunity on ETHUSDT. Price has been respecting this ascending channel for the past few days, bouncing perfectly between support and resistance.
Right now, it just tapped the top of the channel and showed signs of rejection. That’s where I’m planning to take the entry.
🟢 Entry: 2696.26
🎯 Target: 2580.27
🔴 Stop Loss: 2743.38
💥 RR: Around 2.4R
I’m expecting a pullback towards the lower channel line, where price has reacted multiple times before. If the channel continues to hold, this could play out nicely.
Not using any fancy SMC here — just basic structure, momentum, and clean price action. Let’s see how it goes 🤞
📌 Always trade with proper risk management. This is just my view, not financial advice.

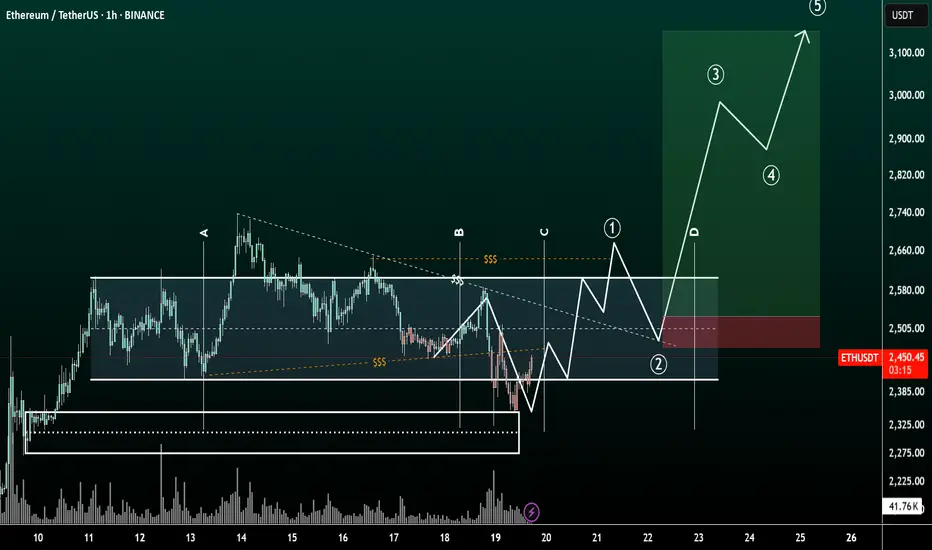
ETH — Bull Flag or Trap? Trade Plan with TargetsETH is setting the stage for its next major move — and the chart is packed with clues.
After completing Wave 3 at $2738.50, ETH has entered a corrective phase, forming what looks like a bullish flag. But beneath the surface, smart money levels are aligning: VWAP, Fibs, key levels, and liquidity traps are all converging around one high-probability zone.
This analysis breaks down both the long and short setups, backed by real confluence and clean R:R opportunities. Whether you’re planning to snipe the reversal near support or fade the rally at resistance, you’ll walk away with a clear trade plan and deeper insight into how price reacts at precision levels.
Let’s get into it.
🟢 Bullish Scenario: Long Setup with Deep Confluence
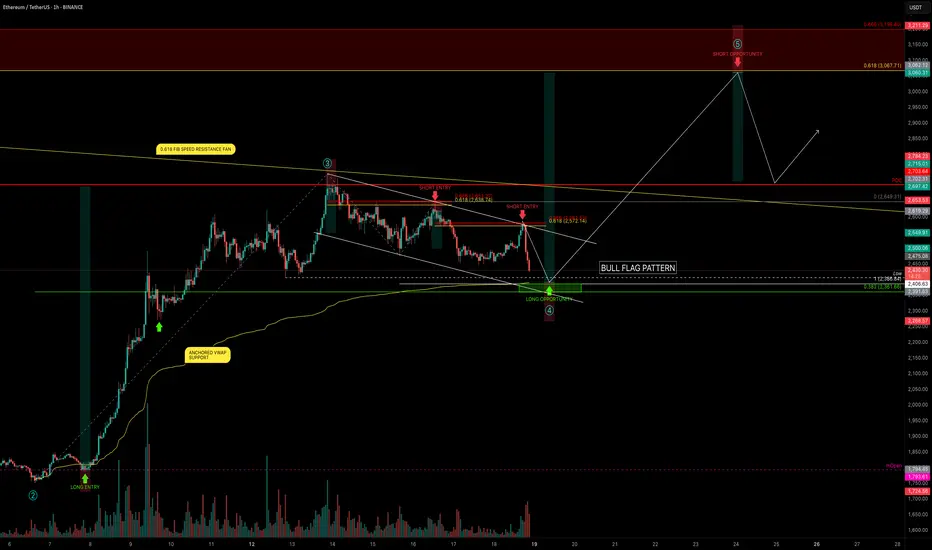
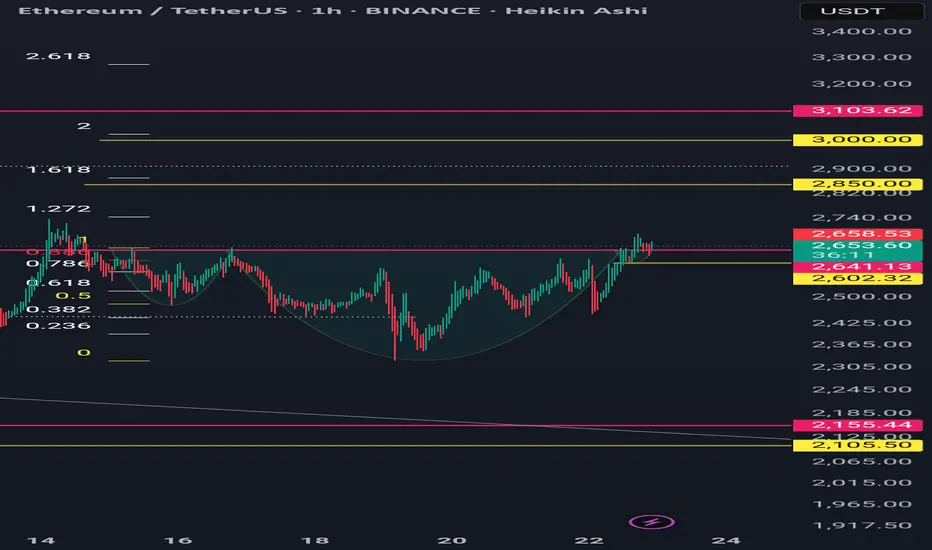
After a fakeout pump into the golden pocket of this minor downtrend (typical for a Sunday), ETH rejected cleanly at the upper resistance of the bull flag channel.
We're now watching for the swing low at $2406.63 to be swept, setting up a potential SFP (Swing Failure Pattern) at a highly confluent support zone:
🔍 Confluence at the $2390–$2360 Zone:
Anchored VWAP from the Wave 3 origin at $1752 is sitting at $2390
Trend-Based Fib Extension 1:1 of the correction lands at $2386.84
Liquidity pool just under the recent swing low
0.382 Fib retracement of the entire Wave 3 at $2361.66
0.618 Fib Speed Resistance Fan intersects this zone
Lower bull flag support line also aligns
This makes the $2390–$2362 zone a high-probability bounce area.
📌 Plan:
Laddered long entries between $2390–$2362, watching closely for a clean SFP or reversal signal.
Target 1: $3000 psychological level
Target 2: 0.618 Fib retracement at $3067.71 (potential Wave 5 top)
Stop-loss: Below previous yearly open (can be tightened after confirmation)
R:R: 1:5 or better after SL adjustment
🔴 Bearish Scenario: Short Setup at Key Rejection Zone
If ETH makes a move up to complete the 5th wave, we monitor $3067.71 — the 0.618 retracement of the entire corrective leg — as a key resistance.
If price rejects here with momentum loss or bearish structure:
📌 Plan:
Short on confirmed rejection of $3067.71
Stop-loss: Above $3211 (above 0.666 Fib)
Target: Previous high near $2700 or lower
R:R: 1:2 or better depending on entry and structure
🧠 Educational Insight: Why Confluence Increases Probability
Many traders chase setups based on single indicators. Real edge comes from stacking independent tools: VWAPs, Fibs, FVGs etc... When they align, the setup isn’t random — it’s high conviction.
This strategy gives you a framework to anticipate where price is likely to move and why, rather than reacting emotionally.
Patience and preparation will always outperform panic and reaction. Trade the plan — not the impulse.
___________________________________
If you found this helpful, leave a like and comment below! Got requests for the next technical analysis? Let me know.
Ethusdt 1hr time frame a not so perfect bullish iH&S patternETH/USDT: A not-so-perfect bullish Inverse Head and Shoulders (iH&S) pattern has formed and already activated.
Targets are $2850 and $3000.
Invalidation is a 1-hour close below $2602.
This is a very tight swing trade, but offers a good risk-to-reward ratio if it plays out well. Please manage your risk according to your strategy.
Ethereum (ETH): Buyers Pressuring Local High | Looking For BreakBuyers are pressing the local high on ETH, where we are looking for a proper breakout to happen soon, so we are switching ourselves to a PLAN A scenario.
As soon as we see some kind of breakout to form, we will be looking for an entry for a long position here so watch closely.
Swallow Academy

ETH - BBB - Bullish Building Block!Hello TradingView Family / Fellow Traders. This is Richard, also known as theSignalyst.
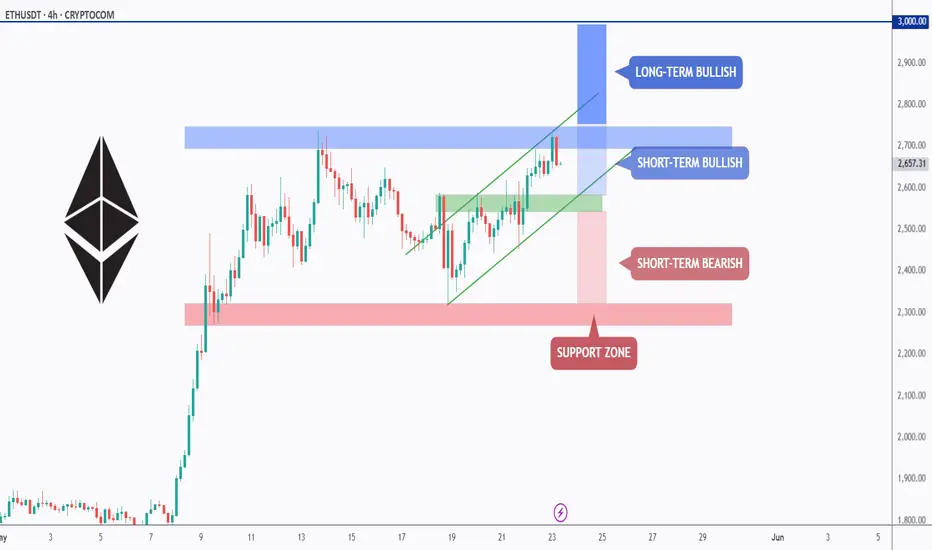
🏢 ETH Building Blocks:
📈 Short-Term Bullish:
ETH is currently bullish trading within the second floor in the shape of a rising channel marked in green.
As ETH retests the lower green trendline and $2,550 structure, we’ll be looking for short-term trend-following long setups!
📈 Long-Term Bullish:
For the bulls to remain in control medium-term and push towards the $3,000 mark, a break above the last major high at $2,750 is needed.
📉 Short-Term Bearish:
If the $2,550 structure is broken downward, ETH's momentum will be shifted from bullish to bearish leading to a correction phase towards the $2,300 support.
📚 Always follow your trading plan regarding entry, risk management, and trade management.
Good luck!
All Strategies Are Good; If Managed Properly!
~Rich