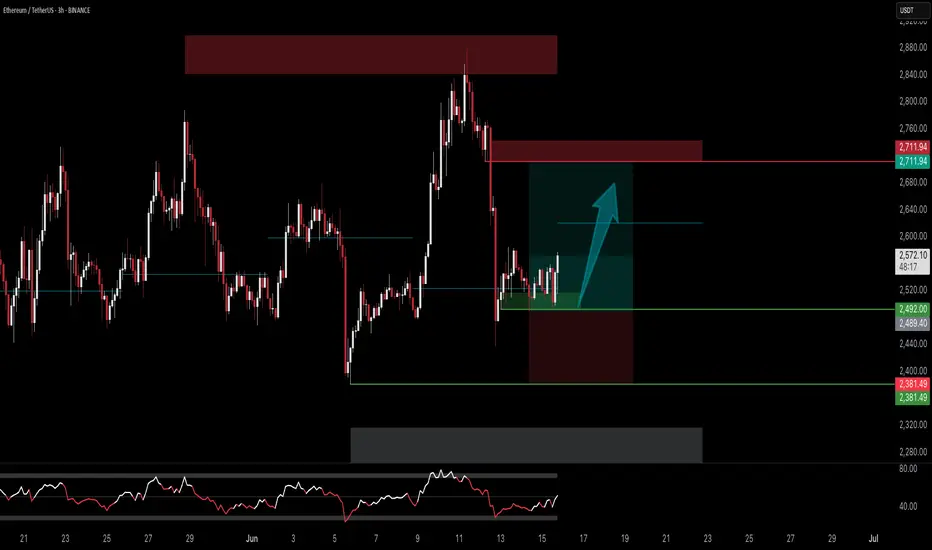
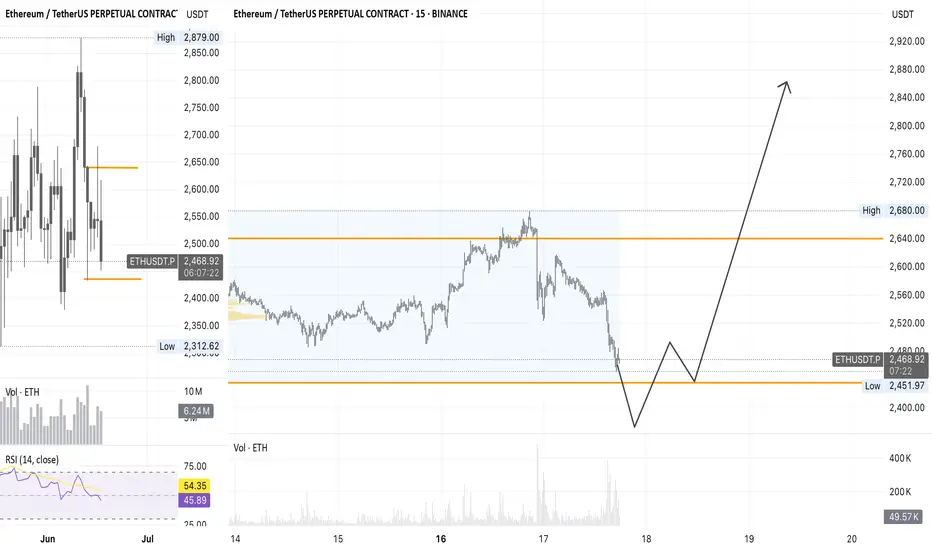
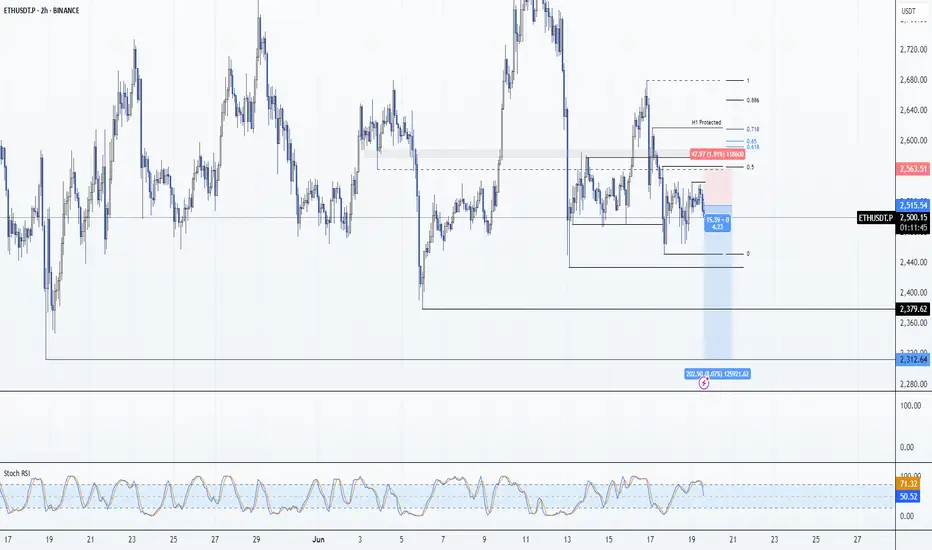
Lingrid | ETHUSDT potential Bullish Trade from the ConfluenceBINANCE:ETHUSDT is retesting a key support area near 2500 following a deep pullback from the 2765 rejection zone, while holding above a multi-week ascending trendline. The recent bounce has not yet invalidated the bullish structure, and the confluence with the downward breakout level adds significance to this zone. A higher low above 2480 could trigger a sharp reversal back toward the 2765 resistance.
📈 Key Levels
Buy zone: 2475–2520
Sell trigger: breakdown below 2450
Target: 2765
Buy trigger: breakout above 2620
💡 Risks
A breakdown below 2475 would cancel the bullish setup
Lack of volume on bounce attempts may signal weakness
Macro events or BTC drop could drag ETH lower regardless of setup
Traders, if you liked this idea or if you have your own opinion about it, write in the comments. I will be glad 👩💻
ETHUSDT.3S trade ideas
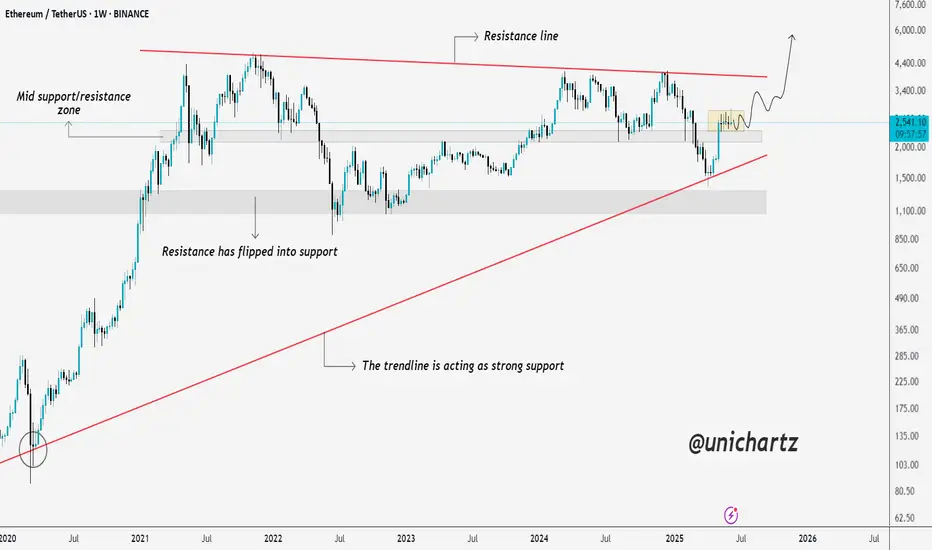
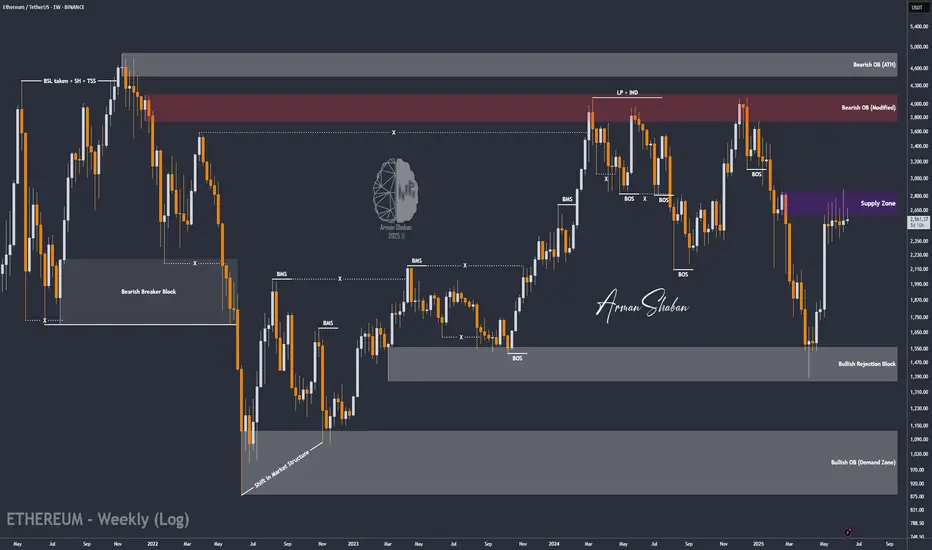
Ethereum Weekly Chart Shows Strength Above Key SupportEthereum is showing strong structure on the higher time frame. After rejecting lower levels, price has reclaimed the mid support/resistance zone, and is now consolidating just above it.
What’s key here is the long-term rising trendline, which has held beautifully since 2020 and once again acted as a springboard for the recent bounce. This kind of confluence — trendline + zone flip — adds weight to the current price structure.
If ETH maintains this zone, we could see accumulation continue, followed by a breakout toward the upper resistance line. For now, the chart leans bullish, but patience is key as consolidation plays out.
DYOR, NFA
Ethereum Weekly: Bullish & Bearish ExplainedEthereum has been sideways five weeks straight. Market conditions here are bullish and bearish short-term. Let me explain.
The market has bearish potential because of resistance. Ethereum has been facing resistance and fails to move forward for more than one month, but the bias isn't bearish, this is just a potential based on short-term price action.
The market has bullish potential because of a strong recovery after the 7-April low; because it trades above the August 2024 low and because there is very little retrace since the 5-May break of resistance in the form of EMA34 and MA200.
Ethereum is bullish because it trades above MA200 and remains above this level.
We are seeing bullish consolidation. There was an advance recently and after this advance the market went sideways. This means bullish.
While there can be a retrace short-term, market conditions remain bullish for this pair; ETHUSDT.
The bulls have the upper-hand and the majority of signals are bullish. Ethereum will continue to grow.
There is no scenario where Ethereum moves and closes weekly below its 3-Feb and 24-Feb lows ($2,075). It is simply consolidating before additional growth. It is going to go up, sooner rather than later.
Thanks a lot for your continued support.
Namaste.
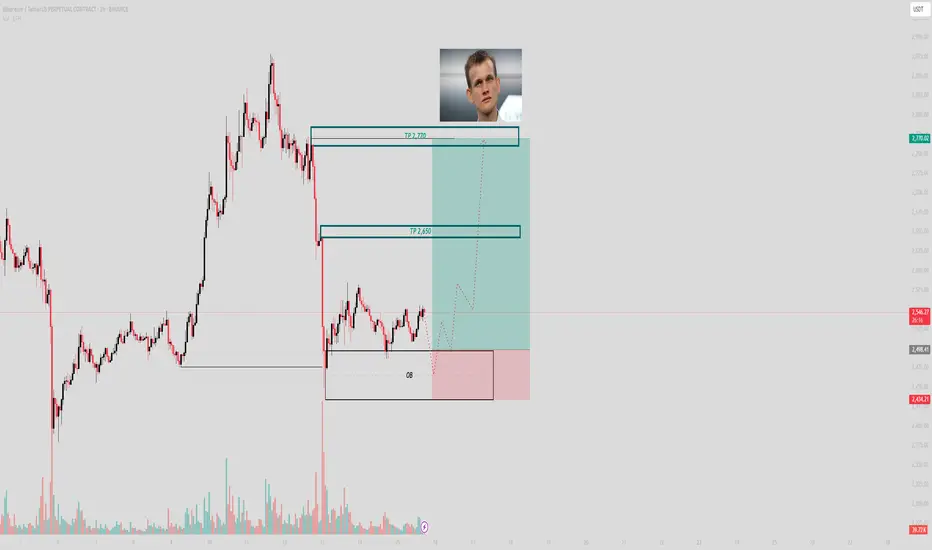
Vitalik didn’t draw this box. I did — and I’m trading itPrice delivered the sweep. Now it’s coiling inside my range, hovering just above the 1H OB like it’s waiting for permission. I don’t need permission. I need structure — and I’ve got it.
The logic:
ETH dropped into a clear demand zone — not a guess, a confirmed 1H Order Block. Since then, it’s printed compression just above the OB. Every wick into the range was absorbed — no expansion, just preparation.
Above us? Two objectives:
TP1: 2650 — inefficiency fill and previous high-volume rejection
TP2: 2770 — full reprice and external liquidity sweep
If price dips into the OB again? That’s not invalidation — that’s refinement.
Execution:
Entry: 2480–2500 (or on OB retest)
SL: Below 2434
TP1: 2650
TP2: 2770
You don’t chase this. You wait for it — then load it without hesitation.
Final thought:
“Smart Money doesn’t buy the candle. It buys the context.”
ETHUSDT Perpetual – Breakout Trade SetupThis setup represents a clean long position entry on ETHUSDT.P with clear invalidation and target levels.
Trade Details:
Position: Long
Entry Price: $2,540.75
Stop Loss: $2,430.58
Take Profit: $2,705.33
Risk-to-Reward (RRR): ~1.45
Timeframe: Not specified (likely 1H or 4H)
Setup Rationale:
Price is attempting a recovery from a local support zone, aiming for continuation toward $2,700 resistance area.
Trade assumes strength in bullish follow-through if $2,540 is held.
Tight stop loss below the key liquidity area ($2,430s) protects from downside volatility.
Conclusion:
This is a classic trend-continuation breakout trade, entering slightly above consolidation with a moderate risk-reward ratio. Close monitoring of price action around the entry zone is important for managing exposure if the breakout fails.

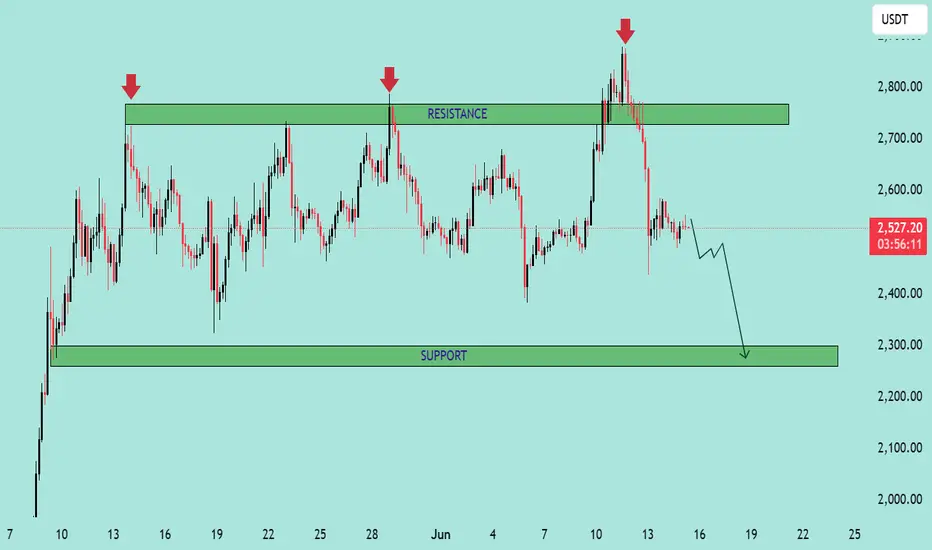
ETH/USDT – Bearish Reversal from Resistance Zone ETH/USDT – Bearish Reversal from Resistance Zone 📉
The chart above clearly illustrates a strong bearish setup on the ETH/USDT pair. Here's a professional breakdown:
📊 Technical Overview:
Resistance Zone (~2750–2850 USDT):
Marked by three distinct rejections (highlighted by red arrows).
Every attempt to break above this zone has resulted in a sharp price rejection, indicating strong selling pressure.
Current Price: 2529.69 USDT
Price has already broken below the immediate support formed after the last rejection.
The pair is now trending lower with bearish momentum.
Support Zone (~2250–2350 USDT):
This is the next major demand zone where previous accumulation took place.
The projection arrow indicates the likely path toward this area.
🔍 Price Action Insights:
Repeated failure to break resistance confirms a triple top pattern, a classic bearish reversal signal.
The recent sharp drop from the top is accompanied by strong bearish candles, showing momentum.
Minor consolidation might occur before continuation downward, as suggested by the zigzag arrow.
📉 Conclusion:
If bearish momentum sustains, ETH/USDT is likely to drop toward the 2,300 USDT support zone. A break below could open the door for even lower levels, while any bounce would need to reclaim the 2,700 USDT level to shift sentiment.
📌 Traders should watch for lower highs and bearish confirmations before entering short positions.
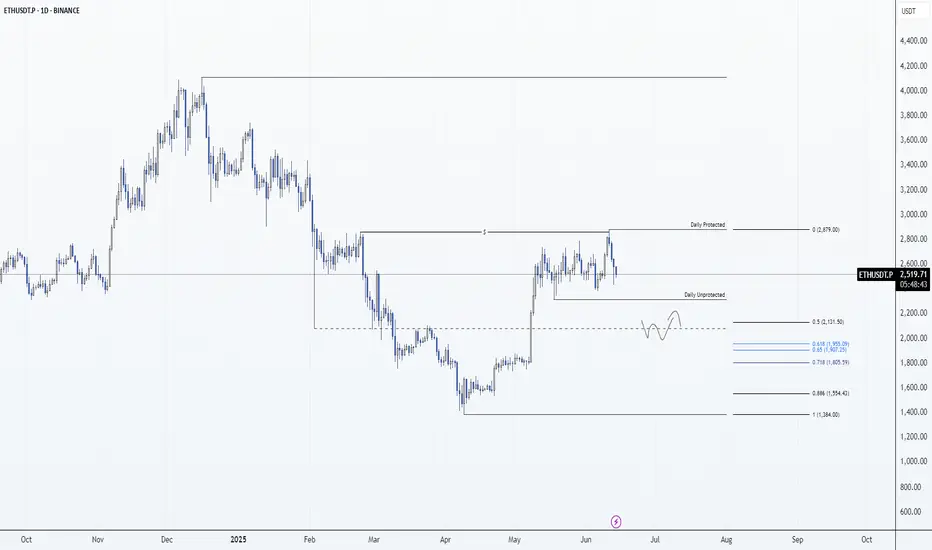
Ethereum Holds the Line – Is $2,300 the Key to the Next Rally?By examining the #Ethereum chart on the weekly (logarithmic) timeframe, we can see that after rising to $2,880, the price faced selling pressure and corrected down to $2,500. This upward move created a large Fair Value Gap (FVG) between $1,870 and $2,300, which is likely to be filled in the medium term if the price drops further.
However, as long as Ethereum continues trading above the $2,300 level and does not close below it, we can still expect further bullish movement.
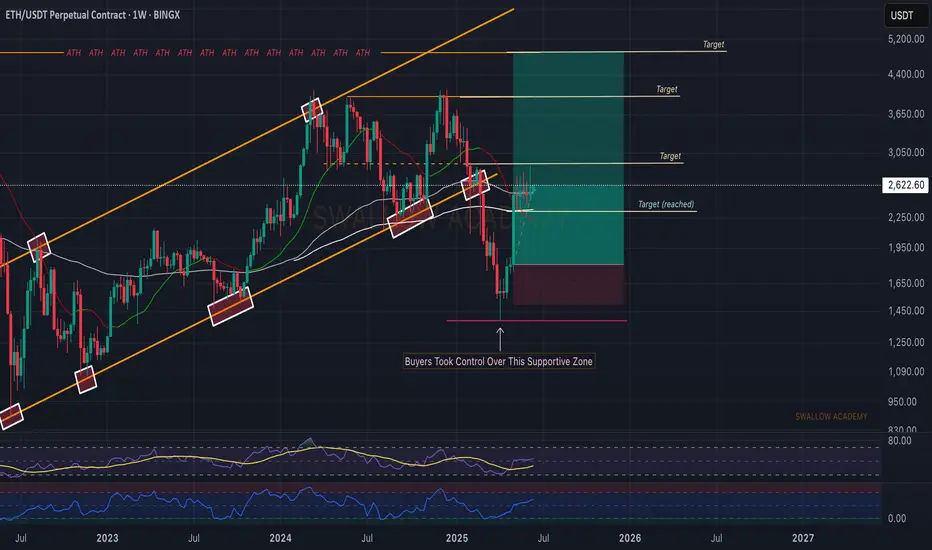
Ethereum (ETH): Golden Buy Zone | Buyers Taking ControlBuyers are taking control near the 200EMA, which could give us a really good bounce to upper zones from here on.
We see whales accumulating the ETH, which confirms our saying that Ethereum has not yet reached its potential.
The key zone is the 200EMA as of now.
Swallow Academy
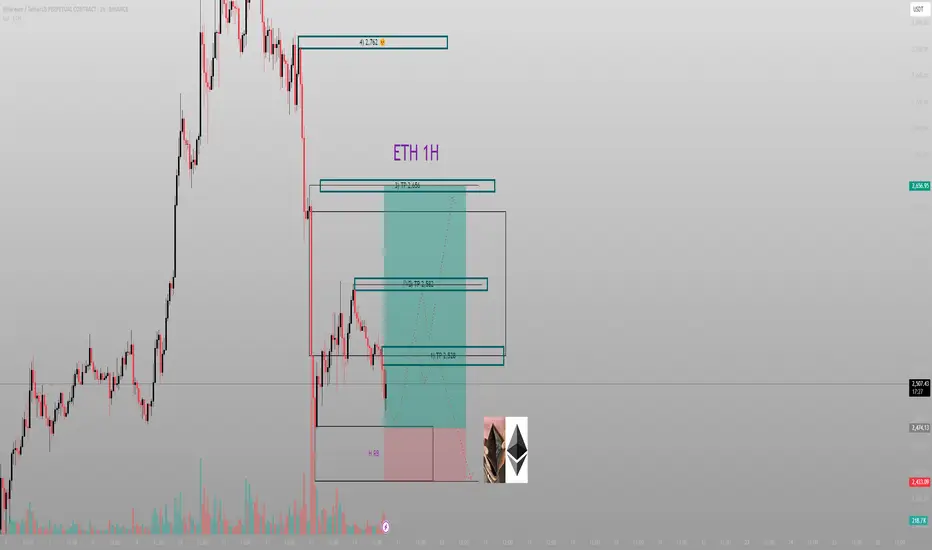
Every breakdown is just a setup — if you know where the reaccumuPrice collapsed. But I didn’t flinch. Because beneath that move sits something most won’t look for: High-Volume Rebalancing (H RB), paired with a clean FVG structure that tells me exactly where Smart Money wants to reload.
The structure:
The breakdown into ~2483 wasn’t just a move — it was intentional. That candle didn’t just fall, it delivered into the H RB zone and paused. Below that? Nothing but inefficient space and a tightly engineered low.
Above? Three clear target zones:
TP1: 2528
TP2 : 2582
TP3: 2656
Final objective: 2762 — the origin of the final collapse
Every leg above is engineered to grab liquidity, rebalance inefficiency, and then clear out the next range. It’s a chain of fulfillment.
The trade:
Entry: 2483–2500 zone
SL: Below the H RB zone (~2470)
TP1: 2528
TP2: 2582
TP3: 2656
Optional extension: 2762
We aren’t buying because it’s “down.” We’re executing because it’s deliberate.
Final thought:
“Collapse isn’t the end. It’s the invitation.”
Let the Market Teach You PatienceEvery red candle has a reason. Every drawdown has a lesson.
In this journey, it's not just about profits, it's about who you become.
As traders, we don’t just manage risk, we grow through it. Let patience, discipline, and humility shape you in silence, just like the markets do.
This is the mindset behind the candles.
#PEACE
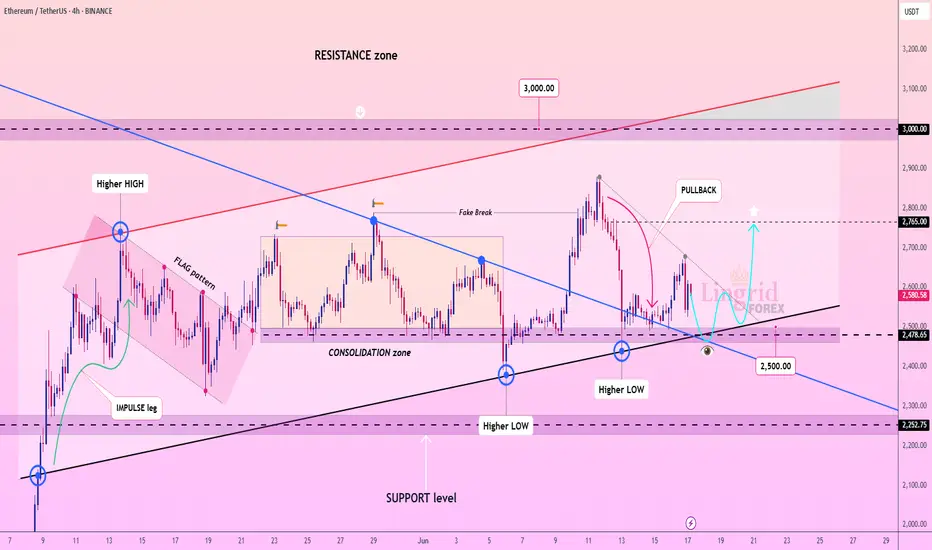
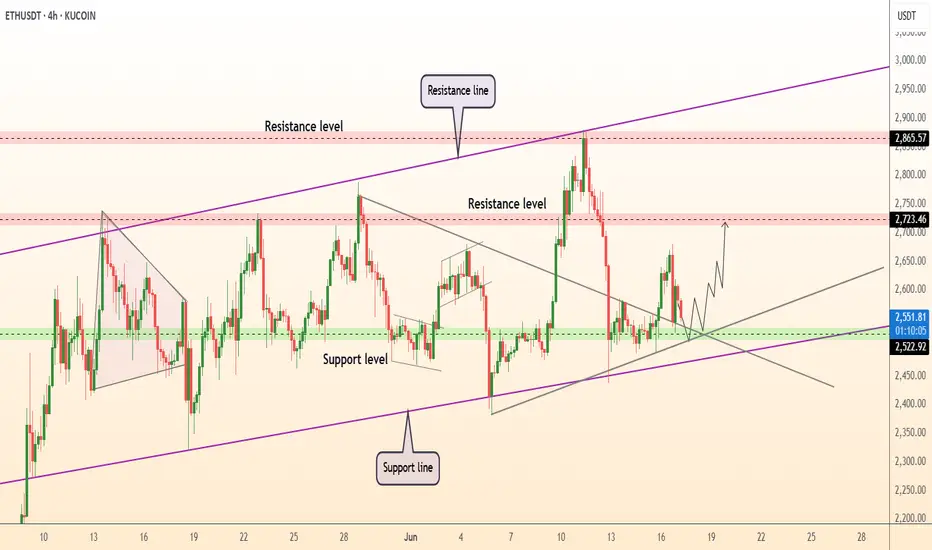
DeGRAM | ETHUSD held the trend line📊 Technical Analysis
● Price just printed a long-tailed rebound on the 4-month purple up-trend and the 2 520-2 560 demand strip, also reclaiming a broken pennant base—confirming a fake breakdown and locking the zone as fresh support.
● A higher-low sequence is compressing against the descending 2 650 trend cap; a 4 h close above it activates the 2 723 horizontal target and projects the channel-median swing toward 2 865.
💡 Fundamental Analysis
● Net staking deposits keep outpacing withdrawals while CME ether futures open-interest hit a six-week high, signalling renewed institutional hedging ahead of the spot-ETF ruling and supporting upside bias.
✨ Summary
Buy 2 540-2 580; clearance of 2 650 aims 2 723, stretch 2 865. Invalidate below 2 450.
-------------------
Share your opinion in the comments and support the idea with like. Thanks for your support!
ETH: Daily Timeframe 14/06/25Same idea as BTC — healthy corrective leg needed
Spot buyer at $2,100 and below
Will focus on accumulating other strong alts only when ETH is in my region of interest
No interest in predicting alt bottoms might bottom until BTC and ETH hit my buy zones
ETH LONG✅ Trading Setup Summary
1. Setup Type:
🔹 SFP (Swing Failure Pattern) or Trap at Key Level
🔹 Possibly forming a double bottom or liquidity grab at a known support zone.
2. Market Context:
🔸 Price returns to a previous key level with a volume spike
🔸 Likely in a bullish market structure (MS) or forming a reversal after a down move
🔸 Entry based on trap logic and session volume confirmation
3. Entry Logic:
✔ Wait for a stop hunt/SFP at liquidity zone
✔ Confirm with volume spike
✔ Enter after the rejection/confirmation candle
4. Stop Loss:
📍 Set just beyond the trap wick (below for long, above for short)
🎯 SL is defined and logic-based, not random
5. Target (TP):
🎯 Use 3–4R reward for intraday/session-based trades
🎯 Consider holding for more if Daily timeframe supports a longer move
6. Timeframe:
🕐 Entry on M15/M5, context from H1/D1
📌 Key Strategy Concepts Used
Trap (SFP)
Volume confirmation
Market Structure (MS)
Key Level (Support/Resistance)
Defined SL with good RR
Session-based entry (likely Asian session scalp)
Ethereum (ETH): Buyers Are Back | Waiting For Next Target NowETH is back with strong buyside dominance after the choppy rollercoaster movement. Since our entry we have filled so far our first target area, where we took some profits and moved SL to entry so now we are waiting for the next target to be hit to take more profits and move SL once again closer.
Swallow Academy
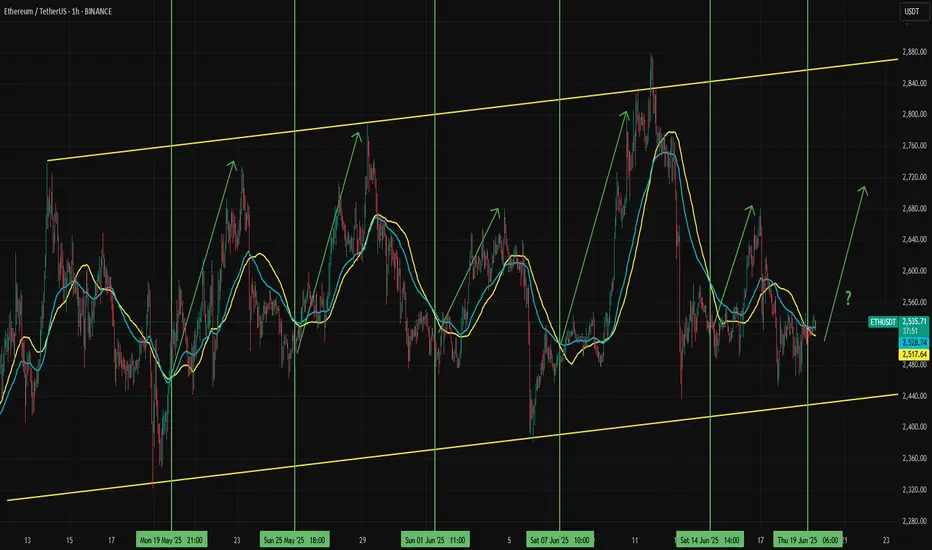
Potential Long Setup for EthereumEther stabilized in a slightly positive trend after breaking the previous uptrend. Since mid-May, this flattish trend channel has continued, offering some trading opportunities within it.
When Ethereum approaches the lower line and the 50 EMA crosses above the 50 SMA, an ETHUSDT surge has followed each time since the channel formed. Traders could expect a similar move again. However, the key risk is potential negative pressure on stock markets due to geopolitical concerns and the correlation effect on the crypto market and a break of the channel.
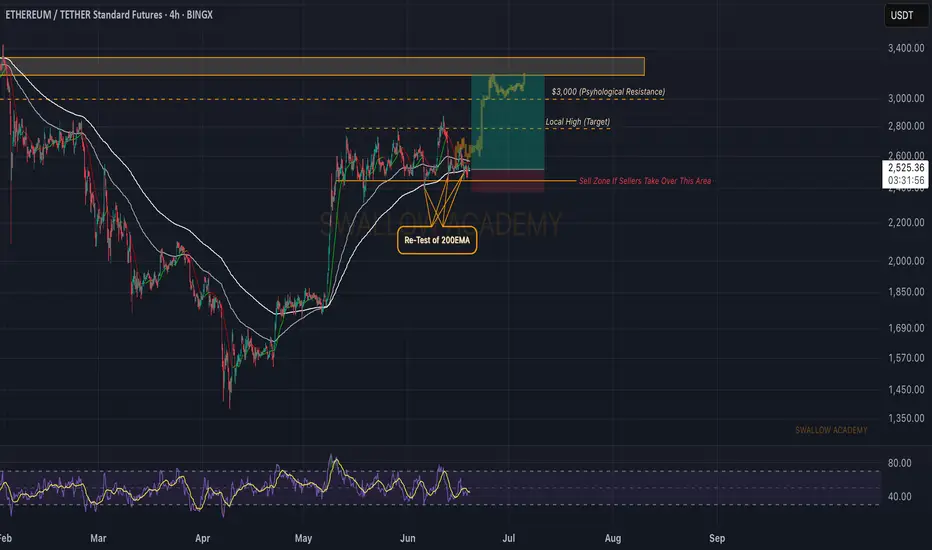
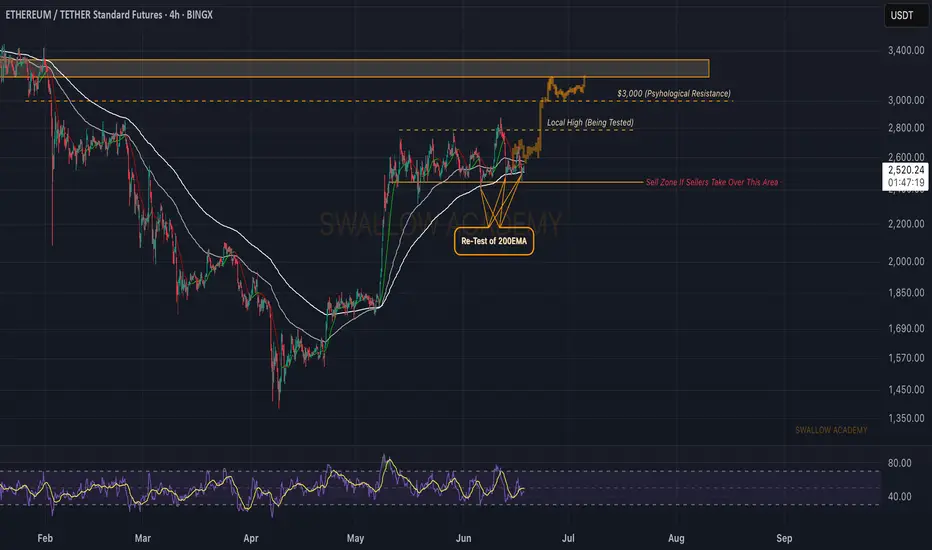
Ethereum (ETH): Are We Doomed or Will We See $3000?Struggle is huge on Ethereum, where we are at a major support area (or let's call it a neckline, as it suits it more here), which is also close to the 200EMA.
So strong a base has formed there that each time we reach that point, we see a strong bounce and dominance from buyers, and yet we always go back to that area.
So, same as Bitcoin, we wait for any more confirmations near the current zone. If we see a breakdown from the neckline area, the drop will be nasty; if we see proper buyside dominance, we will be heading for $3000. So let's wait...
Swallow Academy
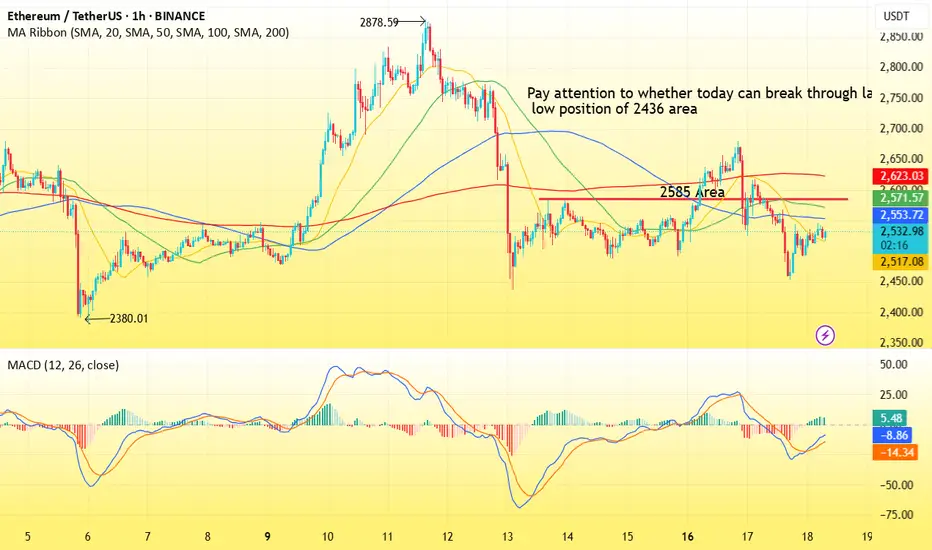
ETH(20250618) market analysis and operationTechnical analysis of ETH contract on June 18:
Today, the large-cycle daily level closed with a small negative line yesterday, and the K-line pattern continued to fall. The price was at a high level but had no strength and continued trend. Instead, it was easy to fall under normal pressure. The attached indicator was dead cross, and the big trend was still very obvious. In this way, we are more optimistic about the price continuing to fall and breaking the low point in the future; the short-cycle hourly chart fell continuously yesterday, and the European session continued to break the previous day's low point in the US session. It is still in a corrective trend, but according to the current trend, it is highly likely to continue today. Whether it can break down the low point of last week needs to be paid attention to. There is no room for operation during the day, so wait and see today, focusing on the strength and weakness of the European session and the unemployment data in the evening.
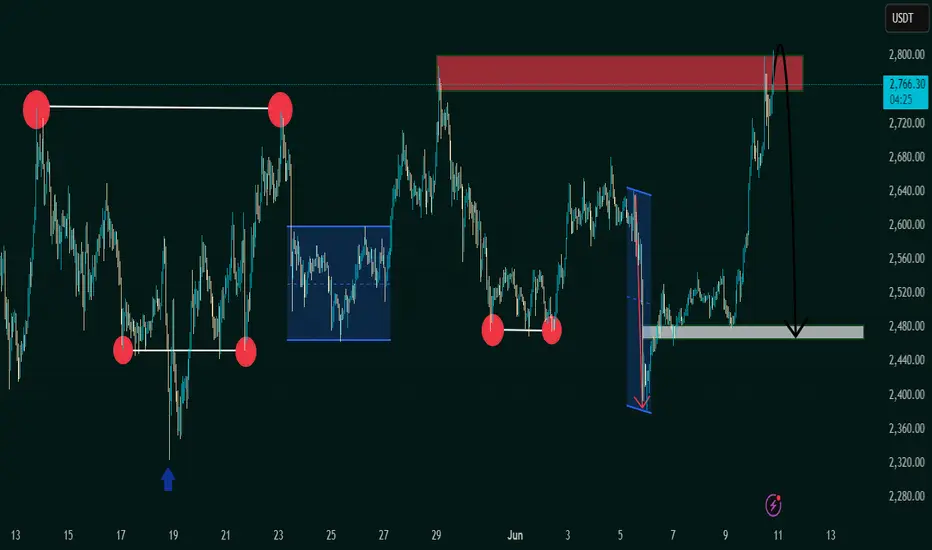
"Bearish Reversal Opportunity Following Supply Zone Rejection"1. Double Top Formation (Resistance Level Identified)
The chart displays a clear double top structure at the 2,760–2,800 USDT level.
This level has acted as a strong supply zone (highlighted in red), where price previously reversed, indicating heavy selling interest.
Current price action has retested this resistance zone and shown signs of rejection.
2. Liquidity Sweeps & False Breakouts
On the left side of the chart, an aggressive downward wick (marked with a blue arrow) suggests a liquidity sweep below a key low before strong bullish momentum returned.
This type of price action indicates smart money involvement, designed to remove weak hands before pushing price higher.
3. Accumulation Phases (Sideways Consolidation)
Multiple accumulation ranges are highlighted with blue rectangles.
These ranges show horizontal consolidation, where price builds up energy before breakout.
The most recent breakout led to a vertical rally toward the resistance zone, signaling an end of the accumulation and a start of distribution.
4. Double Bottom Support Structure
Identified near the 2,480 level, marked by red circles.
This level has historically acted as demand/support, evidenced by multiple bounces from this price zone.
Now highlighted with a grey zone, it is projected to act as the next key support area.
5. Bearish Projection
A large black arrow suggests a forecasted bearish move from the current high (~2,800) back to the support zone (~2,480).
This aligns with the idea of a mean reversion or pullback after a strong bullish impulse.
---
Conclusion & Trade Idea:
🔻 Bias: Bearish (Short-term)
The chart presents a classic reversal pattern with a double top at a well-defined supply zone.
Entry could be considered after confirmation of rejection from this level.
🧠 Trade Plan Suggestion:
Entry: Short near 2,780–2,800 after bearish confirmation (e.g., bearish engulfing candle or break of structure).
Target: 2,480 (support zone).
Stop Loss: Above 2,820 (recent high).
Risk-Reward: Approximately 1:2.5 or better depending on execution.
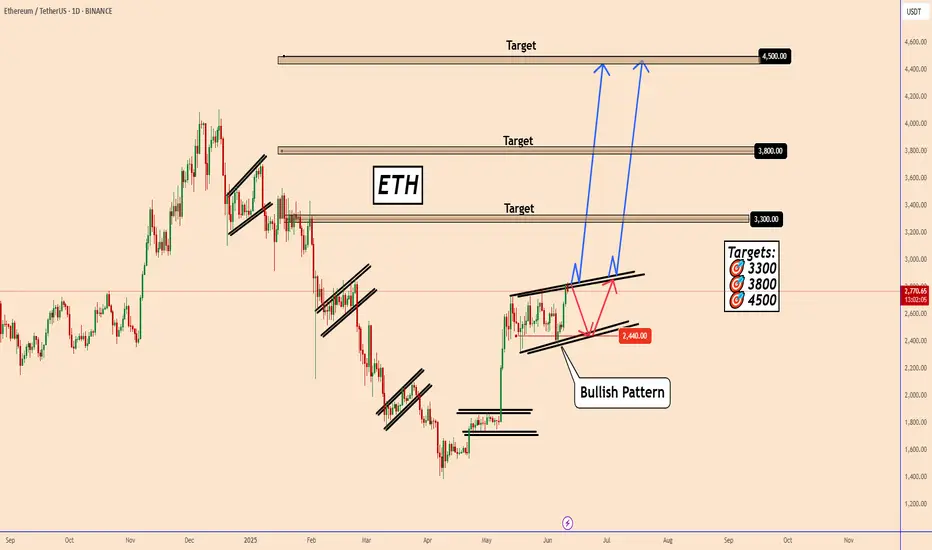
ETH: Bullish Momentum Emerging on the Daily ChartETH: Bullish Momentum Emerging on the Daily Chart
Since May 9, ETH has been consolidating for about a month, forming a bullish pattern. The price continues to fluctuate within the 2330 - 2800 range.
While the pattern appears bullish, it remains unclear whether it has fully completed. Without a decisive breakout accompanied by strong bullish volume, ETH could retreat to 2440, potentially forming a larger structure before resuming its upward move.
The broader outlook still suggests bullish momentum, but the market is not yet ready to initiate the next leg up.
Today's U.S.-China agreement and U.S. CPI data will be key events to watch.
Key Target Zones: 🎯 3300 🎯 3800 🎯
You may find more details in the chart!
Thank you and Good Luck!
❤️PS: Please support with a like or comment if you find this analysis useful for your trading day❤️
Bitcoin's Price Action Reveals A Bearish Ethereum—Back To BasicsBitcoin is bearish, top confirmed; we know Ethereum and Bitcoin move together in the exact same way. This means that Ethereum will also move lower.
Here we have a higher high but lacking strength, volume is dropping. There will be a continuation of the retrace.
Consider waiting (SHORT) until after the FED decision result. The market can remain slightly bearish until after the event. The drop will open the doors for new entry prices. Market conditions can always change.
We are live with a 20X SHORT on Bitcoin, Ethereum will do the same. Just a small drop (can be a strong drop) ending in a higher low followed by a new wave of growth. Not all charts/pairs/projects are the same. Some will move down while others move up. Sell at resistance, buy at support.
Namaste.

BITCOIN; Is It Printing a Lower High?BITCOIN Is it printing a lower high?
Well by the way is moving (playing lazy) and knowing that its 4hrs Bullish TIME Cycle is near the end we can only say that if it doesn't turn on the boosters then it will be in trouble.
Next drop will start soon and once we see how low bears were able to push price down we will know if target price of $118k will be possible by end of month/first week of July or not.
$114K started to show up on radar but with the TIME bulls have left I don't think will be possible to get there . Will see how bulls play their last hand of the month.
We'll follow with updates so stay tuned.
ETH: Short 19/06/25Trade Direction:
ETH Short
Risk Management:
- 0.5%
Reason for Entry:
- Failure to reclaim weekly open
- Loss of weekly open, monthly open, and Monday low
- H2 timeframe oversold but within a reclaimed bearish order block
- Clear bearish grind price action aligning with higher timeframe bearish trend
- Higher confidence in shorts at current level than higher up
Additional Notes:
- Total market cap looks heavy, global situation especially middle east is continuing to see a risk off mindset for risk assets like crypto.
- Until price gives me a reason not to have to assume this is continuing bearish.
- Potential to short higher if this fails
ETH | Long | 3Hrs | Target: 2,710This technical analysis is for informational and educational purposes only. It does not constitute financial advice. Remember to always research and consult with a professional before making investment decisions. Good luck! 📈💼🚀